
Key Takeaways:
- Wegovy Pill Milestone: Over 1 million people started using the Wegovy pill within 16 weeks of launch, making it the fastest GLP-1 product uptake in U.S. history.
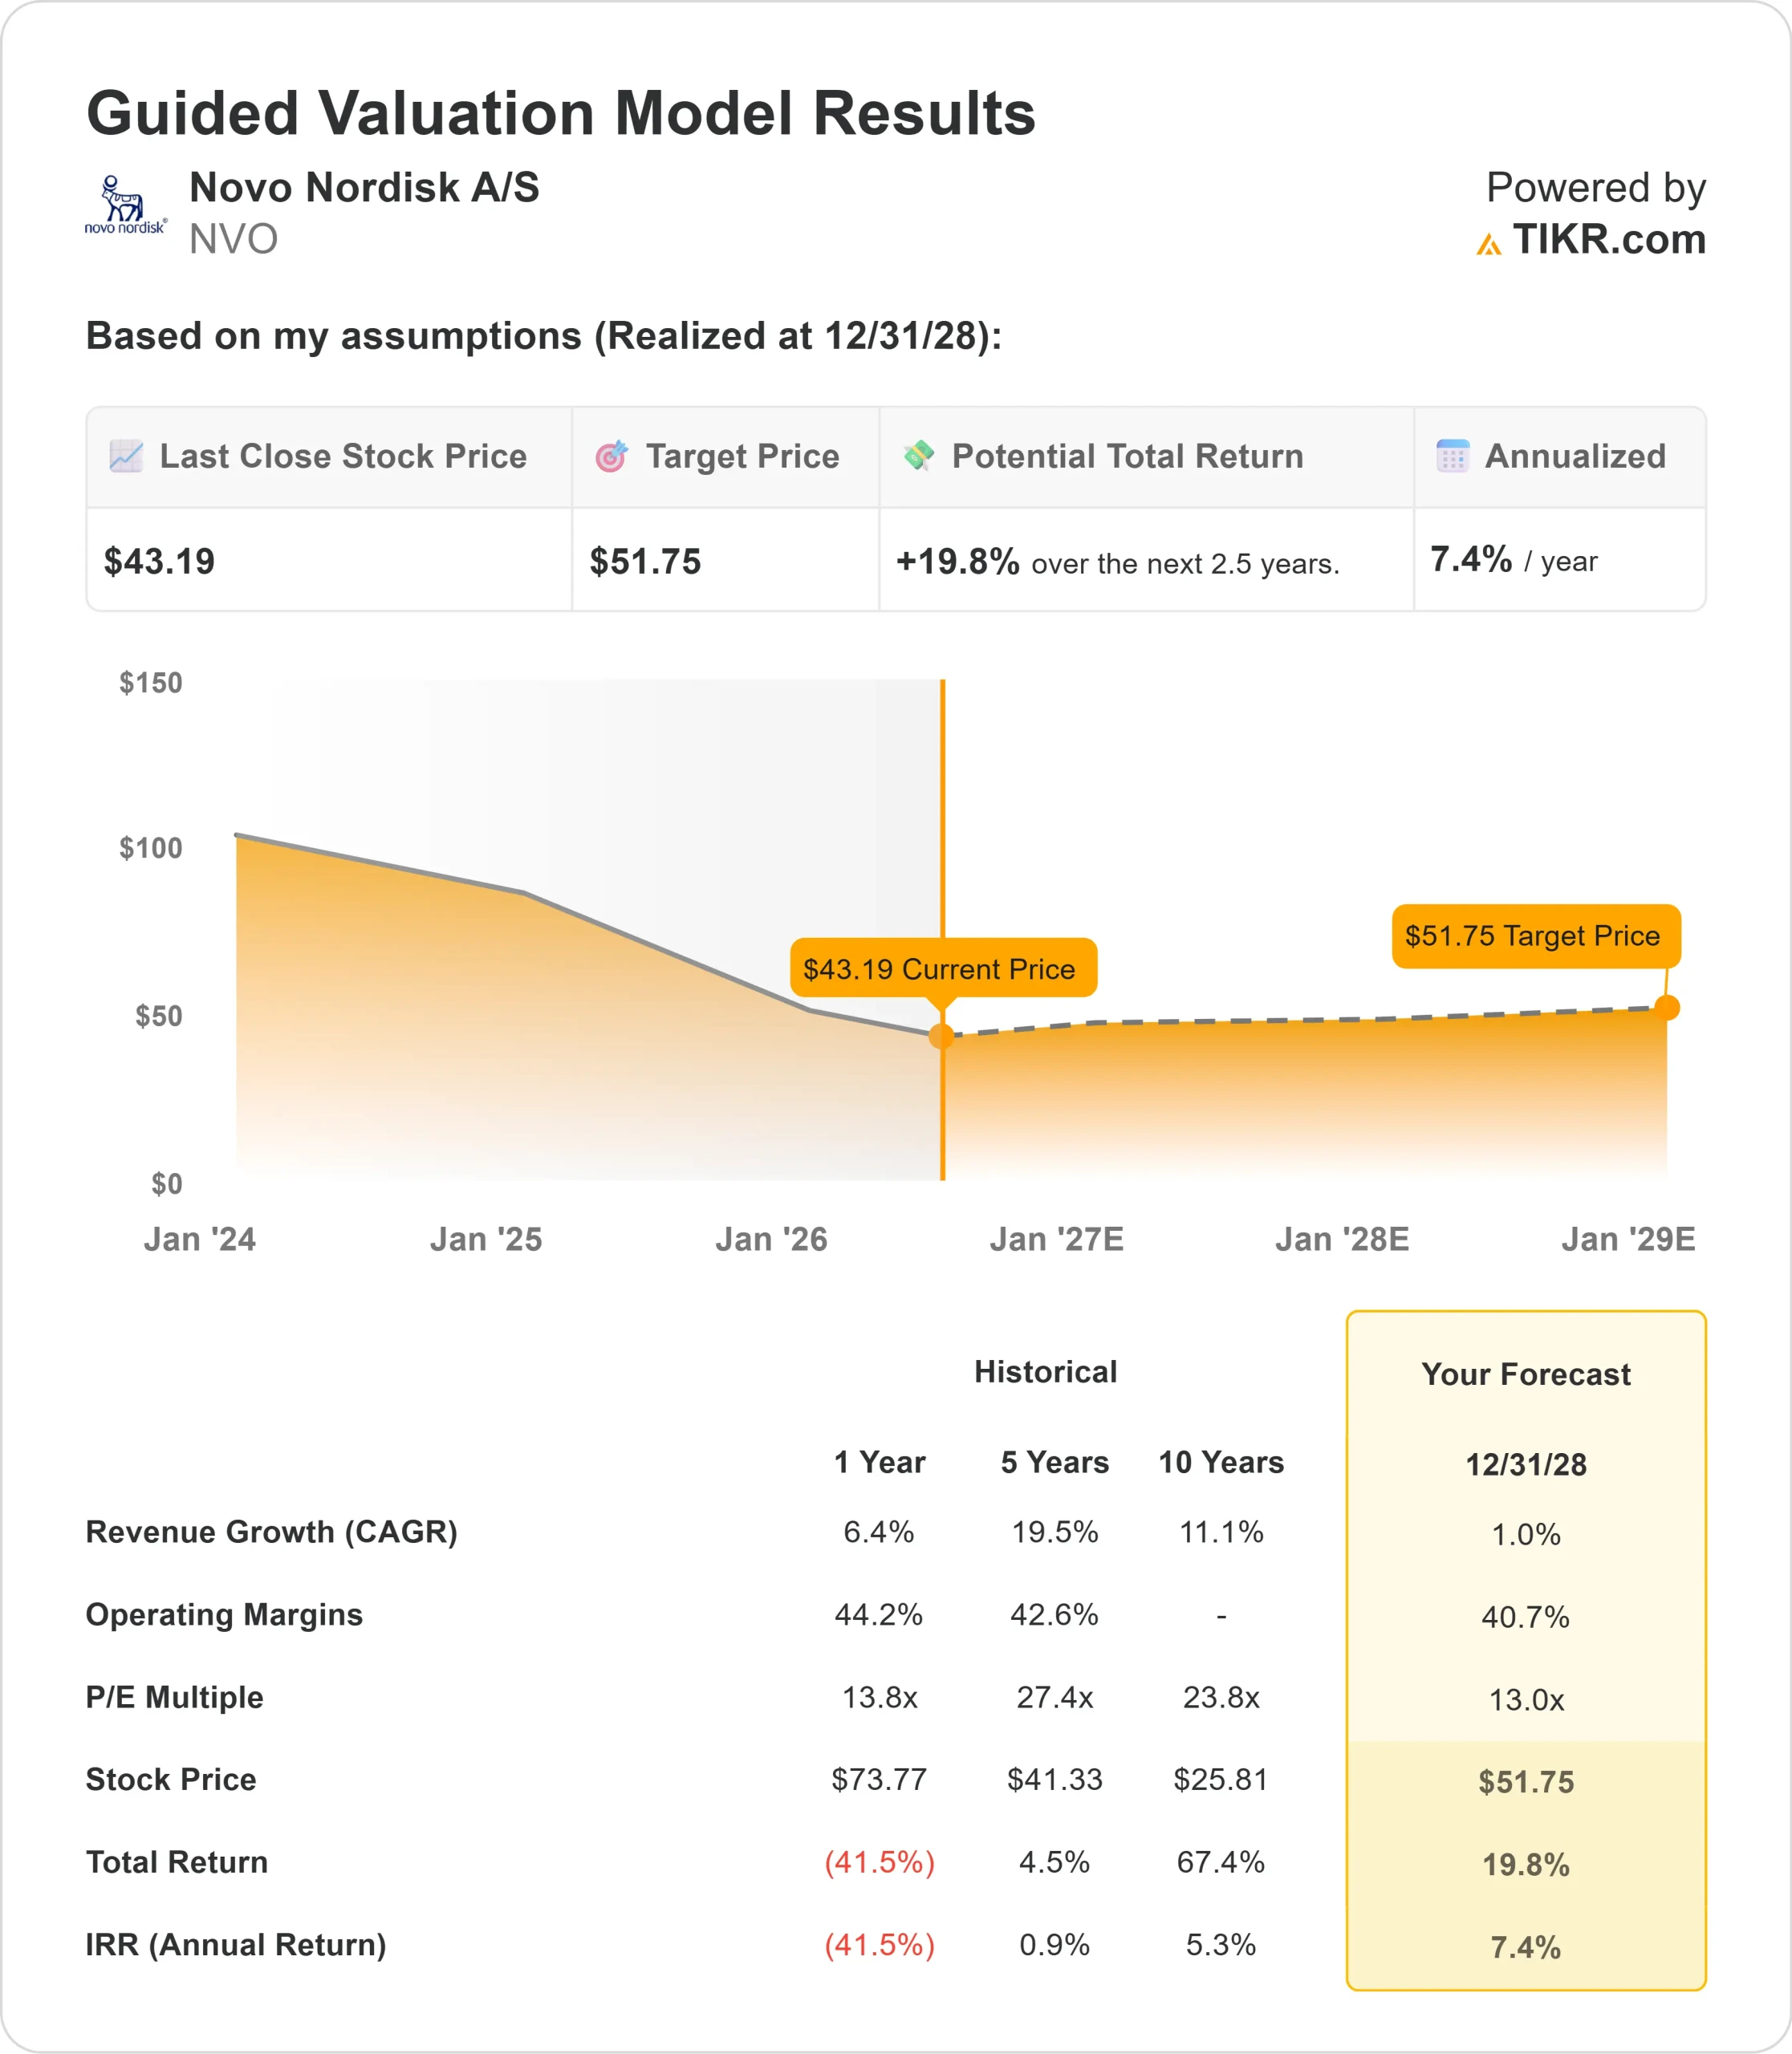
- Price Projection: Based on current execution, NVO stock could reach $52 by December 2028.
- Potential Gains: That target points to a 20% total return from the current price of $43.19.
- Annual Return: Investors could see roughly 7% growth each year over the next 2.5 years.
Now Live: Discover how much upside your favorite stocks could have using TIKR’s new Valuation Model (It’s free)>>>
Novo Nordisk (NVO) is navigating a challenging year while executing on multiple product launches. Adjusted sales declined 4% in Q1 2026 due to lower realized prices in the U.S., partly offset by international volume growth.
Obesity care sales grew 22% globally, with international operations up 44%.
- The Wegovy pill generated over 2 million total prescriptions since launch, with weekly prescriptions reaching 207,000 by mid-April.
- Wegovy High-Dose at 7.2 milligrams was approved in the U.S. and launched in April, achieving a mean weight loss of 20.7% in trials.
- The Wegovy franchise now holds roughly 65% new-to-brand prescription market share in anti-obesity medications.
- Novo Nordisk employs about 68,000 people, down nearly 10,000 from a year ago, as part of an ongoing transformation.
- The company raised its 2026 guidance, now expecting adjusted sales and operating profit to decline between 4% and 12% at constant currencies.
Despite the sharp pullback, NVO trades around $43. Investors who believe the worst of the pricing headwinds are behind the business may see the current price as a long entry point.
See analysts’ full growth forecasts and estimates for NVO stock (It’s free) >>>
What the Model Says for Novo Nordisk Stock
We looked at Novo Nordisk as a company that built one of the most successful product franchises in pharmaceutical history, now facing pricing pressure and intensifying competition in its core obesity and diabetes markets.
- The near-term picture is complicated. U.S. GLP-1 diabetes sales fell 11% in Q1, hit by price erosion and reduced Medicaid coverage.
- Adjusted gross margin compressed to 80.6% from 83.5% a year ago.
- But the Wegovy pill launch is changing the story.
- Close to 80% of pill users are new to GLP-1 treatment, meaning it is expanding the market rather than just shifting existing patients.
The pipeline adds another dimension.
- CagriSema, combining cagrilintide and semaglutide, is expected to receive a U.S. FDA decision by the end of 2026.
- Etavopivat just met both co-primary endpoints in a sickle cell disease trial.
- Zenagamtide is entering Phase III.
- These programs extend Novo’s growth runway well beyond its current obesity platform.
Using 1% annual revenue growth and 40.7% operating margins, our guided model projects the stock reaching $52 within 2.5 years. This assumes a 13x price-to-earnings multiple, flat with the current forward P/E.
The conservative revenue assumption reflects near-term pricing headwinds and competition, with recovery expected as new products scale.
Our Valuation Assumptions
Estimate a company’s fair value instantly (Free with TIKR) >>>
Our Valuation Assumptions
TIKR’s Valuation Model lets you plug in your own assumptions for a company’s revenue growth, operating margins, and P/E multiple, and calculates the stock’s expected returns.
Here’s what we used for NVO stock:
1. Revenue Growth: 1%
Revenue grew 6.4% over the past year and 19.5% annually over five years. Near-term growth is compressed by U.S. price erosion, lower Medicaid obesity coverage, and patent expiries in some international markets.
Recovery should come from Wegovy pill scaling, Wegovy HD adoption, and the eventual launch of CagriSema if approved.
2. Operating margins: 40.7%
EBIT margins held at 41.3% over the trailing year, a level that has been remarkably stable across three, five, and ten-year periods.
Management targets 40% operating margins for 2026, reinvesting cost savings from its headcount reduction program into R&D and commercial launches.
3. Exit P/E Multiple: 13x
NVO trades near 13x forward earnings today, well below its historical averages of 24–27x. We hold the multiple flat.
Historically, the stock commanded a premium for its growth profile. A return to revenue growth could drive meaningful re-rating over time.
Build your own Valuation Model to value any stock (It’s free!) >>>
What Happens If Things Go Better or Worse?
Pharmaceutical companies face pricing risk, patent cliffs, and pipeline uncertainty. Here’s how Novo Nordisk stock might perform under different scenarios through December 2031:
- Low Case: If revenue grows just 2% a year and net margins settle near 35.1%, investors still see a 36.5% total return (7.1% annually).
- Mid Case: With 2% growth and 37.4% margins, the model points to a 61.8% total return (11.2% annually).
- High Case: If new product approvals and international expansion push margins to 39.3%, returns could hit 85.9% total (14.6% annually).

See what analysts think about NVO stock right now (Free with TIKR) >>>
The range is wide given the number of moving parts.
In the low case, Wegovy pill growth stalls, CagriSema faces approval delays, and pricing pressure intensifies.
In the high case, the Wegovy pill becomes a blockbuster in both the U.S. and internationally, CagriSema launches successfully in 2027, and the multiple re-rates back toward historical averages as revenue growth resumes.
How Much Upside Does Novo Nordisk Stock Have From Here?
With TIKR’s new Valuation Model tool, you can estimate a stock’s potential share price in under a minute.
All it takes is three simple inputs:
- Revenue Growth
- Operating Margins
- Exit P/E Multiple
If you’re not sure what to enter, TIKR automatically fills in each input using analysts’ consensus estimates, giving you a quick, reliable starting point.
From there, TIKR calculates the potential share price and total returns under Bull, Base, and Bear scenarios so you can quickly see whether a stock looks undervalued or overvalued.
See a stock’s true value in under 60 seconds (Free with TIKR) >>>
Looking for New Opportunities?
- See what stocks billionaire investors are buying so you can follow the smart money.
- Analyze stocks in as little as 5 minutes with TIKR’s all-in-one, easy-to-use platform.
- The more rocks you overturn… the more opportunities you’ll uncover. Search 100K+ global stocks, global top investor holdings, and more with TIKR.
Disclaimer:
Please note that the articles on TIKR are not intended to serve as investment or financial advice from TIKR or our content team, nor are they recommendations to buy or sell any stocks. We create our content based on TIKR Terminal’s investment data and analysts’ estimates. Our analysis might not include recent company news or important updates. TIKR has no position in any stocks mentioned. Thank you for reading, and happy investing!