Key Takeaways:
- Seven-Year Streak: e.l.f. Beauty delivered its seventh consecutive year of industry-leading growth, with net sales up 25% and 29 straight quarters of gains.
- Price Projection: Based on current execution, ELF stock could reach $80 by March 2029.
- Potential Gains: That target points to a 25% total return from the current price of $63.99.
- Annual Return: Investors could see roughly 8% annual growth over the next 2.8 years.
Now Live: Discover how much upside your favorite stocks could have using TIKR’s new Valuation Model (It’s free)>>>
e.l.f. Beauty (ELF) closed fiscal 2026 with another strong year but a complicated near-term picture. Full-year net sales grew 25%, and adjusted EBITDA rose 13%, even while absorbing an average tariff rate of roughly 55%.
Rhode, acquired last August, delivered over $500 million in global retail sales and grew net sales over 80% year-over-year.
- Rhode was the #1 beauty brand at Sephora North America in fiscal 2026.
- Naturium delivered nearly $250 million in global retail sales, double its pre-acquisition level.
- e.l.f. Cosmetics grew U.S. market share by 115 basis points, the largest gain among nearly 1,000 brands tracked by Nielsen.
- Fiscal 2027 guidance calls for net sales growth of 12% to 14% and adjusted EBITDA of $379 to $385 million.
- The company ended the year with $290 million in cash and a net debt to adjusted EBITDA of less than 2x.
Despite a strong track record, ELF trades at $63.99, well below its 2025 highs. Investors who believe the e.l.f. The brand slowdown is temporary, and Rhode, still in its early innings, may find the current price attractive.
See analysts’ full growth forecasts and estimates for ELF stock (It’s free) >>>
What the Model Says for e.l.f. Beauty Stock
We looked at e.l.f. Beauty is a multi-brand beauty platform navigating a speed bump on its core brand while two acquired brands are accelerating.
The near-term headwind is real. A dollar price increase taken in August 2025 to offset tariffs hit unit volumes harder than expected. Spring 2026 innovation also underperformed, reducing the typical halo lift on core items.
Management is responding with targeted price reductions. A cut on the Halo Glow skin tint from $18 to $14 generated a 38% unit lift on Amazon and a 36% lift across all retailers.
Meanwhile, Rhode and Naturium continue to grow fast. Rhode is expanding to Sephora across 19 European countries this September. Naturium is the fastest-growing brand among the top 50 skin care brands.
Non-e.l.f. brands now account for 30% of total global consumption, up from zero three years ago.
Using 9.4% annual revenue growth and 16.3% operating margins, our model projects the stock reaching $80 within 2.8 years.
This assumes an 18.4x price-to-earnings multiple, down from the current forward P/E of 19.4x. The modest compression reflects ongoing tariff uncertainty and the slower-than-expected core brand recovery.
Our Valuation Assumptions

Estimate a company’s fair value instantly (Free with TIKR) >>>
Our Valuation Assumptions
TIKR’s Valuation Model lets you plug in your own assumptions for a company’s revenue growth, operating margins, and P/E multiple, and calculates the stock’s expected returns.
Here’s what we used for ELF stock:
1. Revenue Growth: 9.4%
e.l.f. has grown revenue 24.6% over the past year and 38.8% annually over five years.
The near-term slowdown reflects tariff-driven price increases and a softer core brand. Management guides to 12% to 14% net sales growth in fiscal 2027, with Rhode adding roughly 9 percentage points.
Organic growth is expected at 4% to 5%, rebounding strongly in Q2 after a weak Q1.
2. Operating margins: 16.3%
EBIT margins were 11% over the trailing year, compressed by tariff costs and heavy marketing investment. Historically, margins have averaged around 16% over three- and five-year periods.
With tariffs now at 35% versus 55% last year and pricing actions starting to work, management targets an adjusted EBITDA margin of about 21% in fiscal 2027.
3. Exit P/E Multiple: 18.4x
ELF trades near 19x forward earnings today, far below its historical averages of 37–40x.
We assume slight compression to 18.4x. If the core brand recovers and Rhode’s European expansion delivers, the multiple could re-rate meaningfully higher.
Build your own Valuation Model to value any stock (It’s free!) >>>
What Happens If Things Go Better or Worse?
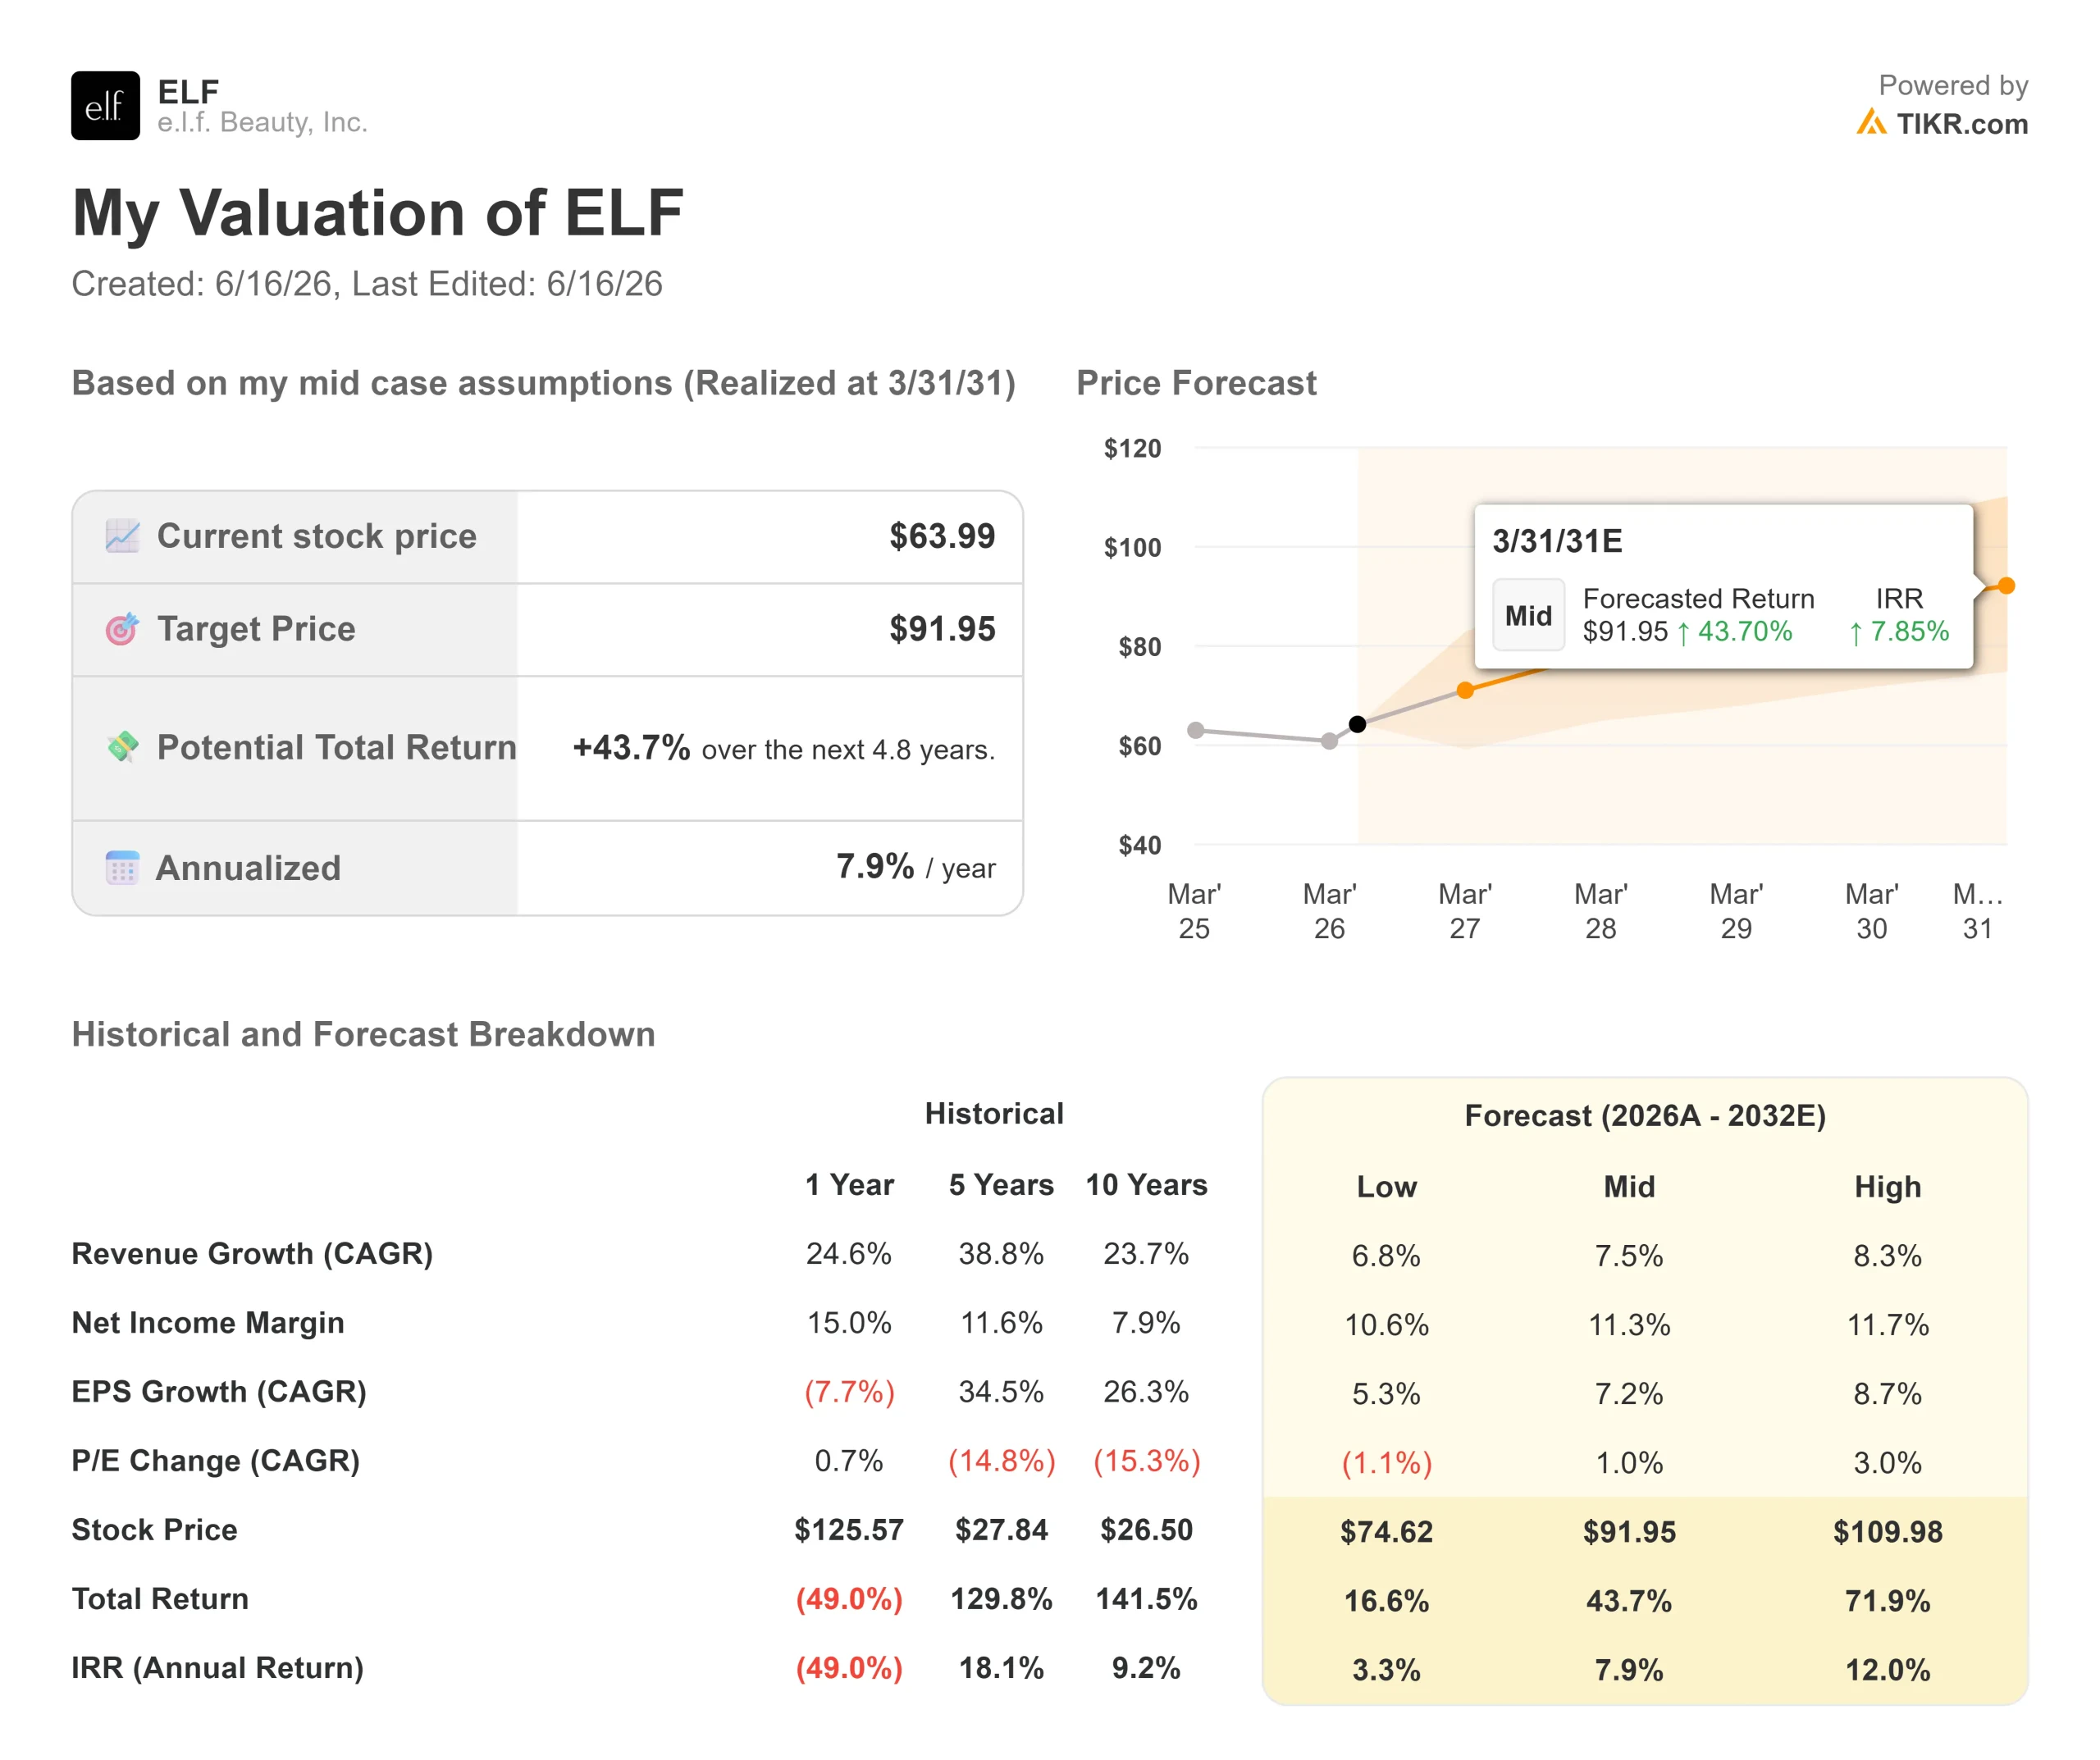
Consumer beauty brands face tariff risk, innovation cycles, and pricing sensitivity. Here’s how ELF stock might perform under different scenarios through March 2031:
- Low Case: If revenue grows 6.8% a year and net margins settle near 10.6%, investors see a 16.6% total return (3.3% annually).
- Mid Case: With 7.5% growth and 11.3% margins, the model points to a 43.7% total return (7.9% annually).
- High Case: If pricing actions and Rhode’s EU launch push 8.3% growth and margins reach 11.7%, returns could hit 71.9% total (12% annually).
See what analysts think about ELF stock right now (Free with TIKR) >>>
The range reflects the transition underway at e.l.f.
In the low case, core brand softness persists, tariff refunds are delayed, and the multiple stays are compressed.
In the high case, unit volumes recover quickly from targeted price cuts, fall innovation outperforms, Rhode becomes a global blockbuster, and the stock re-rates toward historical levels.
How Much Upside Does e.l.f. Beauty Stock Have From Here?
With TIKR’s new Valuation Model tool, you can estimate a stock’s potential share price in under a minute.
All it takes is three simple inputs:
- Revenue Growth
- Operating Margins
- Exit P/E Multiple
If you’re not sure what to enter, TIKR automatically fills in each input using analysts’ consensus estimates, giving you a quick, reliable starting point.
From there, TIKR calculates the potential share price and total returns under Bull, Base, and Bear scenarios so you can quickly see whether a stock looks undervalued or overvalued.
See a stock’s true value in under 60 seconds (Free with TIKR) >>>
Looking for New Opportunities?
- See what stock billionaire investors are buying so you can follow the smart money.
- Analyze stocks in as little as 5 minutes with TIKR’s all-in-one, easy-to-use platform.
- The more rocks you overturn… the more opportunities you’ll uncover. Search 100K+ global stocks, global top investor holdings, and more with TIKR.
Disclaimer:
Please note that the articles on TIKR are not intended to serve as investment or financial advice from TIKR or our content team, nor are they recommendations to buy or sell any stocks. We create our content based on TIKR Terminal’s investment data and analysts’ estimates. Our analysis might not include recent company news or important updates. TIKR has no position in any stocks mentioned. Thank you for reading, and happy investing!