Key Stats for Netflix Stock
- 52-Week Range: $70 – $129
- Current Price: $78
- Street Target: $114
- Street High Target: $151
- TIKR Model Target: $158
- Q1 2026 Revenue Growth: 16%
- Q1 2026 Operating Margin: 32%
- 2026 FCF Guidance: ~$12.5 billion, raised from ~$11 billion
Now Live: Discover how much upside your favorite stocks could have using TIKR’s new Valuation Model (It’s free)>>>
What a 34% Drawdown Looks Like When the Business Isn’t Broken
Netflix (NFLX) reported a strong first quarter back in April. Revenue grew 16% year over year to $12.25 billion, operating margin expanded to 32%, and the company collected a $2.8 billion breakup fee after walking away from its bid for Warner Bros. Discovery. Shares briefly traded above $108 that day.
Since then, the stock has done almost nothing but fall. It now trades around $78, a 52-week low and roughly 34% below its peak earlier this year.

The chart tells the story better than any single headline. Netflix spent January and February sliding into a mid-teens drawdown, recovered most of that ground by April, then rolled over hard right after the Q1 print and never really stopped. The steepest leg of the decline happened between late April and June, well after the actual earnings numbers were already known.
That timing matters, as it wasn’t just one bad quarter. It was a slow unwind driven by a Q2 guide that came in below Street estimates, the departure of co-founder Reed Hastings as board chairman in June, and lingering caution left over from the failed Warner Bros. deal.
None of those are signs that the underlying business is deteriorating. They’re the kind of sentiment-driven pressures that build when a stock has traded at a premium multiple and the market stops giving it the benefit of the doubt.
See analysts’ growth forecasts and price targets for Netflix stock (It’s free) >>>
Why the Cash Flow Chart Tells a Different Story Than the Price Chart
If Netflix’s business were actually weakening, free cash flow would be the first place it showed up. Instead, the opposite has happened.
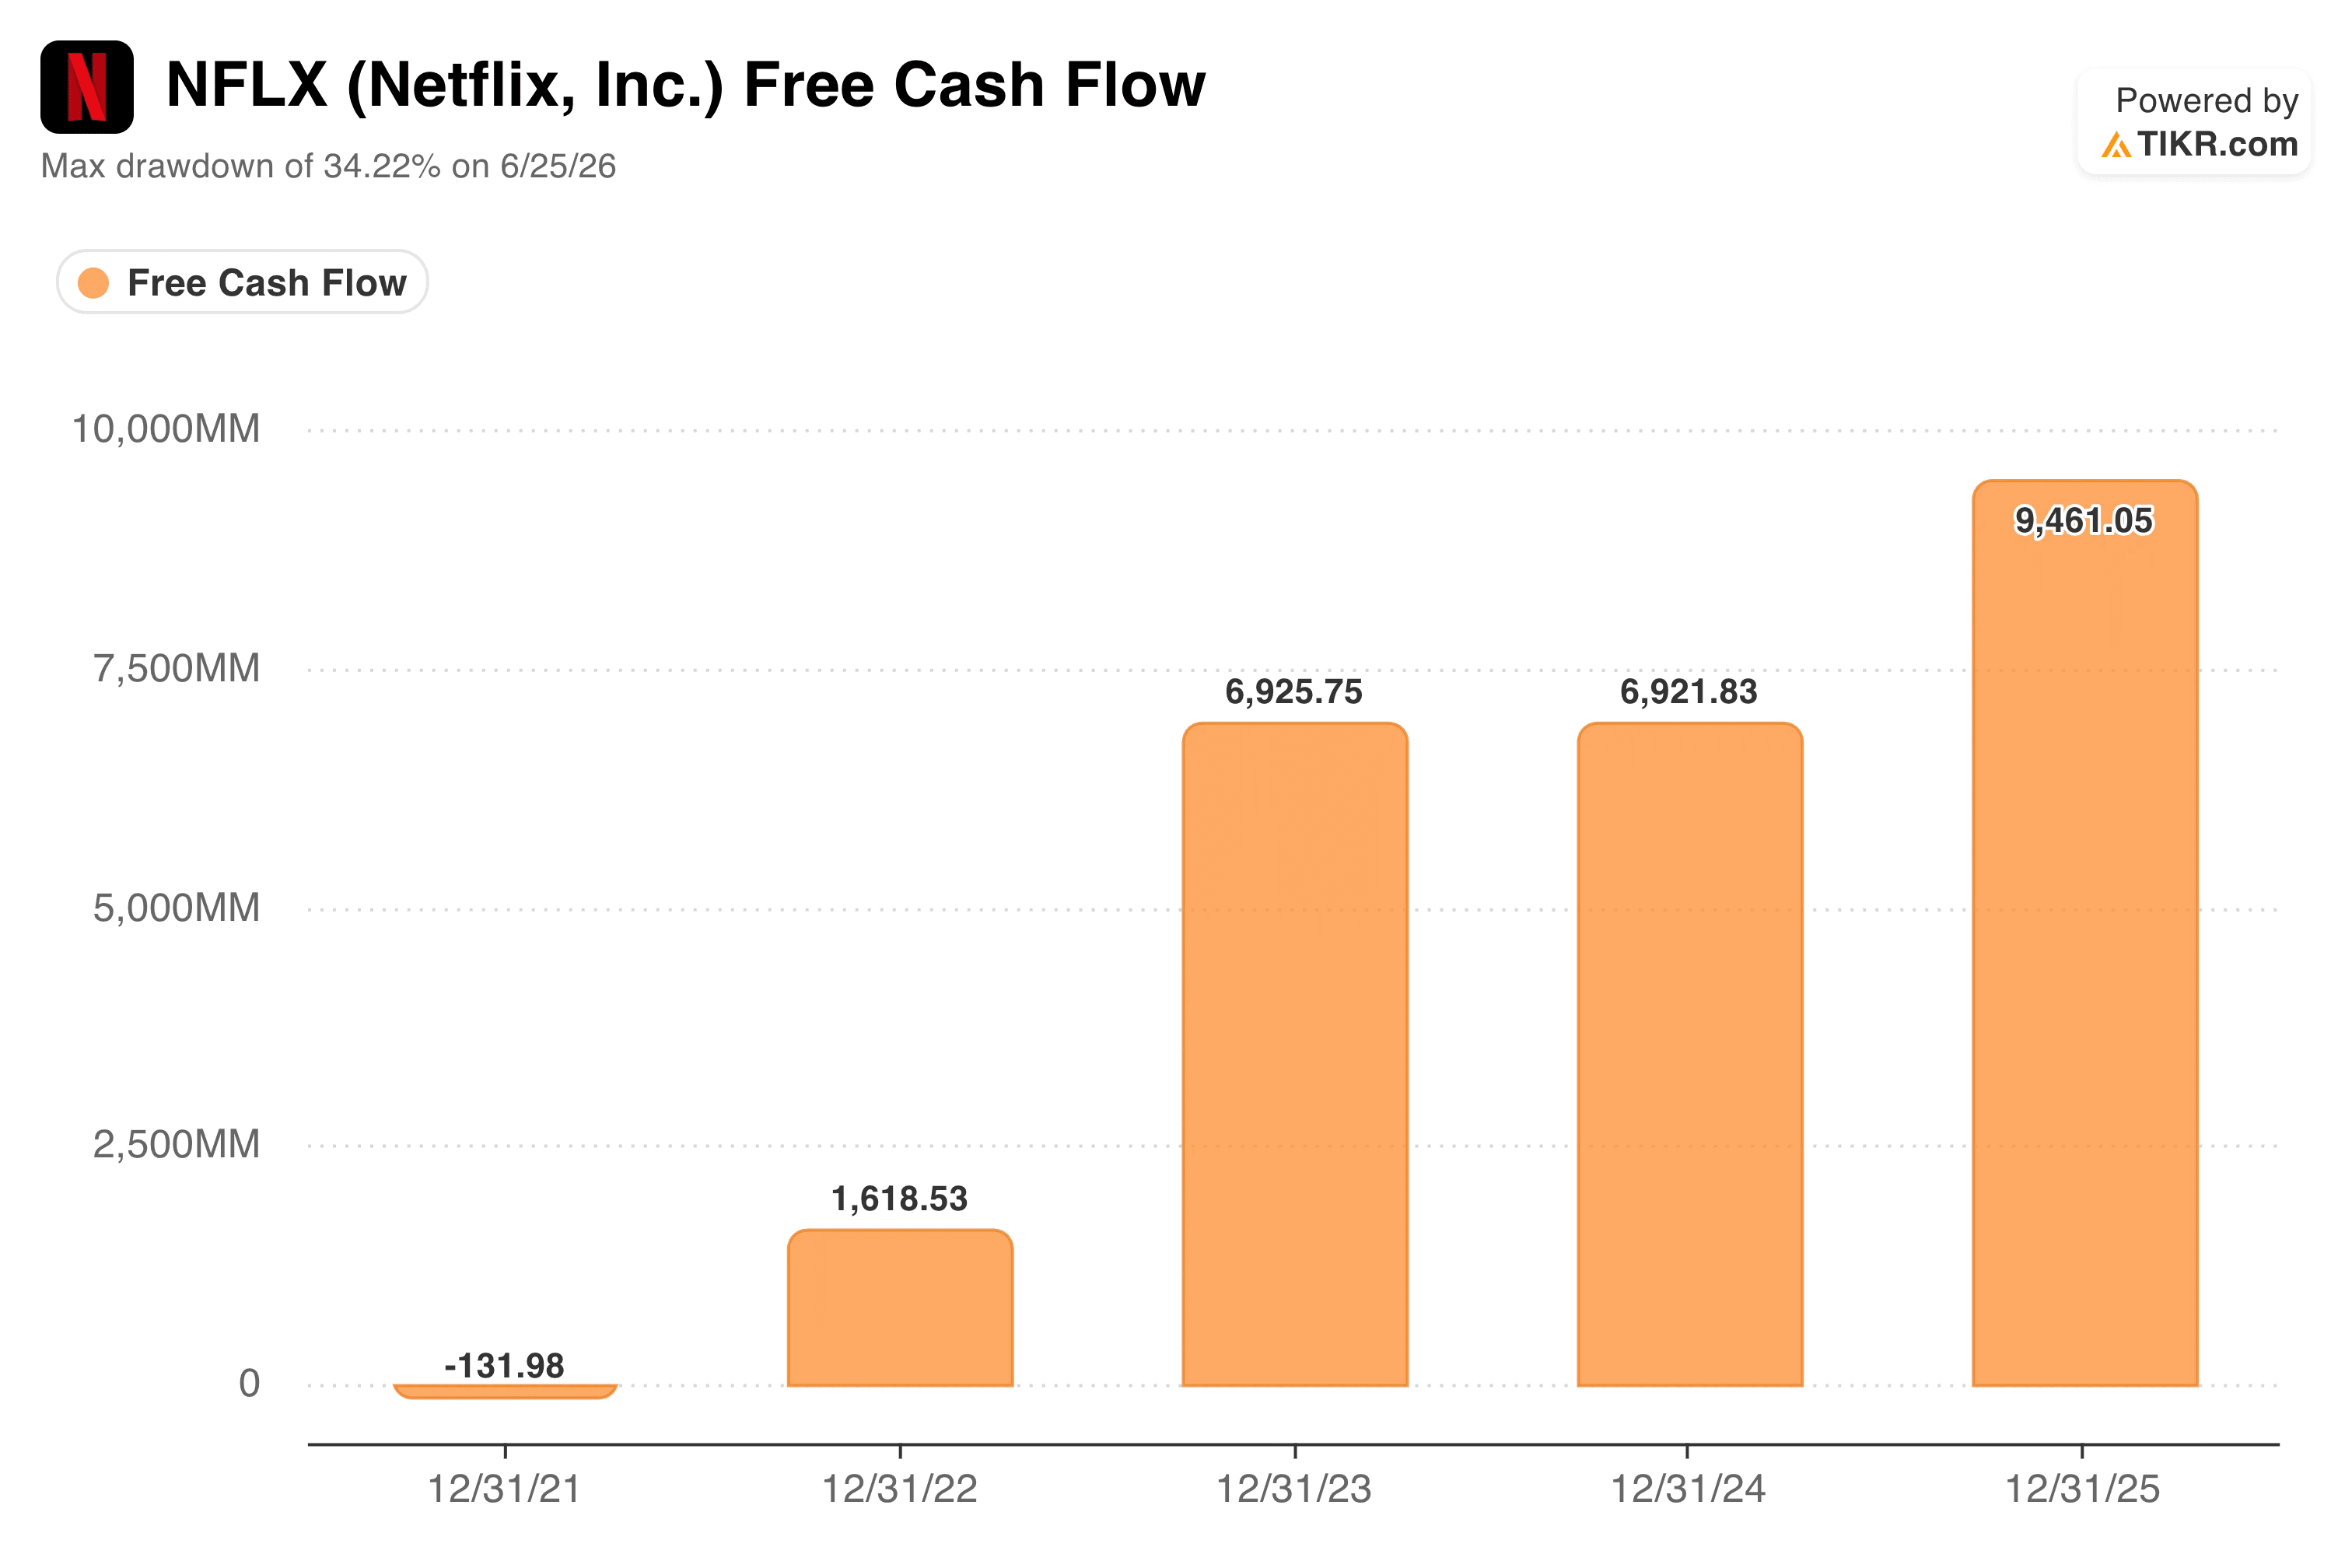
Free cash flow moved from roughly negative $130 million back in 2021 to around $9.5 billion in 2025, including two flatter years in between before stepping up again. Netflix has also raised its 2026 free cash flow guidance to about $12.5 billion, up from its earlier estimate of about $11 billion, largely thanks to the Warner Bros. termination fee flowing through.
That is a business generating meaningfully more cash each year, at the exact moment the stock has been cut by a third.
The disconnect is the point. A rising free cash flow line alongside a falling stock price usually suggests the market isn’t questioning the current numbers.
It’s questioning how many multiples those numbers deserve going forward, especially with a heavier content amortization schedule weighing on the first half of 2026 and full clarity on that not arriving until the back half of the year.
Estimate a company’s fair value instantly (Free with TIKR) >>>
What Does the Valuation Model Say?
TIKR’s model uses a current price of $78 against a mid-case target price around $158, implying a potential total return of around 100% and an annualized return of around 17% over the next four and a half years.

The assumptions behind that target are worth walking through rather than taking at face value. The model’s mid case has revenue growth slowing to around 10% a year, well below the 16% Netflix just posted, while net income margin expands into the low 30s from the low 20s over the same stretch.
That’s a meaningful bet on margin expansion doing more of the heavy lifting than top-line growth from here, which lines up with where Netflix’s own commentary has been heading: pricing power, a scaling ad business, and operating leverage, rather than a return to the subscriber-growth-fueled era of a few years ago.
It’s also worth noting the model assumes P/E compression continues, not reverses, over the forecast window. In other words, the target doesn’t require Wall Street to fall back in love with Netflix’s multiples. It just requires the business to keep growing into the price investors are already paying.
The Street’s own consensus target sits meaningfully lower, around $114, which suggests analysts are less willing than TIKR’s model to assume that combination of margin expansion and multiple stability plays out cleanly.
Should You Invest in Netflix Stock
Netflix’s drawdown looks far more like a valuation reset than a warning sign about the business. Revenue is still growing at double digits, margins are expanding, and free cash flow guidance just moved higher, not lower.
The real question is whether the next several quarters, starting with Q2 earnings, can convince the market that the content amortization drag is temporary rather than structural. Investors comfortable with that uncertainty are being offered a much wider entry point than Netflix has traded at in years.
Analyze Netflix on TIKR Free →
Looking for New Opportunities?
- See what stocks billionaire investors are buying so you can follow the smart money.
- Analyze stocks in as little as 5 minutes with TIKR’s all-in-one, easy-to-use platform.
- The more rocks you overturn… the more opportunities you’ll uncover. Search 100K+ global stocks, global top investor holdings, and more with TIKR.
Disclaimer:
Please note that the articles on TIKR are not intended to serve as investment or financial advice from TIKR or our content team, nor are they recommendations to buy or sell any stocks. We create our content based on TIKR Terminal’s investment data and analysts’ estimates. Our analysis might not include recent company news or important updates. TIKR has no position in any stocks mentioned. Thank you for reading, and happy investing!