Key Stats for Moody’s Stock
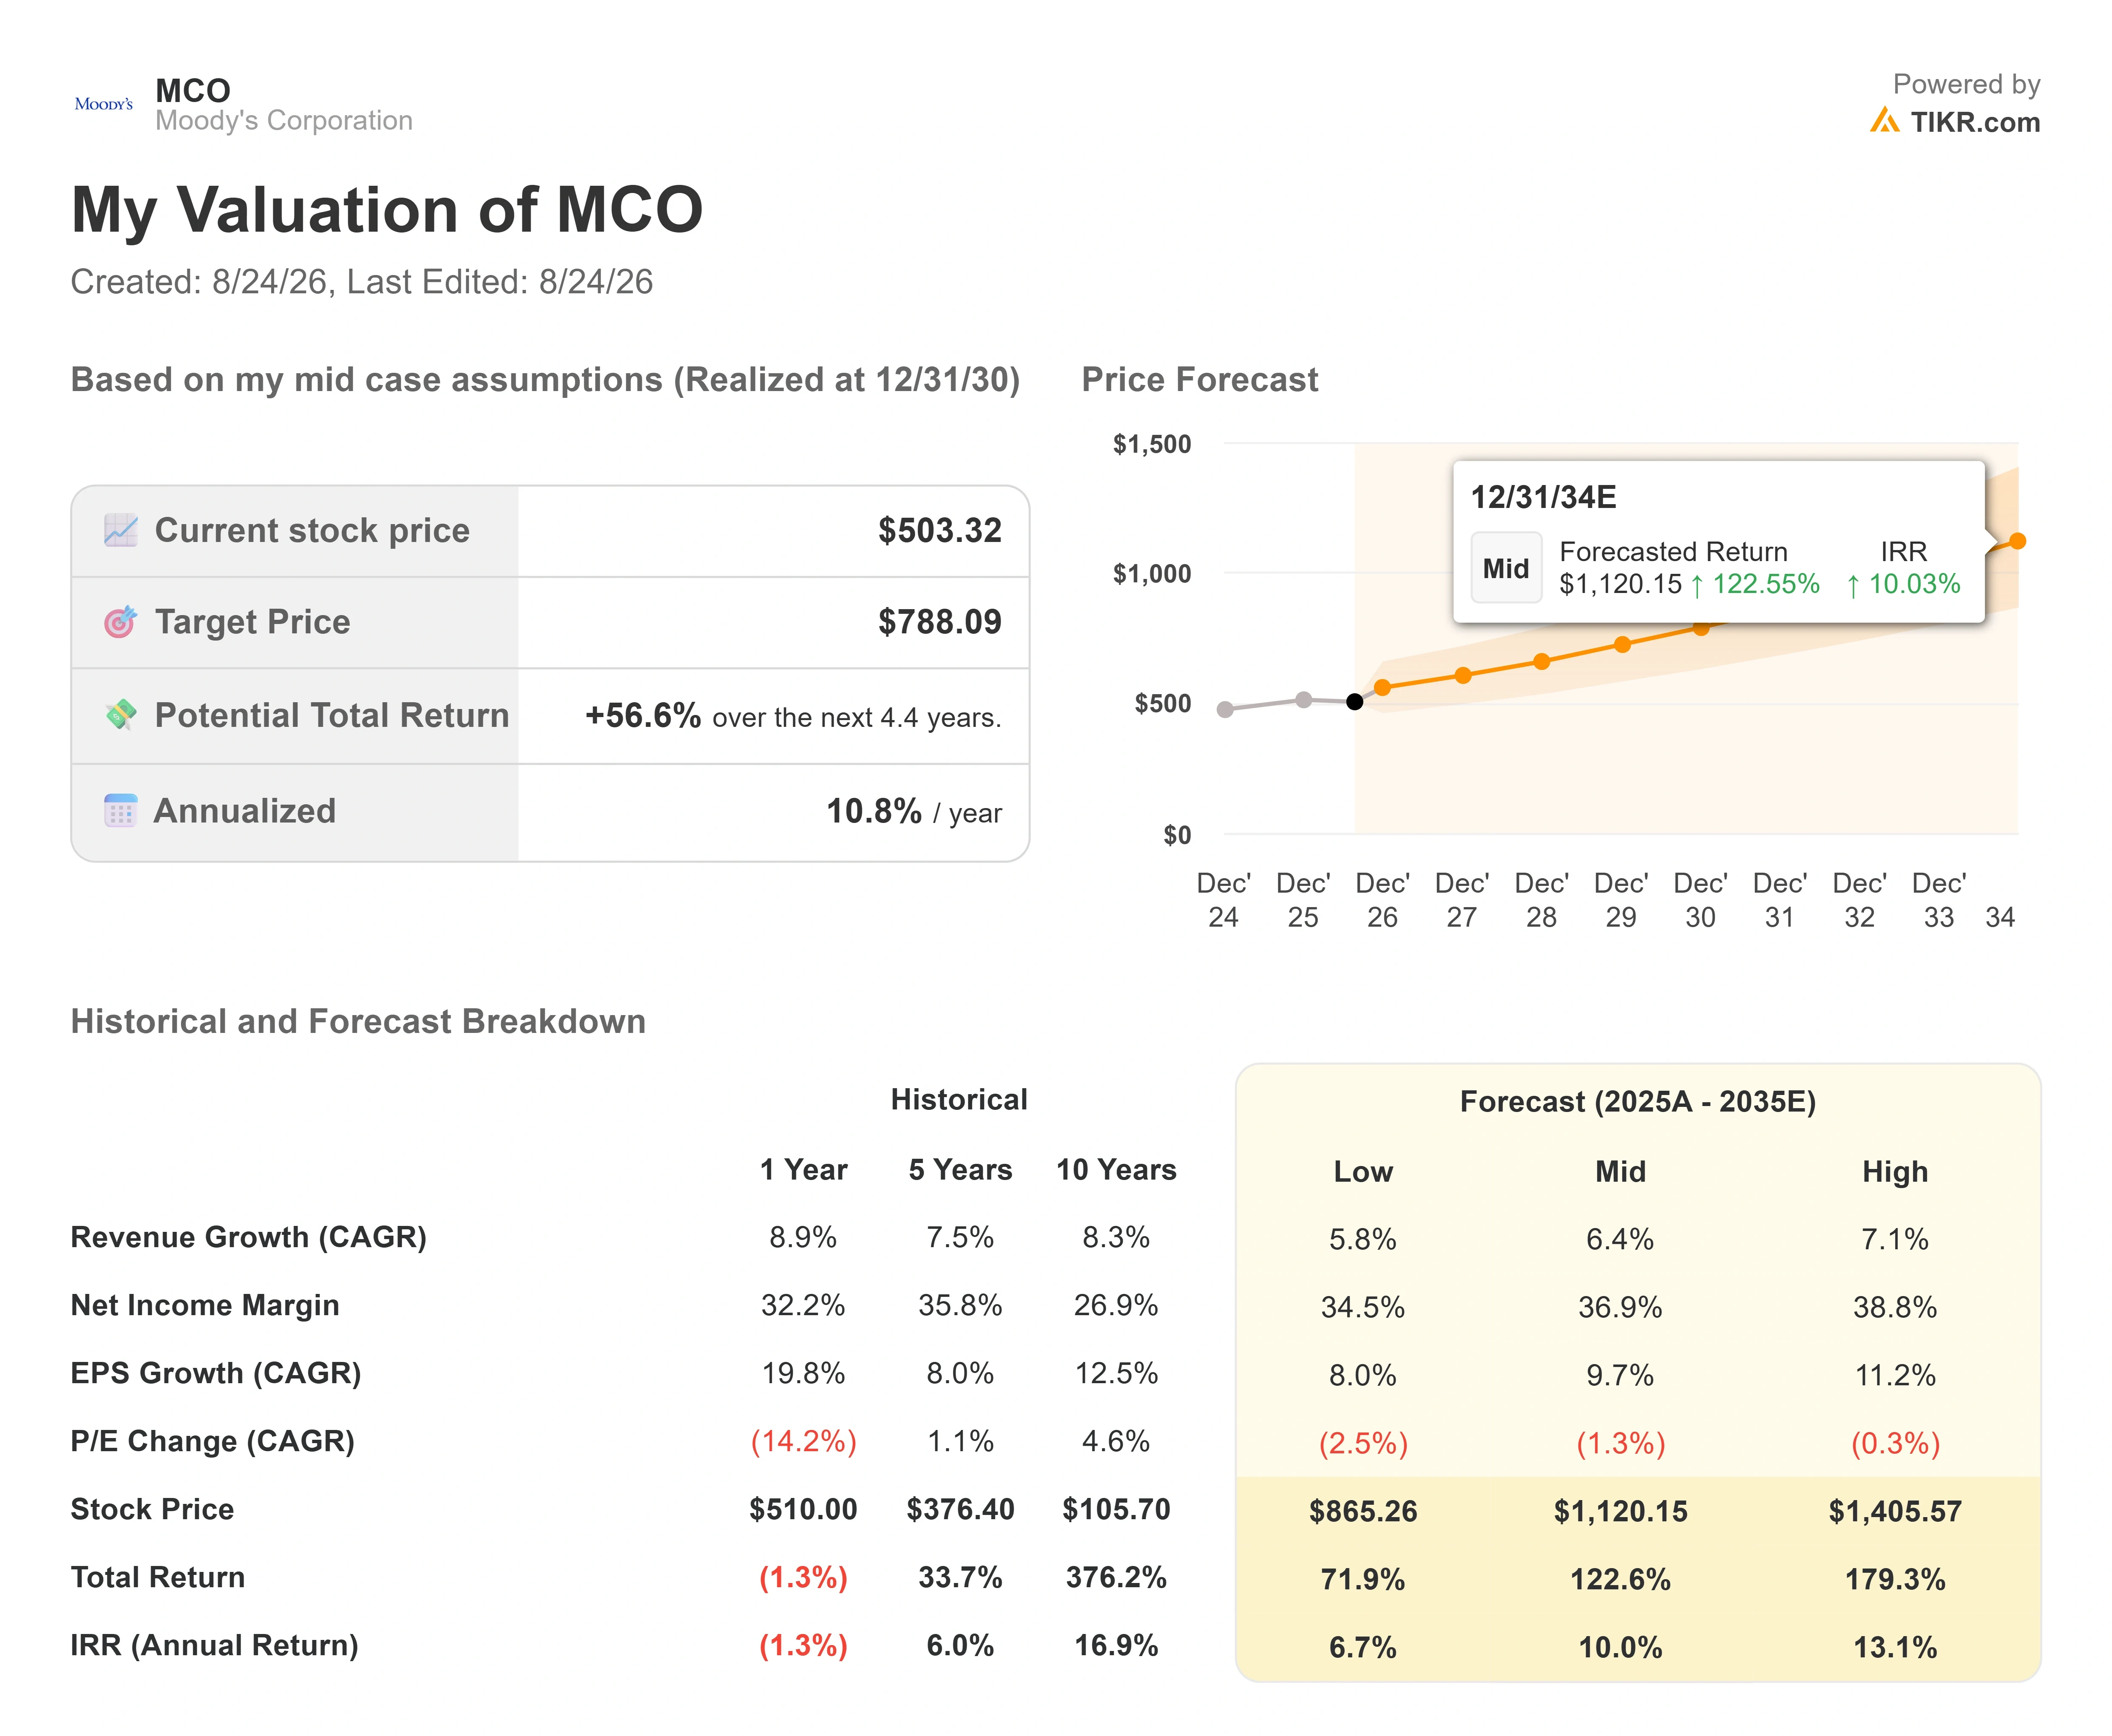
- Current Price: $503.32
- Target Price (Mid): ~$790
- Street Target: ~$560
- Potential Total Return: ~57%
- Annualized IRR: ~11% / year
Now Live: Discover how much upside your favorite stocks could have using TIKR’s new Valuation Model (It’s free) >>>
What Happened?
Moody’s Corporation (MCO) beat every line on its Q2 table, raised guidance, and watched its stock drop 3.6% on July 22. Shares sit near $503 today, below the 52-week high of $547. Yet the same day and the day after, the sell-side moved the other way: Wells Fargo raised its target to $597, and BofA to $580, per reporting compiled by CNN Markets, and the mean target holds near $560.
The market sold a clean beat, several analysts raised targets on it, and the TIKR model sits above both with a mid-case near $790 by the end of 2030. The question is whether the earnings power behind that number is durable, or whether the market was right to distrust the quarter.
Why the Sell-Side Stayed Constructive Into a Beat
Adjusted EPS of $4.68 cleared the $4.25 consensus by 10%, revenue grew 15%, and management lifted both its issuance and buyback outlooks. Coverage now sits at 13 Buys, 4 Outperforms, and 7 Holds, with no sells and a mean target around $560.
Moody’s rated more than $2 trillion of debt for a second straight quarter, helped by financing for AI data centers, and CEO Robert Fauber noted on the Q2 2026 earnings call that “hyperscalers have already exceeded our 2026 forecast for issuance and issued more debt this year than in the last 3 years combined.” Only about 20% of large Q2 issuance was AI-tied, though, so the volume rests on a diversified base rather than one theme. Management raised its issuance-growth outlook to mid-single digits but held revenue guidance at high single digits, because much of the extra volume is lower-yielding bank and data-center debt.

See historical and forward estimates for Moody’s stock (It’s free!) >>>
The Recurring Engine the Selloff Ignored
The more durable story is Moody’s Analytics, where recurring revenue is now 99% of the segment, annual recurring revenue reached roughly $3.7 billion, and trailing retention held at 95%.
Moody’s grew ARR nearly 60% with a top-three U.S. auto and property insurer, and more than doubled ARR with one of the world’s largest life insurers in APAC, which now uses Moody’s credit value-at-risk framework in its investment decisioning. On the AI question that worries investors, CFO Noemie Heuland argued that cheaper models should help rather than hurt: falling token costs, in her view, expand how much customers use Moody’s data more than they compress what Moody’s can charge, because regulated buyers need auditable outputs, not a generic model wrapper. The company is embedding that data inside Amazon’s and Microsoft’s AI tools, and in April, it made its agentic solutions available natively in Anthropic’s Claude environment.
Moody’s trades near 28 times forward price-to-earnings versus about 23 times for S&P Global and 22 times for CME Group, and its 10.9x forward EV/revenue sits well above the capital-markets peer median near 8.5x. That premium is defensible against a 76.9% return on equity and a ratings duopoly no AI-native startup can replicate quickly, but it means buyers here are paying for execution, not waiting for a discount.

See how Moody’s performs against its peers in TIKR (It’s free!) >>>
TIKR Advanced Model Analysis
- Current Price: $503.32
- Target Price (Mid): ~$790
- Potential Total Return: ~57%
- Annualized IRR: ~11% / year
See analysts’ growth forecasts and price targets for Moody’s stock (It’s free!) >>>
The TIKR model’s mid-case values Moody’s at roughly $790 by the end of 2030, about 57% above today’s price, or an 11% annualized return in that scenario. That sits well above the Street’s mean target near $560, because the two measure different horizons: the model runs to 2030, the Street runs about twelve months.
The mid-case leans on two revenue drivers: durable issuance growth from AI-infrastructure and private-credit financing, and high-single-digit recurring-revenue growth in Moody’s Analytics as its AI distribution deepens. The margin driver is operating leverage, the same dynamic that pushed the MIS segment margin to 68.3% in Q2 as record volume flowed through with little added cost. The model assumes the net income margin expands toward 37% from around 35% today.
The primary risk is cyclicality. A rate shock or a risk-off window could stall the issuance the thesis leans on, and because much of the return depends on the earnings multiple holding, weaker issuance would compress both the multiple and the target. The reverse is the upside: if issuance keeps running above management’s moderated second-half assumptions, the target moves higher. The mid-case reflects steady execution rather than a boom or a bust.
Conclusion
The next test is the Q3 print on October 27. Management is already guided to low-single-digit MIS revenue growth as summer issuance slows, so the number that matters is not the headline but Moody’s Analytics ARR growth. High single digits confirms the recurring engine is intact; a slip toward mid-single digits, paired with softer issuance commentary, would say the AI-distribution story is monetizing slower than the price assumes. Watch the ARR line first, the issuance guide second.
See what stocks billionaire investors are buying so you can follow the smart money with TIKR.
Should You Invest in Moody’s?
The only way to really know is to look at the numbers yourself. TIKR gives you free access to the same institutional-quality financial data that professional analysts use to answer exactly that question.
Pull up Moody’s, and you’ll see years of historical financials, what Wall Street analysts expect for revenue and earnings in the quarters ahead, how valuation multiples have moved over time, and whether price targets are trending up or down.
You can build a free watchlist to track Moody’s alongside every other stock on your radar. No credit card required. Just the data you need to decide for yourself.
Analyze Moody’s on TIKR Free →
Looking for New Opportunities?
- See what stocks billionaire investors are buying so you can follow the smart money.
- Analyze stocks in as little as 5 minutes with TIKR’s all-in-one, easy-to-use platform.
- The more rocks you overturn… the more opportunities you’ll uncover. Search 100K+ global stocks, global top investor holdings, and more with TIKR.
Disclaimer:
Please note that the articles on TIKR are not intended to serve as investment or financial advice from TIKR or our content team, nor are they recommendations to buy or sell any stocks. We create our content based on TIKR Terminal’s investment data and analysts’ estimates. Our analysis might not include recent company news or important updates. TIKR has no position in any stocks mentioned. Thank you for reading, and happy investing!