Key Stats for Freeport-McMoRan Stock
- Price change for Freeport-McMoRan stock in last 1 month: 21%
- $FCX Stock Price as of Aug. 21: $77
- 52-Week High: $77
- $FCX Stock Price Target: $72
Now Live: Discover how much upside your favorite stocks could have using TIKR’s new Valuation Model (It’s free)>>>
What Happened?
Freeport-McMoRan (FCX) stock jumped almost 8% on Friday, building on a steady climb from the low $60s in late July.
- The move follows a strong Q2 earnings report that beat expectations across the board. Adjusted earnings per share came in at $0.74, well above the $0.62 analysts had forecast.
- Revenue hit $7.03 billion, topping estimates of roughly $6.7 billion, driven by strong production of copper, gold, and molybdenum.
- The quarter wasn’t propped up by one-time gains either.
- Net income from continuing operations came in around $1.39 billion, with operating income near $2.00 billion, putting the company’s operating margin above 27%.
- That suggests Freeport-McMoRan isn’t just benefiting from favorable copper prices; it’s also running an efficient operation.
Looking ahead, management guided for a big jump in production volumes through 2028, alongside a hefty $4.8 billion capital spending plan for 2027 tied to growth projects.
The good news for investors is that Freeport-McMoRan stock isn’t relying on new debt or equity to fund this growth.
The company expects about $8.3 billion in operating cash flow for the full year, which comfortably covers the roughly $4.3 billion in planned capital spending, with the remaining cash split toward shareholder returns.
The company’s Grasberg Block Cave mine, one of its most closely watched assets, is ramping up on schedule. That project, combined with progress at its U.S., South American, and Chilean operations, has kept investors optimistic about the company’s longer-term growth story tied to global electrification trends.
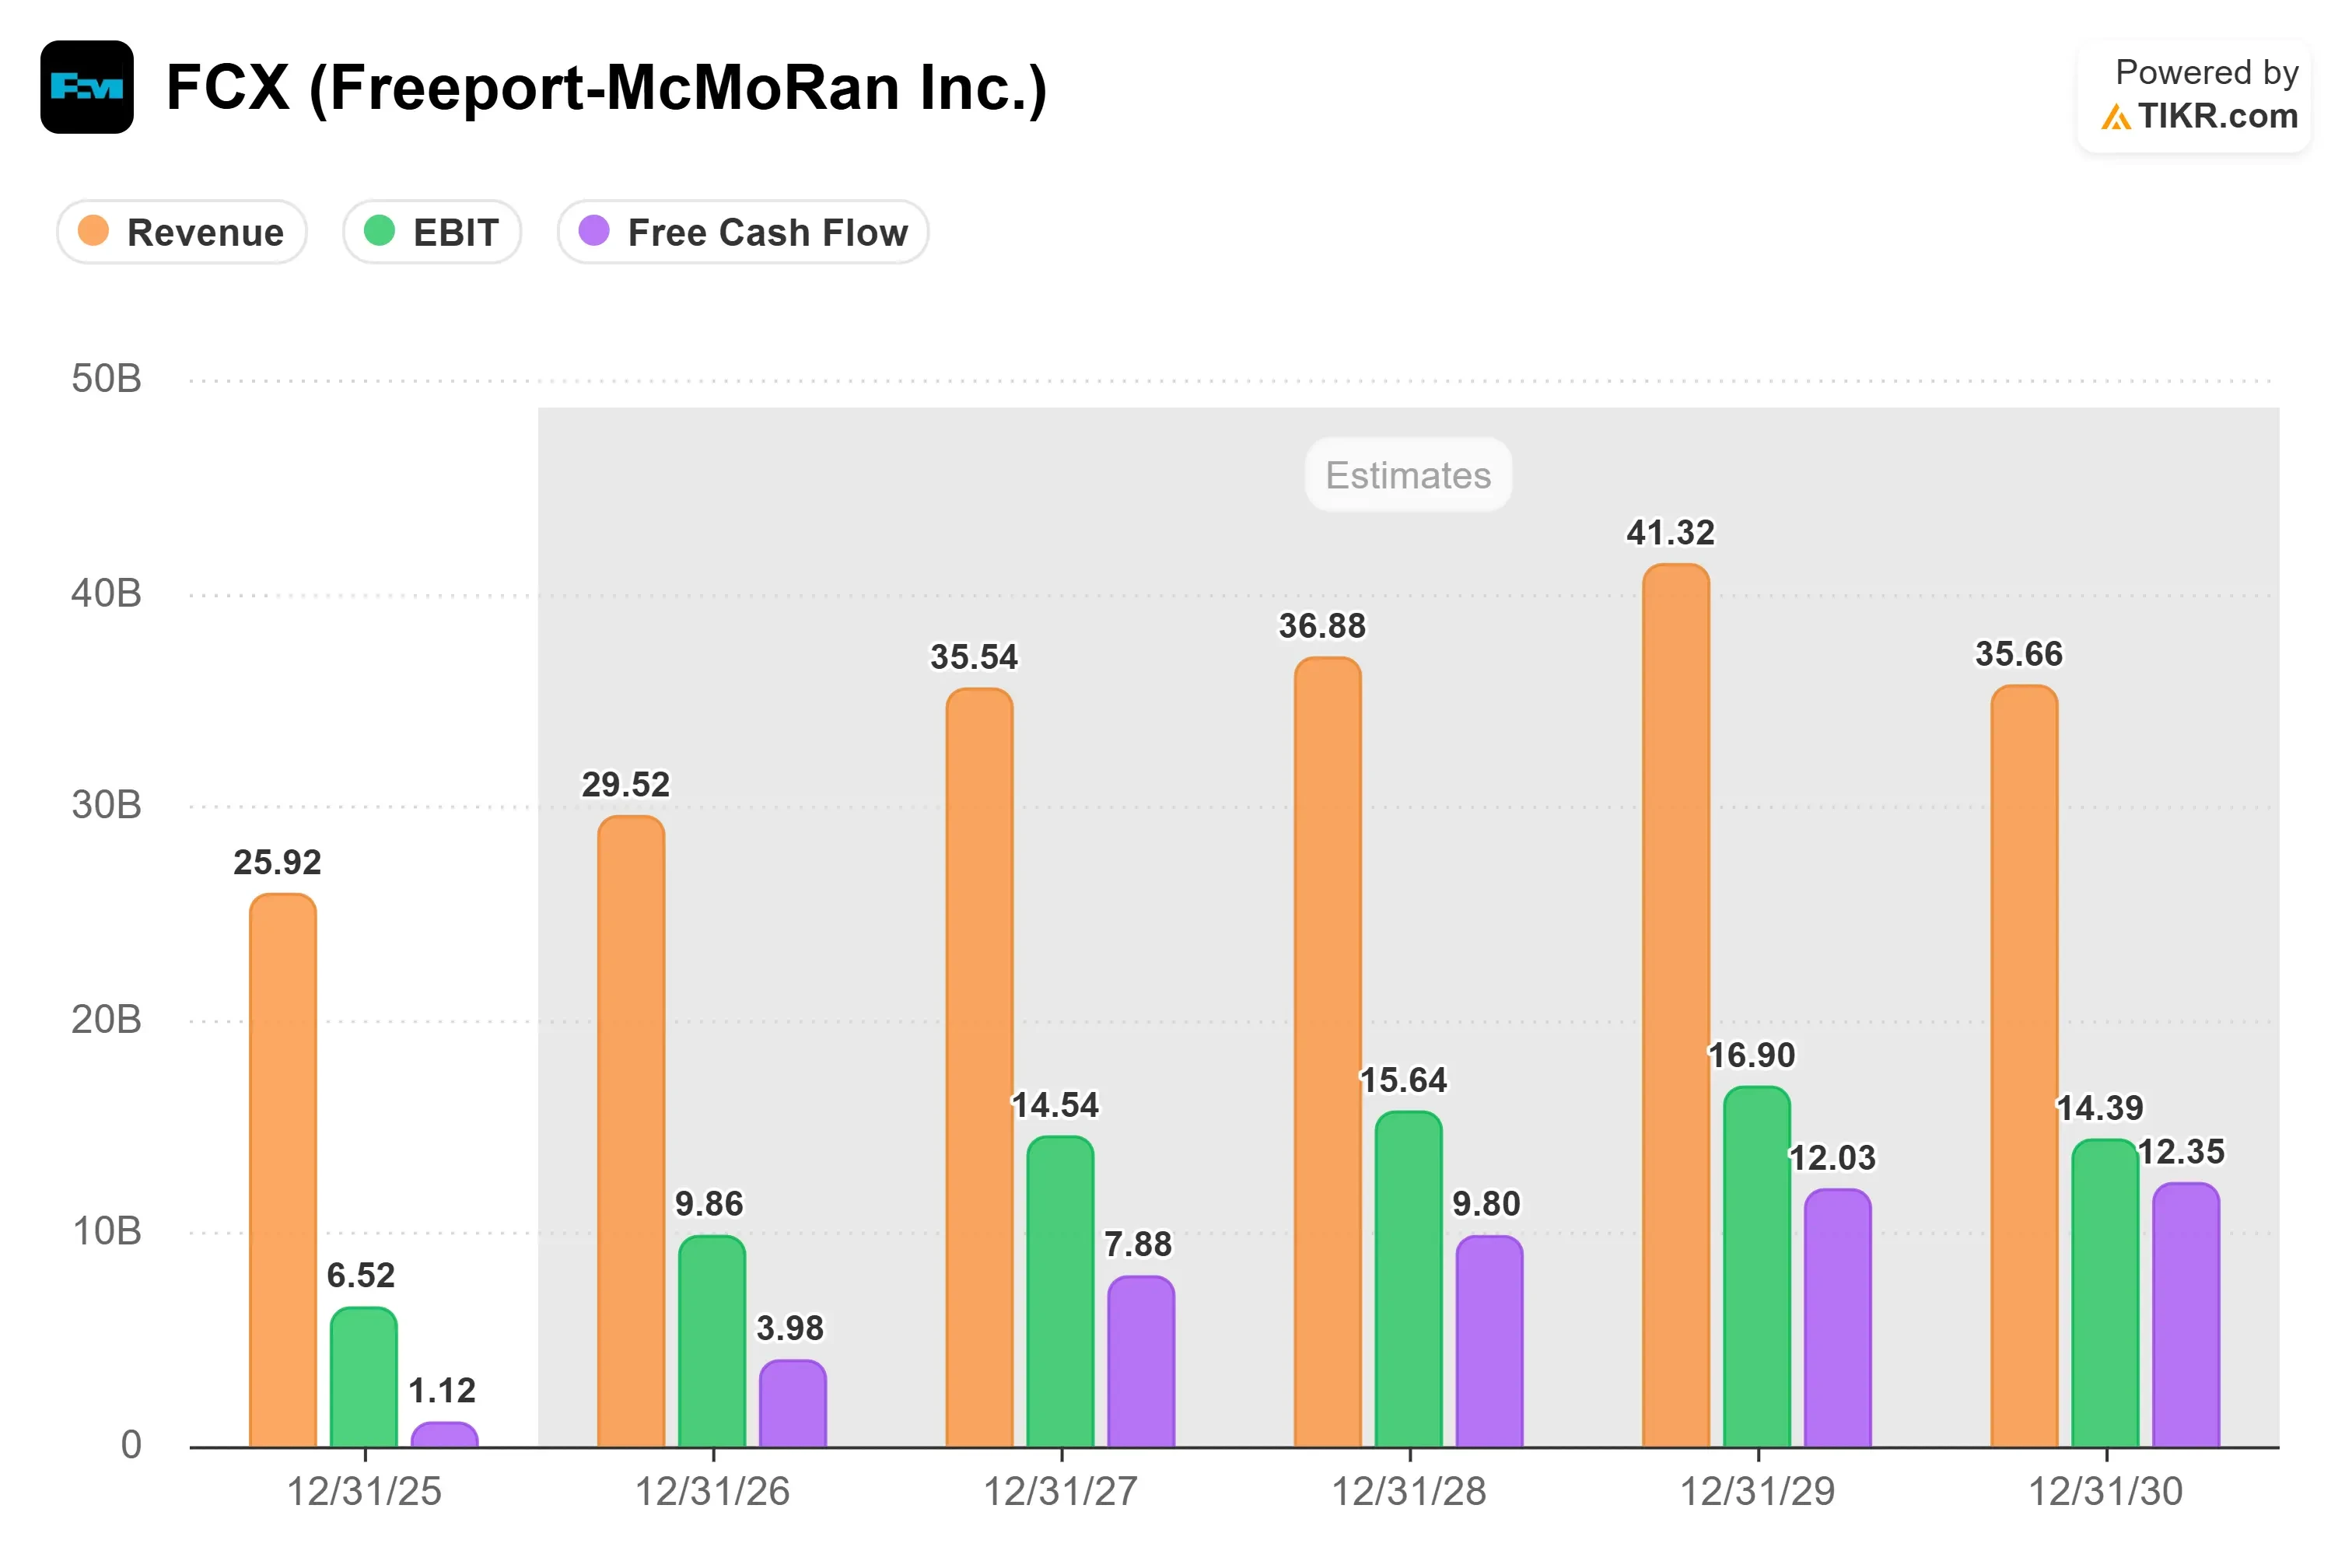
Wall Street has taken notice of the momentum.
Several major banks raised their price targets on Freeport-McMoRan stock to the $70 to $78 range, and the broader analyst consensus is Overweight, with an average target around $73 to $74.
See analysts’ growth forecasts and price targets for Freeport-McMoRan stock (It’s free) >>>
What the Market Is Telling Us About Freeport-McMoRan Stock
Today’s 8% gain in Freeport-McMoRan stock reflects genuine confidence in both the quarter’s results declared some time back and the company’s forward guidance.
A clean earnings beat, paired with rising volume targets and a fully funded growth plan, gives investors a lot to like without much financial engineering involved.
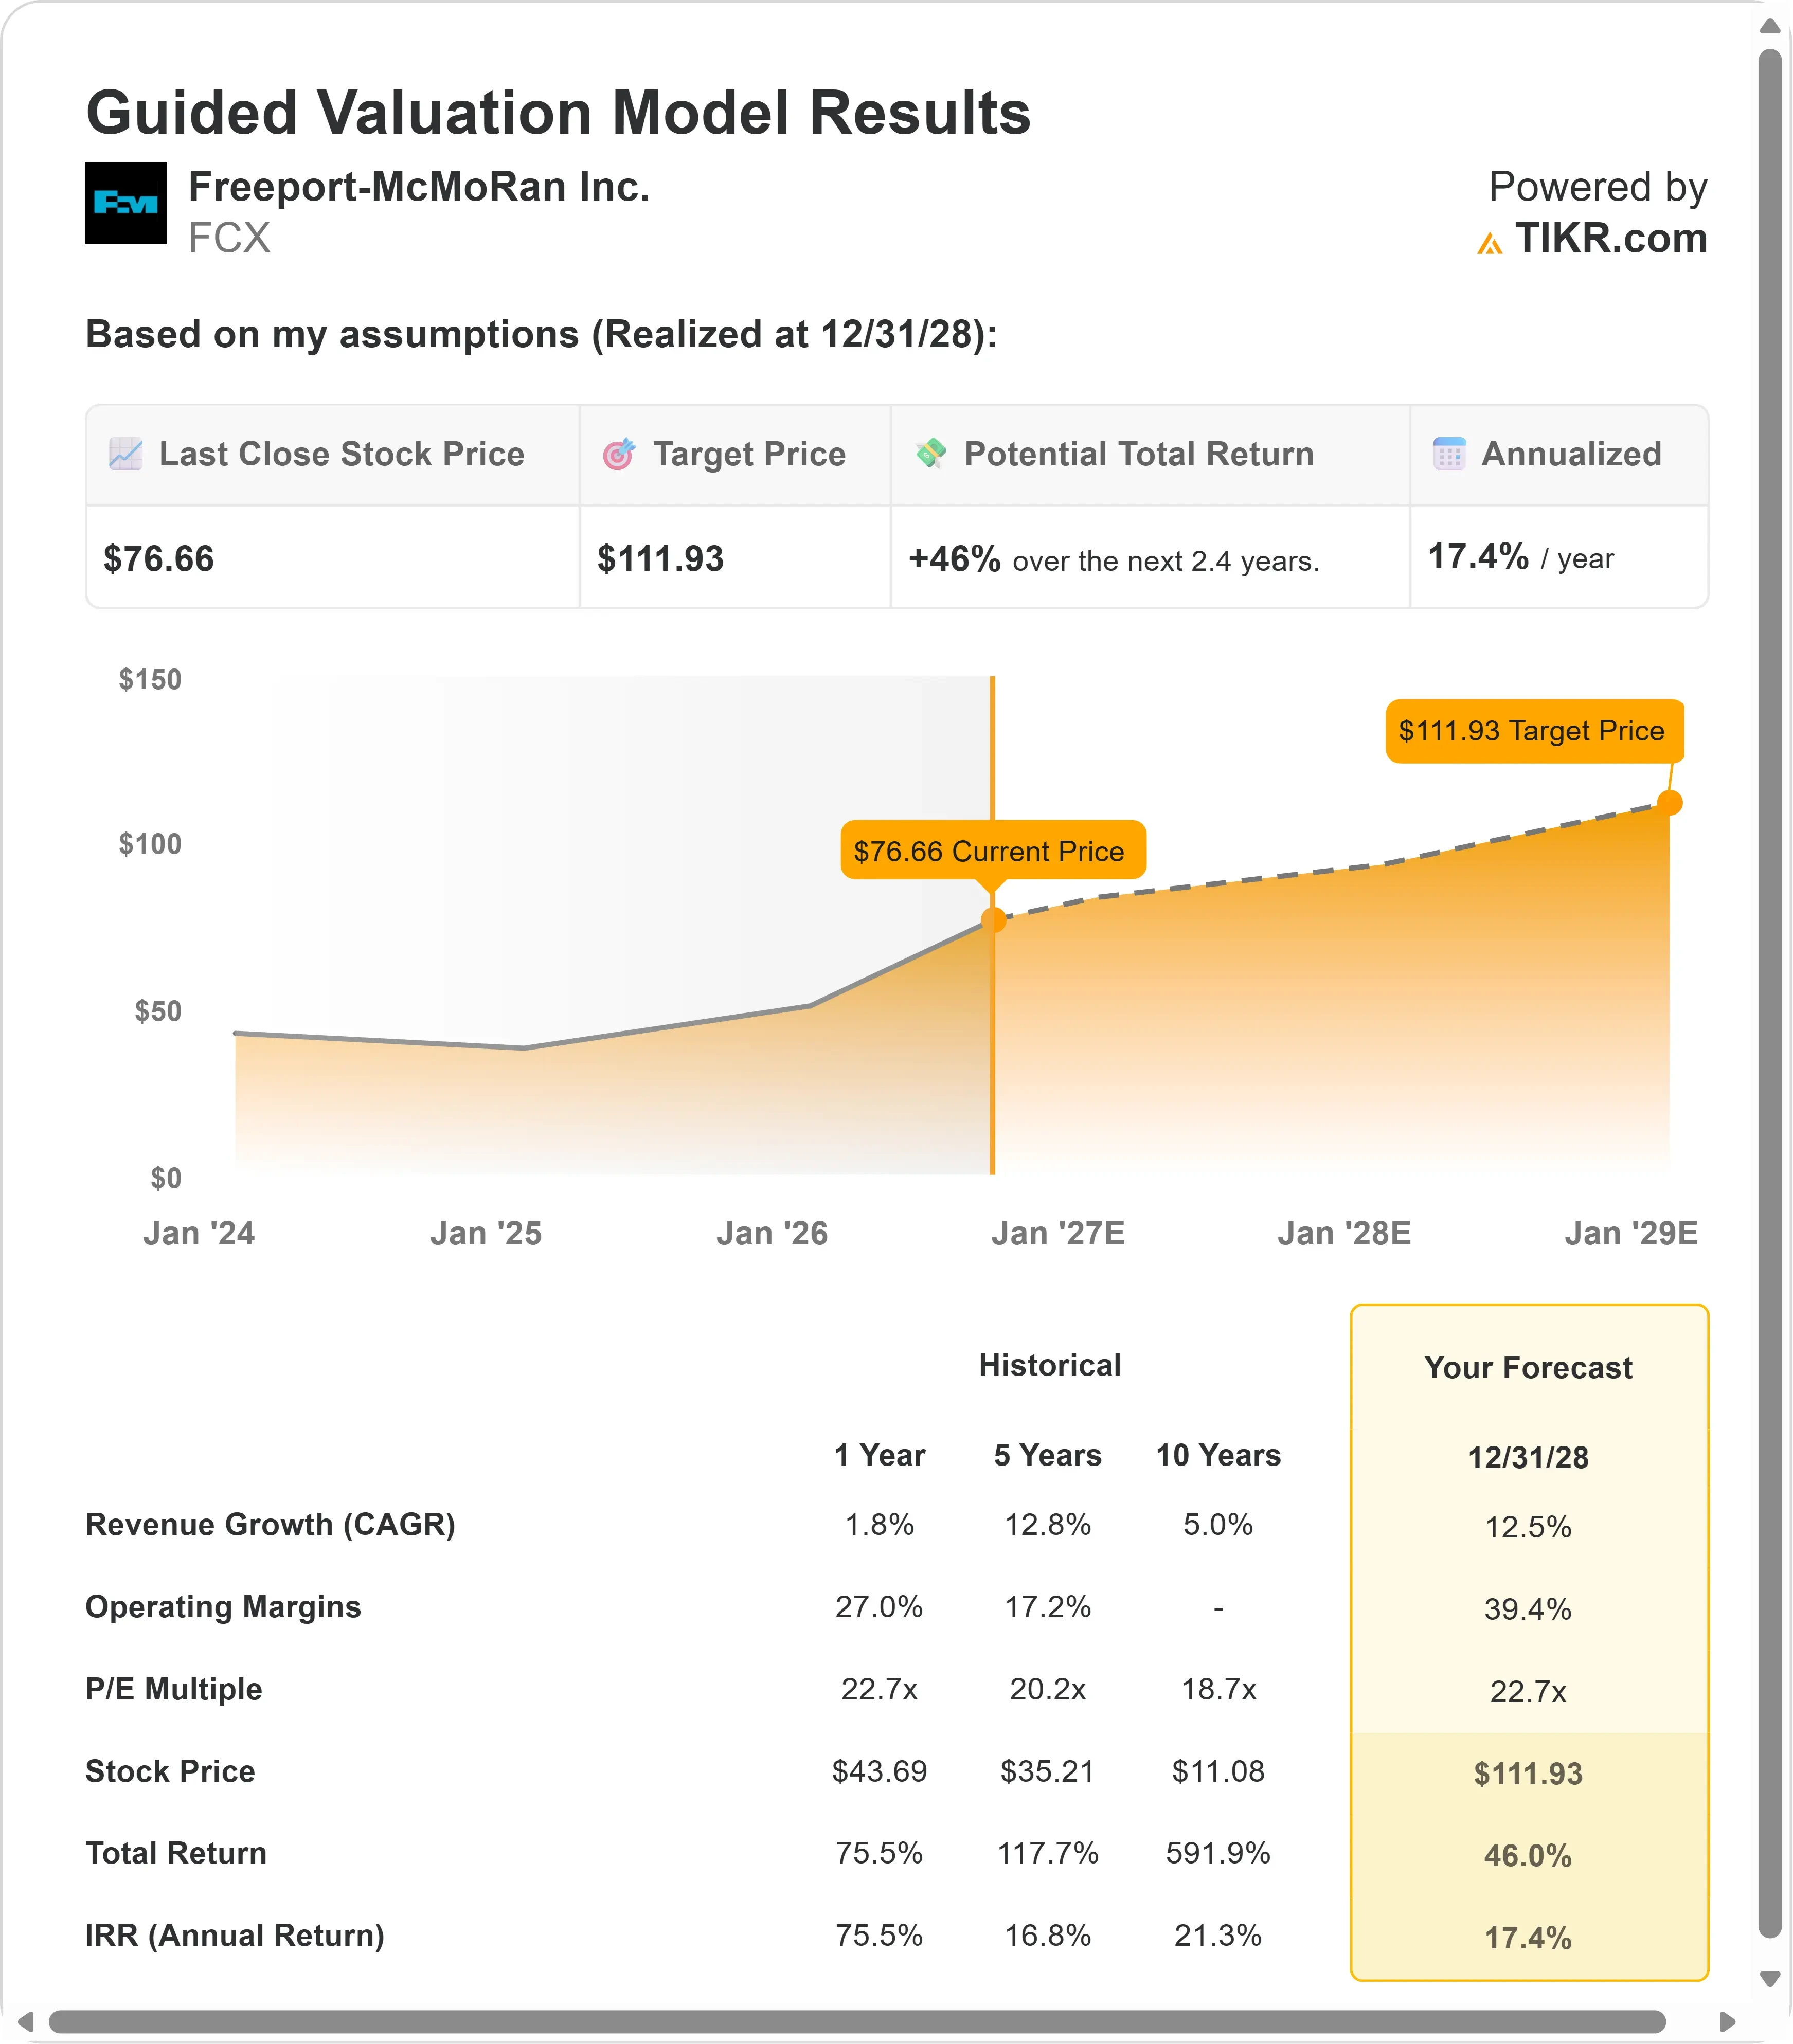
The stock’s steady climb from the low $60s to current levels, rather than a single sharp spike, suggests this rally has been building on sustained buying interest rather than short-term speculation.
With analyst price targets clustered well above where Freeport-McMoRan stock currently trades, the market appears to be pricing in continued execution on the Grasberg ramp-up and the company’s broader copper growth pipeline.
As always, investors will want to watch whether production and cash flow keep pace with these elevated expectations in the quarters ahead.
Estimate a company’s fair value instantly (Free with TIKR) >>>
How Much Upside Does Freeport-McMoRan Stock Have From Here?
With TIKR’s new Valuation Model tool, you can estimate a stock’s potential share price in under a minute.
All it takes is three simple inputs:
- Revenue Growth
- Operating Margins
- Exit P/E Multiple
If you’re not sure what to enter, TIKR automatically fills in each input using analysts’ consensus estimates, giving you a quick, reliable starting point.
From there, TIKR calculates the potential share price and total returns under Bull, Base, and Bear scenarios so you can quickly see whether a stock looks undervalued or overvalued.
See a stock’s true value in under 60 seconds (Free with TIKR) >>>
Looking for New Opportunities?
- See what stocks billionaire investors are buying so you can follow the smart money.
- Analyze stocks in as little as 5 minutes with TIKR’s all-in-one, easy-to-use platform.
- The more rocks you overturn… the more opportunities you’ll uncover. Search 100K+ global stocks, global top investor holdings, and more with TIKR.
Disclaimer:
Please note that the articles on TIKR are not intended to serve as investment or financial advice from TIKR or our content team, nor are they recommendations to buy or sell any stocks. We create our content based on TIKR Terminal’s investment data and analysts’ estimates. Our analysis might not include recent company news or important updates. TIKR has no position in any stocks mentioned. Thank you for reading, and happy investing!