
Key Stats for Harmony Gold Stock
- Price change for Harmony Gold stock in last 1 month: 52%
- $HMY Stock Price as of Aug. 21: $24
- 52-Week High: $26
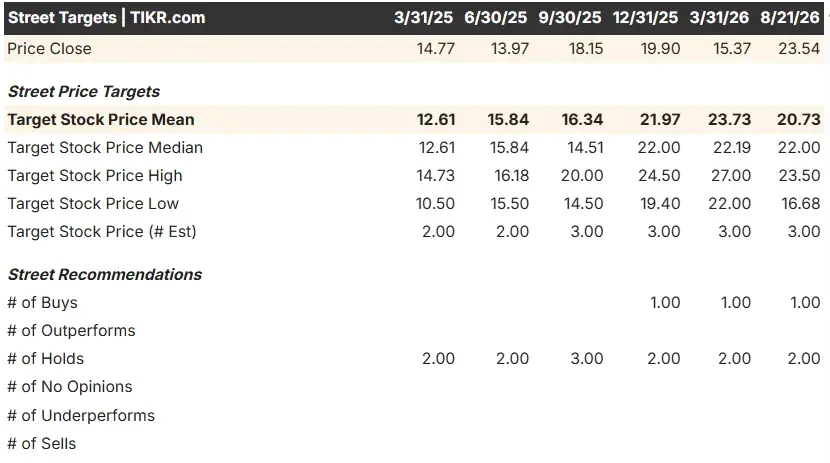
- $HMY Stock Price Target: $21
Now Live: Discover how much upside your favorite stocks could have using TIKR’s new Valuation Model (It’s free)>>>
What Happened?
Harmony Gold (HMY) stock climbed sharply after the company released a bullish trading statement and operational update for the full fiscal year.
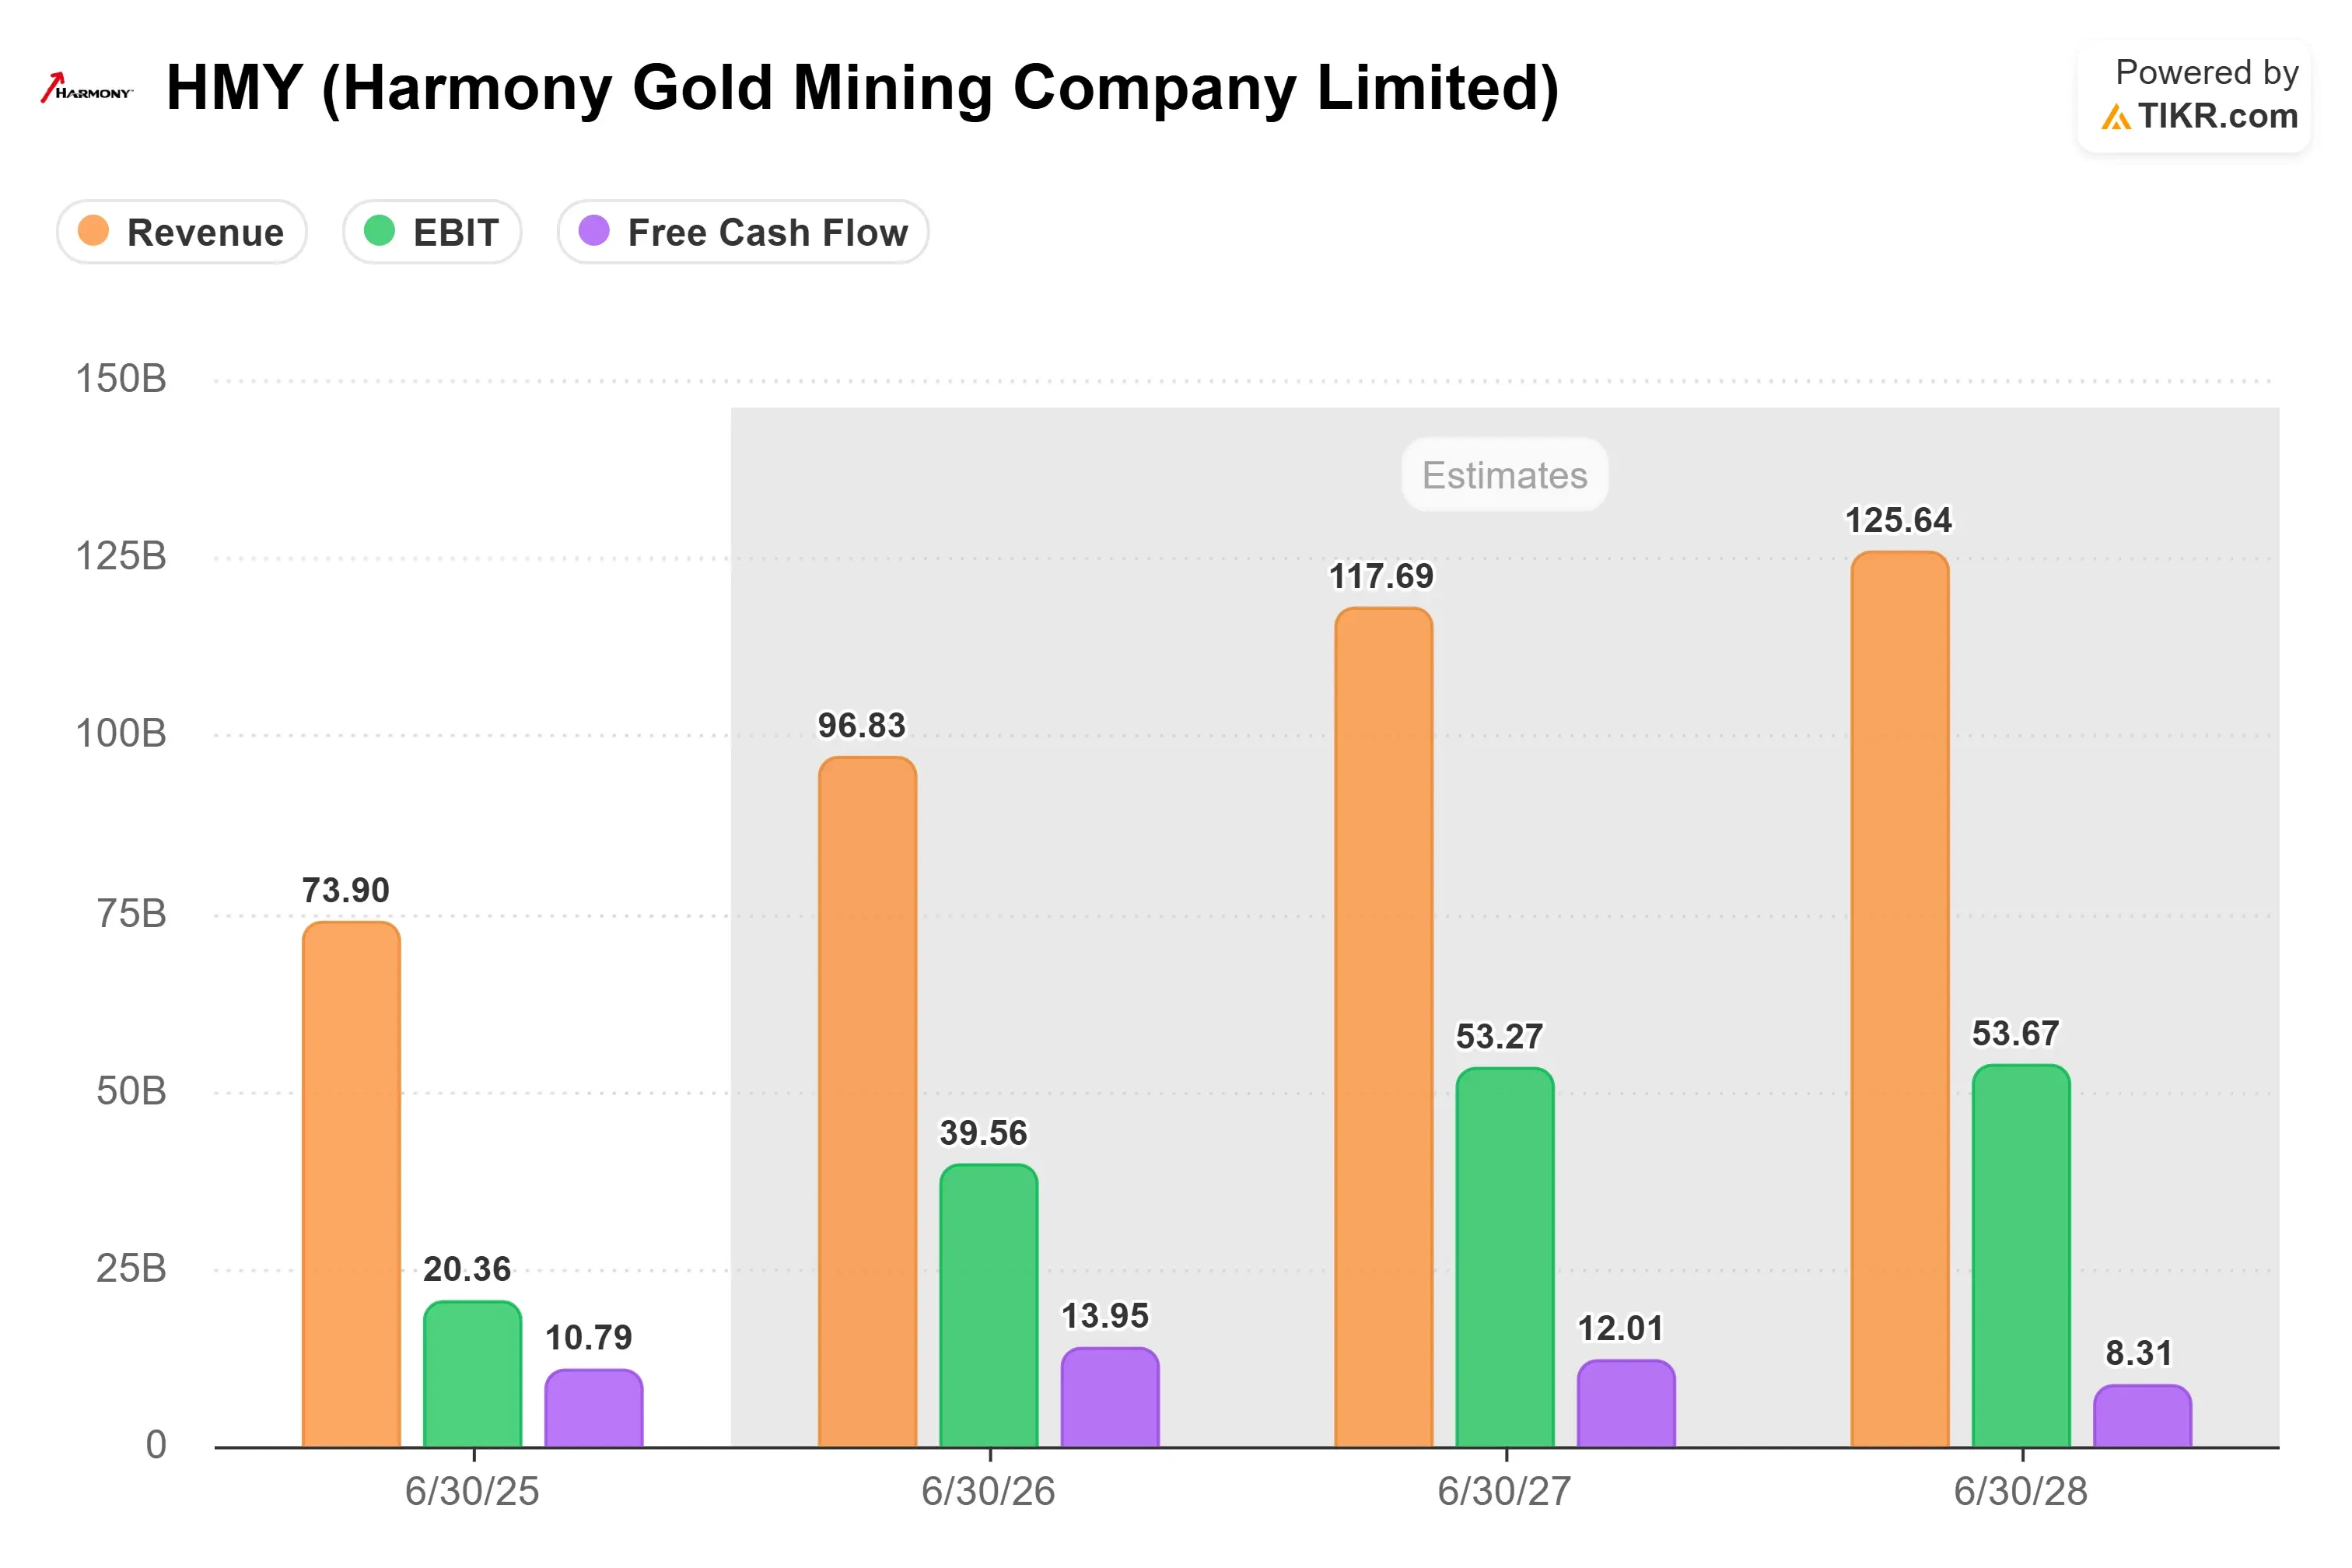
The headline news: full-year earnings per share are projected to more than double compared to last year. That’s a big jump, driven by two main factors: higher gold prices and new revenue from copper assets the company recently added to its portfolio.
But there’s more behind the surge than higher metal prices. Harmony also booked a multi-million dollar non-cash impairment reversal across several of its South African underground gold operations.
In plain terms, that means the company revalued some of its mines upward because it now assumes higher long-term gold prices, making those assets worth more on paper. That’s a meaningful signal about how the broader business is performing.
On the operational side, Harmony Gold stock got a boost from the company hitting its annual gold production targets for the eleventh year in a row. That’s a long streak, and it shows consistency that investors tend to reward.
All-in sustaining costs also came in within guidance, meaning the company kept a lid on expenses even as it integrated new assets.
Speaking of new assets, the copper side of the business is starting to pay off. Production from the recently acquired copper mine reached the upper end of guidance, an early sign that Harmony’s push to become a combined gold and copper producer is actually working, not just a strategy on paper.
It hasn’t all been smooth sailing.
The company’s August 21 update flagged some real cost pressures. South African mining royalty expenses rose by about R1.5 billion (roughly $95 million), and tax expenses jumped by about R2.3 billion (around $162 million), both driven by higher gold revenues pushing the company into higher tax and royalty brackets.
On top of that, Harmony absorbed roughly R1.4 billion (over $90 million) in acquisition and integration costs tied to the MAC Copper and CSA mine deals, along with rising labor and electricity costs.
The company also took losses on some silver hedging contracts, since spot prices climbed well above the rates it had locked in.
See analysts’ growth forecasts and price targets for Harmony Gold stock (It’s free) >>>
What the Market Is Telling Us About Harmony Gold Stock
The rally in Harmony Gold stock suggests investors are looking past the near-term cost pressures and focusing on the bigger picture, an earnings outlook that could more than double year over year.
That’s a hard number to ignore, even with rising taxes and integration costs eating into the margin.
That said, there are a few reasons to be cautious.
Technical indicators show the stock is now in overbought territory, with an RSI above 80, and some estimates suggest Harmony Gold stock is trading at a 16% to 20% premium above fair value.
Combined with an analyst consensus of Hold, this looks like a stock riding strong momentum into its full financial results on August 27, but one where some profit-taking wouldn’t be surprising if that report doesn’t fully live up to the trading update’s promise.
Estimate a company’s fair value instantly (Free with TIKR) >>>
How Much Upside Does Harmony Gold Stock Have From Here?
With TIKR’s new Valuation Model tool, you can estimate a stock’s potential share price in under a minute.
All it takes is three simple inputs:
- Revenue Growth
- Operating Margins
- Exit P/E Multiple
If you’re not sure what to enter, TIKR automatically fills in each input using analysts’ consensus estimates, giving you a quick, reliable starting point.
From there, TIKR calculates the potential share price and total returns under Bull, Base, and Bear scenarios so you can quickly see whether a stock looks undervalued or overvalued.
See a stock’s true value in under 60 seconds (Free with TIKR) >>>
Looking for New Opportunities?
- See what stocks billionaire investors are buying so you can follow the smart money.
- Analyze stocks in as little as 5 minutes with TIKR’s all-in-one, easy-to-use platform.
- The more rocks you overturn… the more opportunities you’ll uncover. Search 100K+ global stocks, global top investor holdings, and more with TIKR.
Disclaimer:
Please note that the articles on TIKR are not intended to serve as investment or financial advice from TIKR or our content team, nor are they recommendations to buy or sell any stocks. We create our content based on TIKR Terminal’s investment data and analysts’ estimates. Our analysis might not include recent company news or important updates. TIKR has no position in any stocks mentioned. Thank you for reading, and happy investing!