
Key Stats for Meta Stock
- This Week Performance: 3%
- 52-Week Range: $480 to $796
- Current Price: $656
What Happened to Meta Stock?
Meta Platforms (META) closed at $656 yesterday, and gained 3% this week as a $50 billion Nvidia chip deal, a landmark youth addiction trial featuring Zuckerberg’s live testimony, and fresh institutional buying from Pershing Square all landed within the same 72-hour window..
Nvidia (NVDA) announced a multiyear deal on February 17, 2026 to supply Meta with millions of AI chips, including current Blackwell processors and next-generation Rubin chips, alongside Grace and Vera central processors, with analysts estimating the deal’s value at roughly $50 billion.
The deal directly supports Meta’s aggressive infrastructure buildout, with the company guiding for $115 to $135 billion in 2026 capital expenditures as it races to scale its Meta Superintelligence Labs and expand gigawatt-scale data centers across the United States.
Investors increasingly view Meta not just as a social media advertising business but as a full-stack AI company, with its Q4 2025 results showing 24% revenue growth to $59.9 billion and a 41% operating margin even as infrastructure spending surged 40% year over year.
Susan Li, Chief Financial Officer, stated on the Q4 2025 earnings call that “this is the first time we have found a recommendation model architecture that can scale with similar efficiency as LLMs,” grounding the claim in GEM model results that drove a 3.5% lift in ad clicks on Facebook and over 1% gains in Instagram conversions.
Additionally, Valueact Holdings raised its Meta stake by 36.3% to 1.0 million Class A shares as of December 31, 2025, while Pershing Square Capital Management disclosed a new position, signaling growing institutional conviction in Meta’s AI-driven growth trajectory.
Broadly, Meta’s combination of record daily active users surpassing 3.5 billion, tripling smart glasses sales, and a multibillion-dollar Nvidia chip partnership positions the company as one of the central infrastructure and consumer AI players of the next technology cycle.
Where is the Meta Stock Headed?
The Nvidia chip deal, surging smart glasses sales, and Meta’s $115 to $135 billion infrastructure commitment collectively signal that the company is aggressively converting its AI ambitions into durable, compounding revenue streams well beyond its core advertising base.
Street estimates already reflect that conviction, with analysts projecting 2026 revenue of $251 billion, representing 25% year-over-year growth, while normalized EPS climbs to $30.26 and net income margins hold near 30.7% despite the heaviest capital spending cycle in company history.
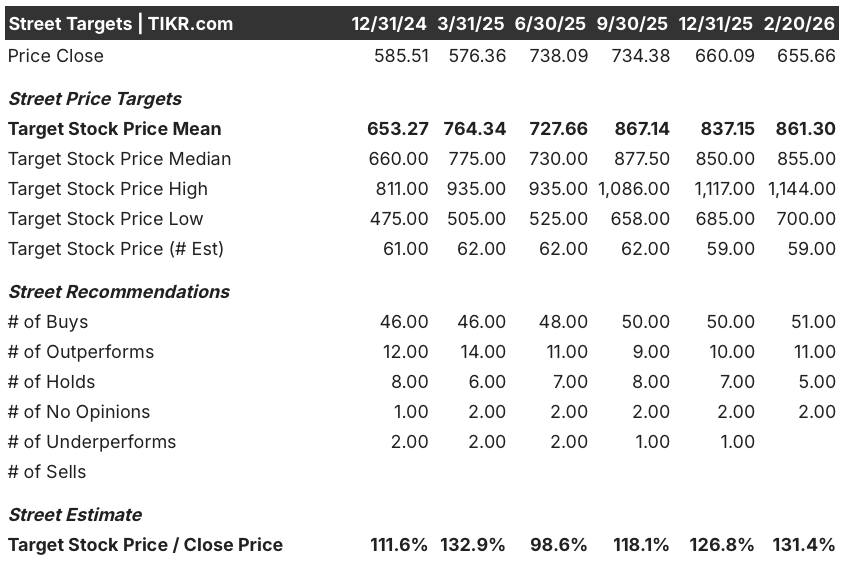
Wall Street stands firmly behind the stock, with 51 analysts rating it a Buy and 11 rating it Outperform as of February 20, 2026, against a consensus mean price target of $861.30, implying roughly 31% upside from the current close of $655.66.
The target range stretches from a low of $700 to a high of $1,144, reflecting meaningful disagreement on how aggressively Meta’s AI infrastructure spending will translate into new revenue streams beyond advertising.

Supported by the Nvidia deal, MSL buildout, and accelerating ad performance gains, a mid-case valuation model prices Meta at $1,296.59 by December 2030, implying a potential total return of 97.8% and an annualized IRR of 15.1% from current levels.
The clearest risk is multiple compression, as the stock’s P/E is projected to contract at a negative 0.8% CAGR in the mid case through 2031, meaning earnings growth must do the heavy lifting even as regulatory headwinds in the EU and ongoing U.S. youth addiction trials create material legal overhang.
At $655.66, Meta trades at a meaningful discount to both analyst consensus and the mid-case intrinsic value, making the stock look undervalued for investors willing to hold through the peak infrastructure spend cycle.
Value Any Stock in Under 60 Seconds (It’s Free)
With TIKR’s new Valuation Model tool, you can estimate a stock’s potential share price in under a minute.
All it takes is three simple inputs:
- Revenue Growth
- Operating Margins
- Exit P/E Multiple
From there, TIKR calculates the potential share price and total returns under Bull, Base, and Bear scenarios so you can quickly see whether a stock looks undervalued or overvalued.
If you’re not sure what to enter, TIKR automatically fills in each input using analysts’ consensus estimates, giving you a quick, reliable starting point.