Key Stats for Martin Marietta Stock
- Past-Week Performance: -2%
- 52-Week Range: $442 to $711
- Current Price: $675
What Happened to Martin Marietta Stock?
Martin Marietta Materials (MLM) fell roughly 4% in premarket trading on February 12, touching the $680 level after the company reported its Q4 and full-year 2025 earnings the prior evening.
The company posted Q4 revenue of $1.534 billion, missing the IBES consensus estimate of $1.570 billion, and issued full-year 2026 revenue guidance of $6.42 billion to $6.78 billion, falling short of the analyst estimate of $6.86 billion.
Higher costs tied to fuel, energy, raw materials, equipment, and acquisition-related charges weighed on Q4 net income, which declined to $279 million from $294 million a year earlier, despite a 9% revenue increase and record aggregates gross profit per ton of $8.59.
Markets recalibrated expectations around the stock, which had gained 20.6% in 2025 and traded near its 52-week high of $711, as the below-consensus guidance signaled that cost pressures and weakness in private nonresidential and residential construction would continue to drag on near-term profitability.
Ward Nye, Chair, President and Chief Executive Officer, stated on the Q4 2025 earnings call that “accelerating momentum in data centers and energy to offset continued softness in private nonresidential and residential construction,” grounding confidence in the 2026 outlook against a backdrop of data center shipment growth running at roughly 60% and infrastructure budgets in top Martin Marietta states rising approximately 7%.
The broader story remains constructive over the medium term, as IIJA reimbursements are expected to peak in 2026 with roughly 50% of funds still to be disbursed, and the company enters its SOAR 2030 cycle with $1.2 billion in liquidity and a network optimization initiative that management expects to yield meaningful cost reductions across the full quarry portfolio by midyear.
Where is the MLM Headed?
Despite the post-earnings selloff pushing MLM toward the $675 level, the near-term guidance miss obscures a company that grew aggregates gross profit per ton by 12% in 2025 and is entering its SOAR 2030 cycle with record free cash flow and a leaner cost structure.
Consensus estimates project revenue recovering to $6.81 billion in fiscal 2026, representing 10.8% growth, while normalized EPS climbs to $20.5, a 9% increase, and EBITDA margins expand to 35.3% from 33.6% in 2025.
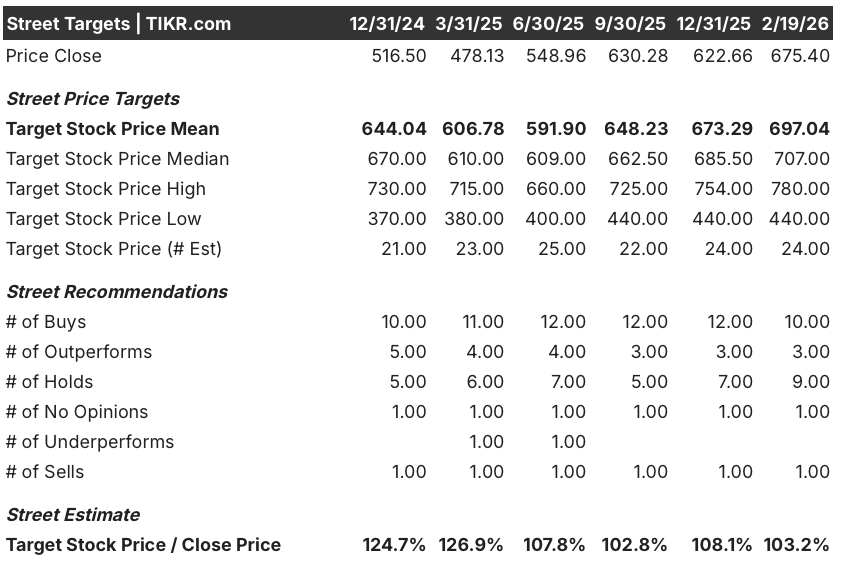
Wall Street’s mean price target sits at $697 across 24 estimates, with 13 Buy or Strong Buy ratings versus 9 Holds and 1 Sell, implying roughly 3.2% upside from the February 19 close of $675.4.
The target range spans $440 on the low end to $780 on the high end, reflecting genuine disagreement about how quickly private construction recovers and whether the Quikrete asset exchange closes cleanly and accretively.

Against a backdrop of peaking IIJA disbursements, accelerating data center demand growing at 60% annually, and a network optimization program still in early innings, a mid-case valuation model prices MLM at $897.57 by December 2030, implying a total return of 32.9% and an annualized IRR of 6.02%.
The primary risk is multiple compression, as MLM stock currently trades at 33x forward earnings versus 29x just three months ago, leaving the stock vulnerable to further de-rating if 2026 volume growth disappoints or residential construction fails to recover on the expected timeline.
At current levels, Martin Marietta stock looks fairly valued in the near term but offers a compelling entry point for patient investors willing to look through the guidance miss toward a multi-year infrastructure and data center spending cycle that plays directly into the company’s core aggregates franchise.
Value Any Stock in Under 60 Seconds (It’s Free)
With TIKR’s new Valuation Model tool, you can estimate a stock’s potential share price in under a minute.
All it takes is three simple inputs:
- Revenue Growth
- Operating Margins
- Exit P/E Multiple
From there, TIKR calculates the potential share price and total returns under Bull, Base, and Bear scenarios so you can quickly see whether a stock looks undervalued or overvalued.
If you’re not sure what to enter, TIKR automatically fills in each input using analysts’ consensus estimates, giving you a quick, reliable starting point.