


Key Fundamental Metrics for MCO
- 52-Week Range: $402.28 to $546.88
- Current Stock Price: $449.12
- Consensus Street Target: $536.00
- LTM Gross Profit Margin: 74.4%
- LTM Operating Margin: 44.9%
- LTM Return on Invested Capital: 32.6%
Value your favorite stocks like CMG with 5 years of analysts’ forecasts using TIKR’s new Valuation Model (It’s free) >>>
Monetizing Global Issuance Under a Regulated Toll Road Structure
Moody’s Corporation (MCO) has experienced a near-term valuation consolidation, displaying a minor negative 4.8% price return over the past year to settle at $449.12. General market anxiety frequently cycles around corporate debt refinancing timelines, interest rate volatility, and transaction fluctuations inside the core ratings segment.
However, this cyclical focus ignores the structural operational leverage inherent to Moody’s dual-engine model, which pairs transactional transaction fees with sticky analytic subscriptions.

The historical trend line highlights the immense profit scaling that triggers when issuance volumes rebound. Total revenues moved from $6.22 billion in 2021 through a corporate issuance trough of $5.47 billion in 2022, before climbing sequentially to reach a record $7.72 billion in late 2025.
This top-line expansion drove absolute operating margins up from a cyclical low of 36.65% in 2022 to an elite 44.9% by the end of 2025. Because the marginal cost of assigning a credit rating to a new bond is virtually negligible once the core analytical infrastructure is built, incremental top-line growth flows directly into corporate operating profits.
See historical and forward estimates for CMG stock (It’s free!) >>>
Capital-Light Financial Architecture Generates Pure Free Cash Flow Conversion
The core economic advantage of the Moody’s framework rests on its minimal capital-reinvestment requirements. As a provider of credit opinions, data analytics, and risk management software, the company requires no major manufacturing outlays, heavy shipping machinery, or complex physical infrastructure networks to scale.
This capital-light layout creates an exceptional divergence between revenue growth and internal capital maintenance.
The real-world extraction capabilities of this model are clearly visible when comparing reported accounting earnings directly against cash metrics. In late 2025, Moody’s generated a substantial $2.58 billion in annual free cash flow, tracking nearly identical to its $2.46 billion in reported accounting net income.

This high cash-conversion velocity allows management to fund a balanced capital return strategy without taking on structural balance sheet strain. Consequently, Moody’s easily maintains a clean balance sheet with a safe 1.50x net debt-to-EBITDA leverage profile off an optimized 174.68 million basic share count.
See what analysts think about CMG stock right now (Free with TIKR) >>>
Evaluating the Duopoly Premium of a Legally Embedded Moat
Because Moody’s operates within a government-sanctioned credit rating duopoly alongside S&P Global, it commands structural valuation multiples that often appear elevated to standard equity screens. The stock trades at an LTM Price-to-Earnings ratio of 32.23x and an NTM Price-to-Earnings multiple of 26.26x.
These premium parameters are fully supported by an extraordinary corporate efficiency profile, featuring a 74.4% LTM gross margin and a stellar 32.6% LTM return on invested capital.
This economic moat is legally protected by global regulatory frameworks that mandate institutional bond funds to hold debt rated by recognized credit rating organizations. Every time a corporation, municipality, or sovereign state issues new debt to fund operations, it must pay Moody’s an essential toll to access international capital markets.
By combining this non-discretionary transaction engine with a high-retention enterprise software model in the analytics division, the business maintains pricing power throughout changing macroeconomic cycles.
Unlocking Value: What the TIKR Forecast Breakdown Implies
Transitioning to long-term forward expectations, the automated valuation model highlights an incredibly secure compounding foundation for equity allocators over the next decade. Reviewing the historical 10-year total return of 360.4% demonstrates how effectively this duopoly layout captures structural global credit expansion.
Under the mid-case forecasting assumptions, organic revenue growth is modeled to compound at a steady annual rate of 6.7%, assuming net income margins structurally normalize at 36.7%.
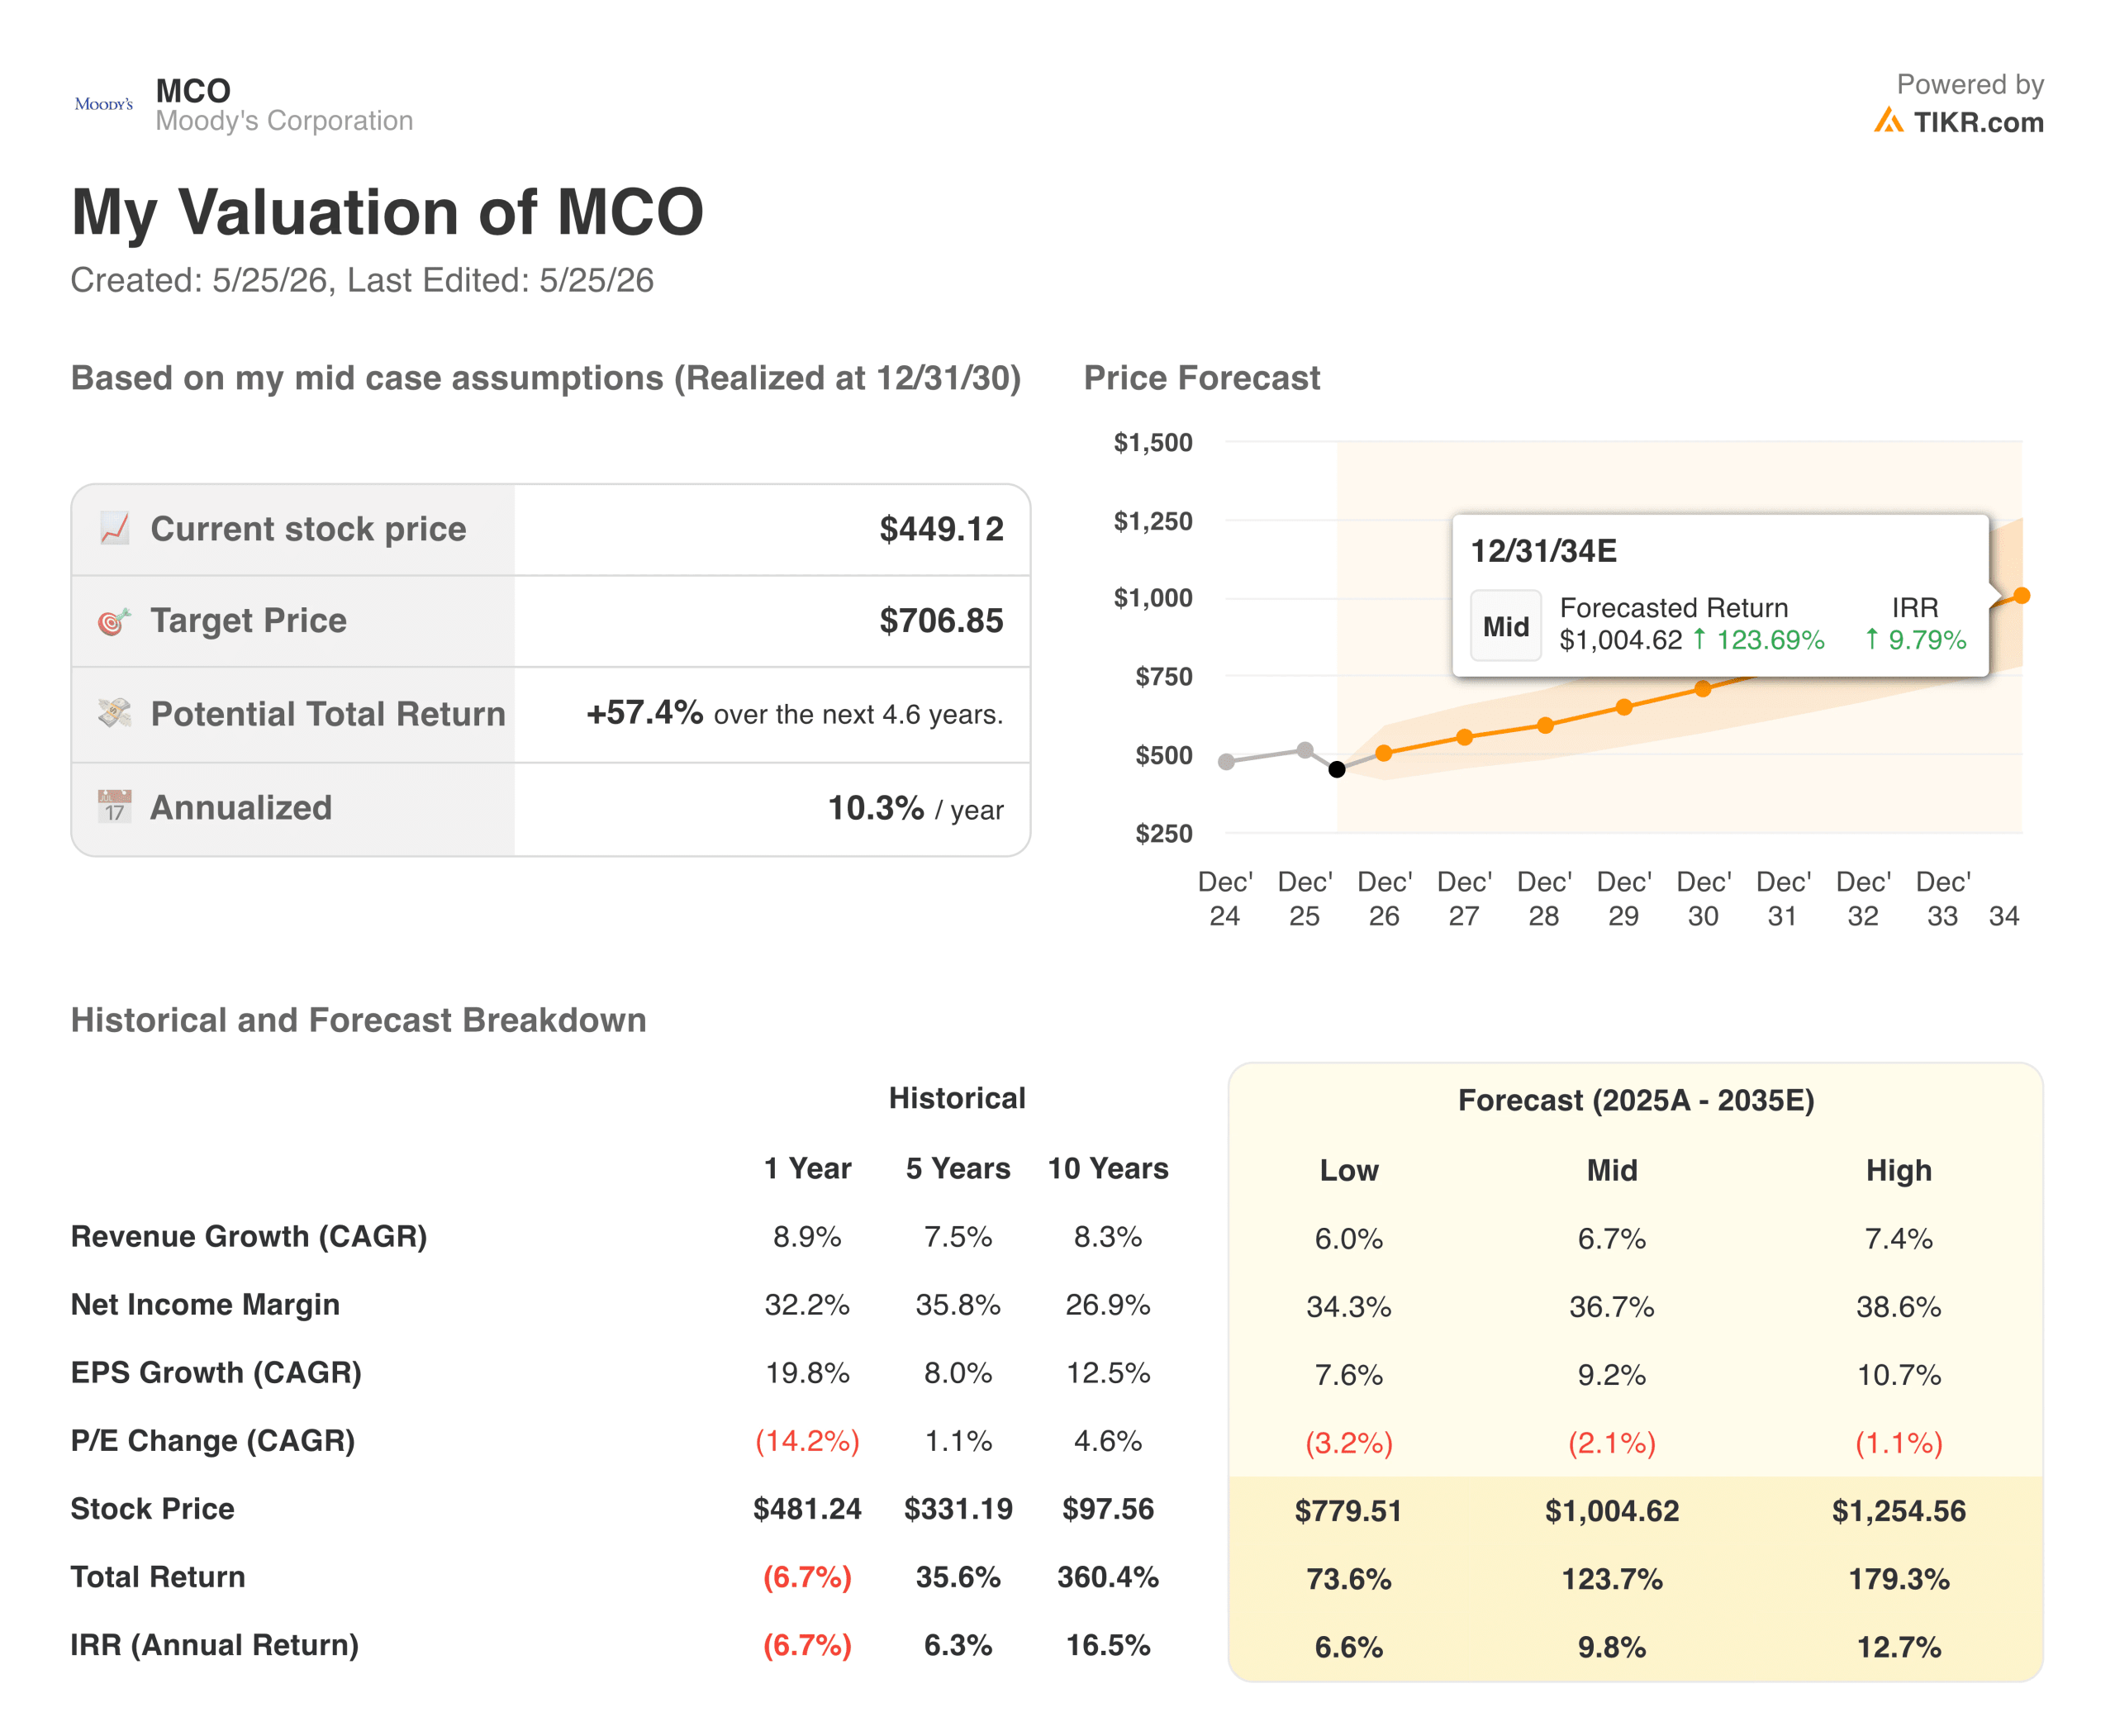
These baseline inputs create a resilient, tightly bound spectrum of forward equity returns. The forecast framework proves that even if corporate debt issuance slows down to a conservative low-case revenue growth footprint of 6.0%, the structural cash conversion metrics establish a secure $779.51 stock price floor by 2034.
By protecting real operating margins from competitive pricing disruptions, the core model projects a mid-case terminal stock price target of $1,004.62 by late 2034.
Is MCO Worth Buying at $449.12?
At the current price of $449.12, the TIKR forward valuation model establishes an exceptionally favorable entry point for long-term equity allocators.
Under the mid-case scenario, achieving a fair value target price of $706.85 by December 2030 generates a highly attractive 10.3% annualized internal rate of return over the next 4.6 years, compounding into a 9.8% annual return through the full 10-year horizon. This baseline scenario relies on a highly achievable 9.2% compound annual growth rate for EPS.
Importantly, the conservative low-case adjustments show immense fundamental protection, projecting an annualized return of 6.6% over the model horizon even under pessimistic debt issuance parameters. This narrow downside variance underscores a massive fundamental margin of safety, requiring zero multiple expansion to achieve meaningful equity compounding.
For risk-conscious investors seeking to own an elite global toll road asset backed by a sustainable 1.0% dividend yield, initiating a core position at today’s price is a phenomenal defensive capital allocation move.
See analysts’ growth forecasts and price targets for CMG stock (It’s free!) >>>
Looking for New Opportunities?
- See what stocks billionaire investors are buying so you can follow the smart money.
- Analyze stocks in as little as 5 minutes with TIKR’s all-in-one, easy-to-use platform.
- The more rocks you overturn… the more opportunities you’ll uncover. Search 100K+ global stocks, global top investor holdings, and more with TIKR.
Disclaimer:
Please note that the articles on TIKR are not intended to serve as investment or financial advice from TIKR or our content team, nor are they recommendations to buy or sell any stocks. We create our content based on TIKR Terminal’s investment data and analysts’ estimates. Our analysis might not include recent company news or important updates. TIKR has no position in any stocks mentioned. Thank you for reading, and happy investing!


