Key Stats for LULU Stock
- Past week’s performance: 4%
- 52-week range: $104 to $226
- Valuation model target price: $146
- Implied upside: 13.7% over 2.5 years
See how Lululemon’s turnaround assumptions shape its own price target with TIKR’s Guided Valuation Model (It’s free) >>>
A Brand in Transition: Lululemon’s North America Problem
Lululemon (LULU) remains in turnaround mode as its core North American business continues to struggle. Shares fell after Truist downgraded the stock to Sell, citing continued weakness in the company’s largest market and structural competition from newer athletic brands. The move added to a year where Lululemon’s stock has already dropped sharply, even as international markets kept growing.
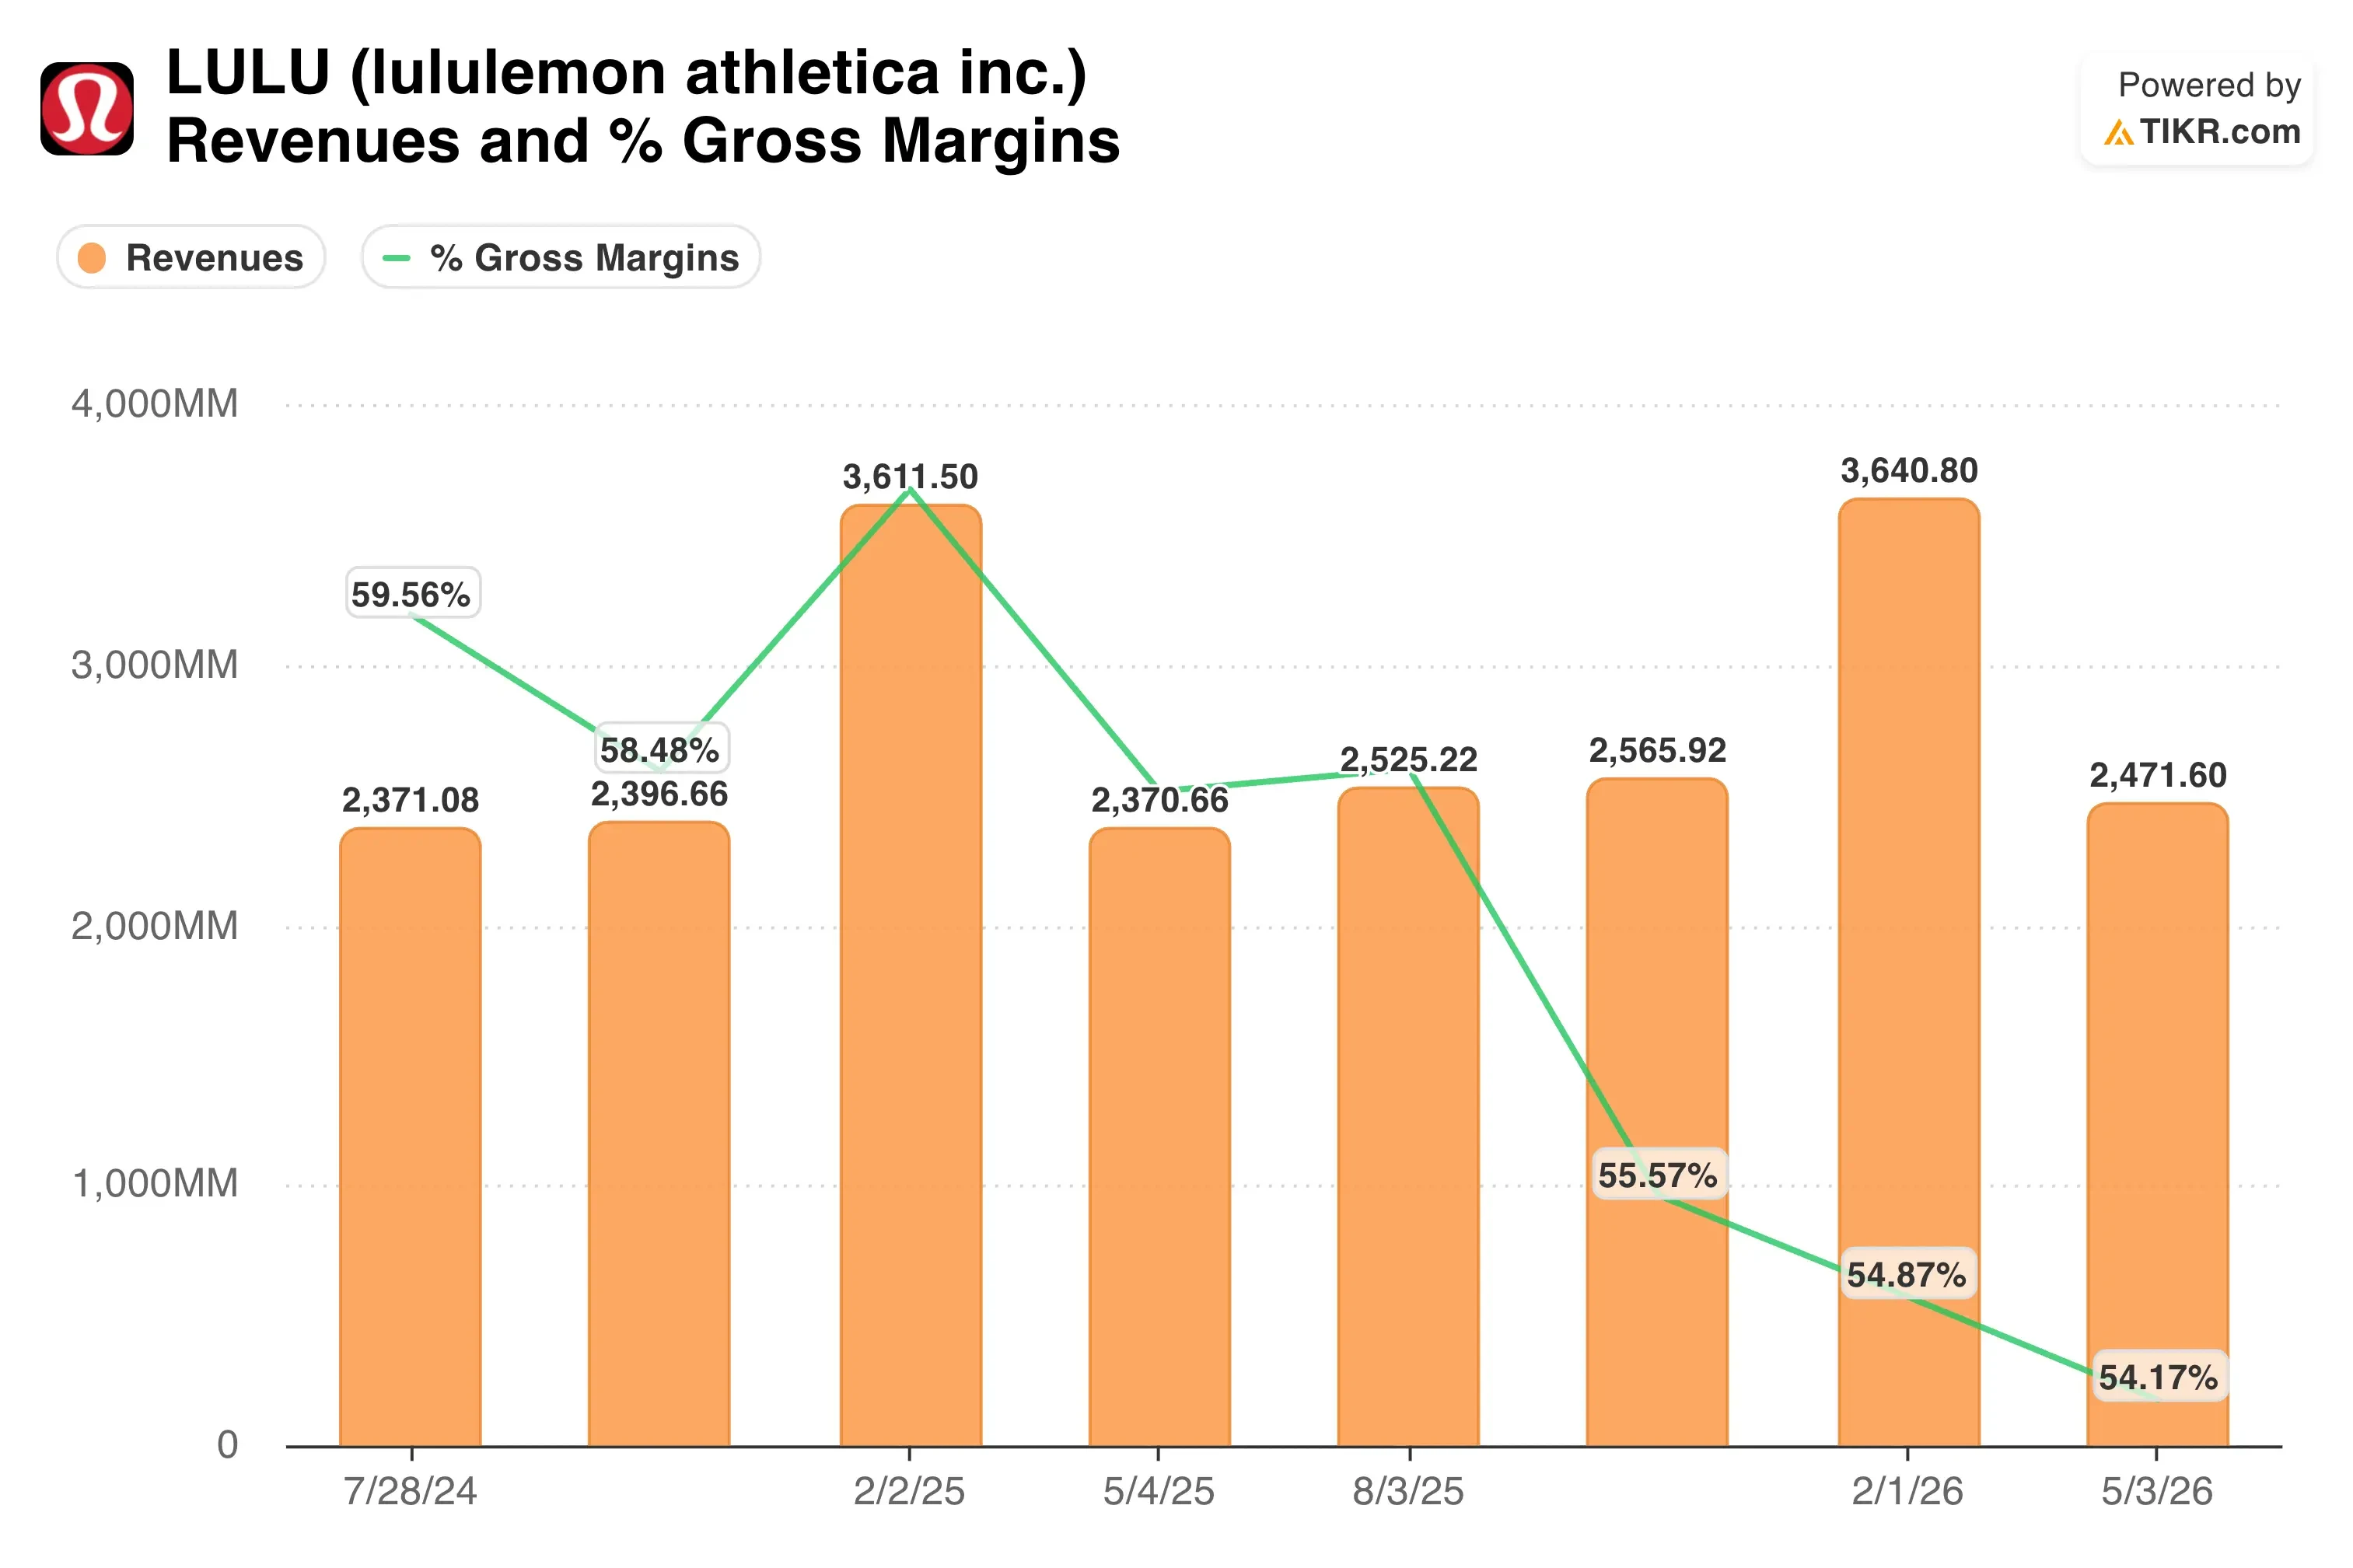
The company’s first-quarter results explain the concern. Total revenue rose 4% to $2.5 billion, while North American comparable sales fell 6% and Americas revenue declined 3%. Gross margin fell over four percentage points as tariffs and heavier discounting pressured profitability. Lululemon cut full-year guidance for the second time this year.
International growth remains the bright spot. China Mainland revenue climbed 30% during the quarter, though a shift in the Chinese New Year calendar boosted that figure. Outside North America, the company continues expanding, including a franchise-led Athens launch, even as its home market contracts.
Chief Financial Officer Meghan Frank, serving as interim co-CEO, said the company is “moving with urgency” to fix its North American trends. She attributed part of the slowdown to negative media commentary and product launches that missed expectations.
Incoming CEO Heidi O’Neill, a former Nike executive, will now be tasked with rebuilding product momentum. If LULU stock is to recover meaningfully, investors want proof that North American traffic stabilizes before the next holiday season.
See analysts’ growth forecasts and price targets for LULU (It’s free) >>>
Is LULU Stock Undervalued?
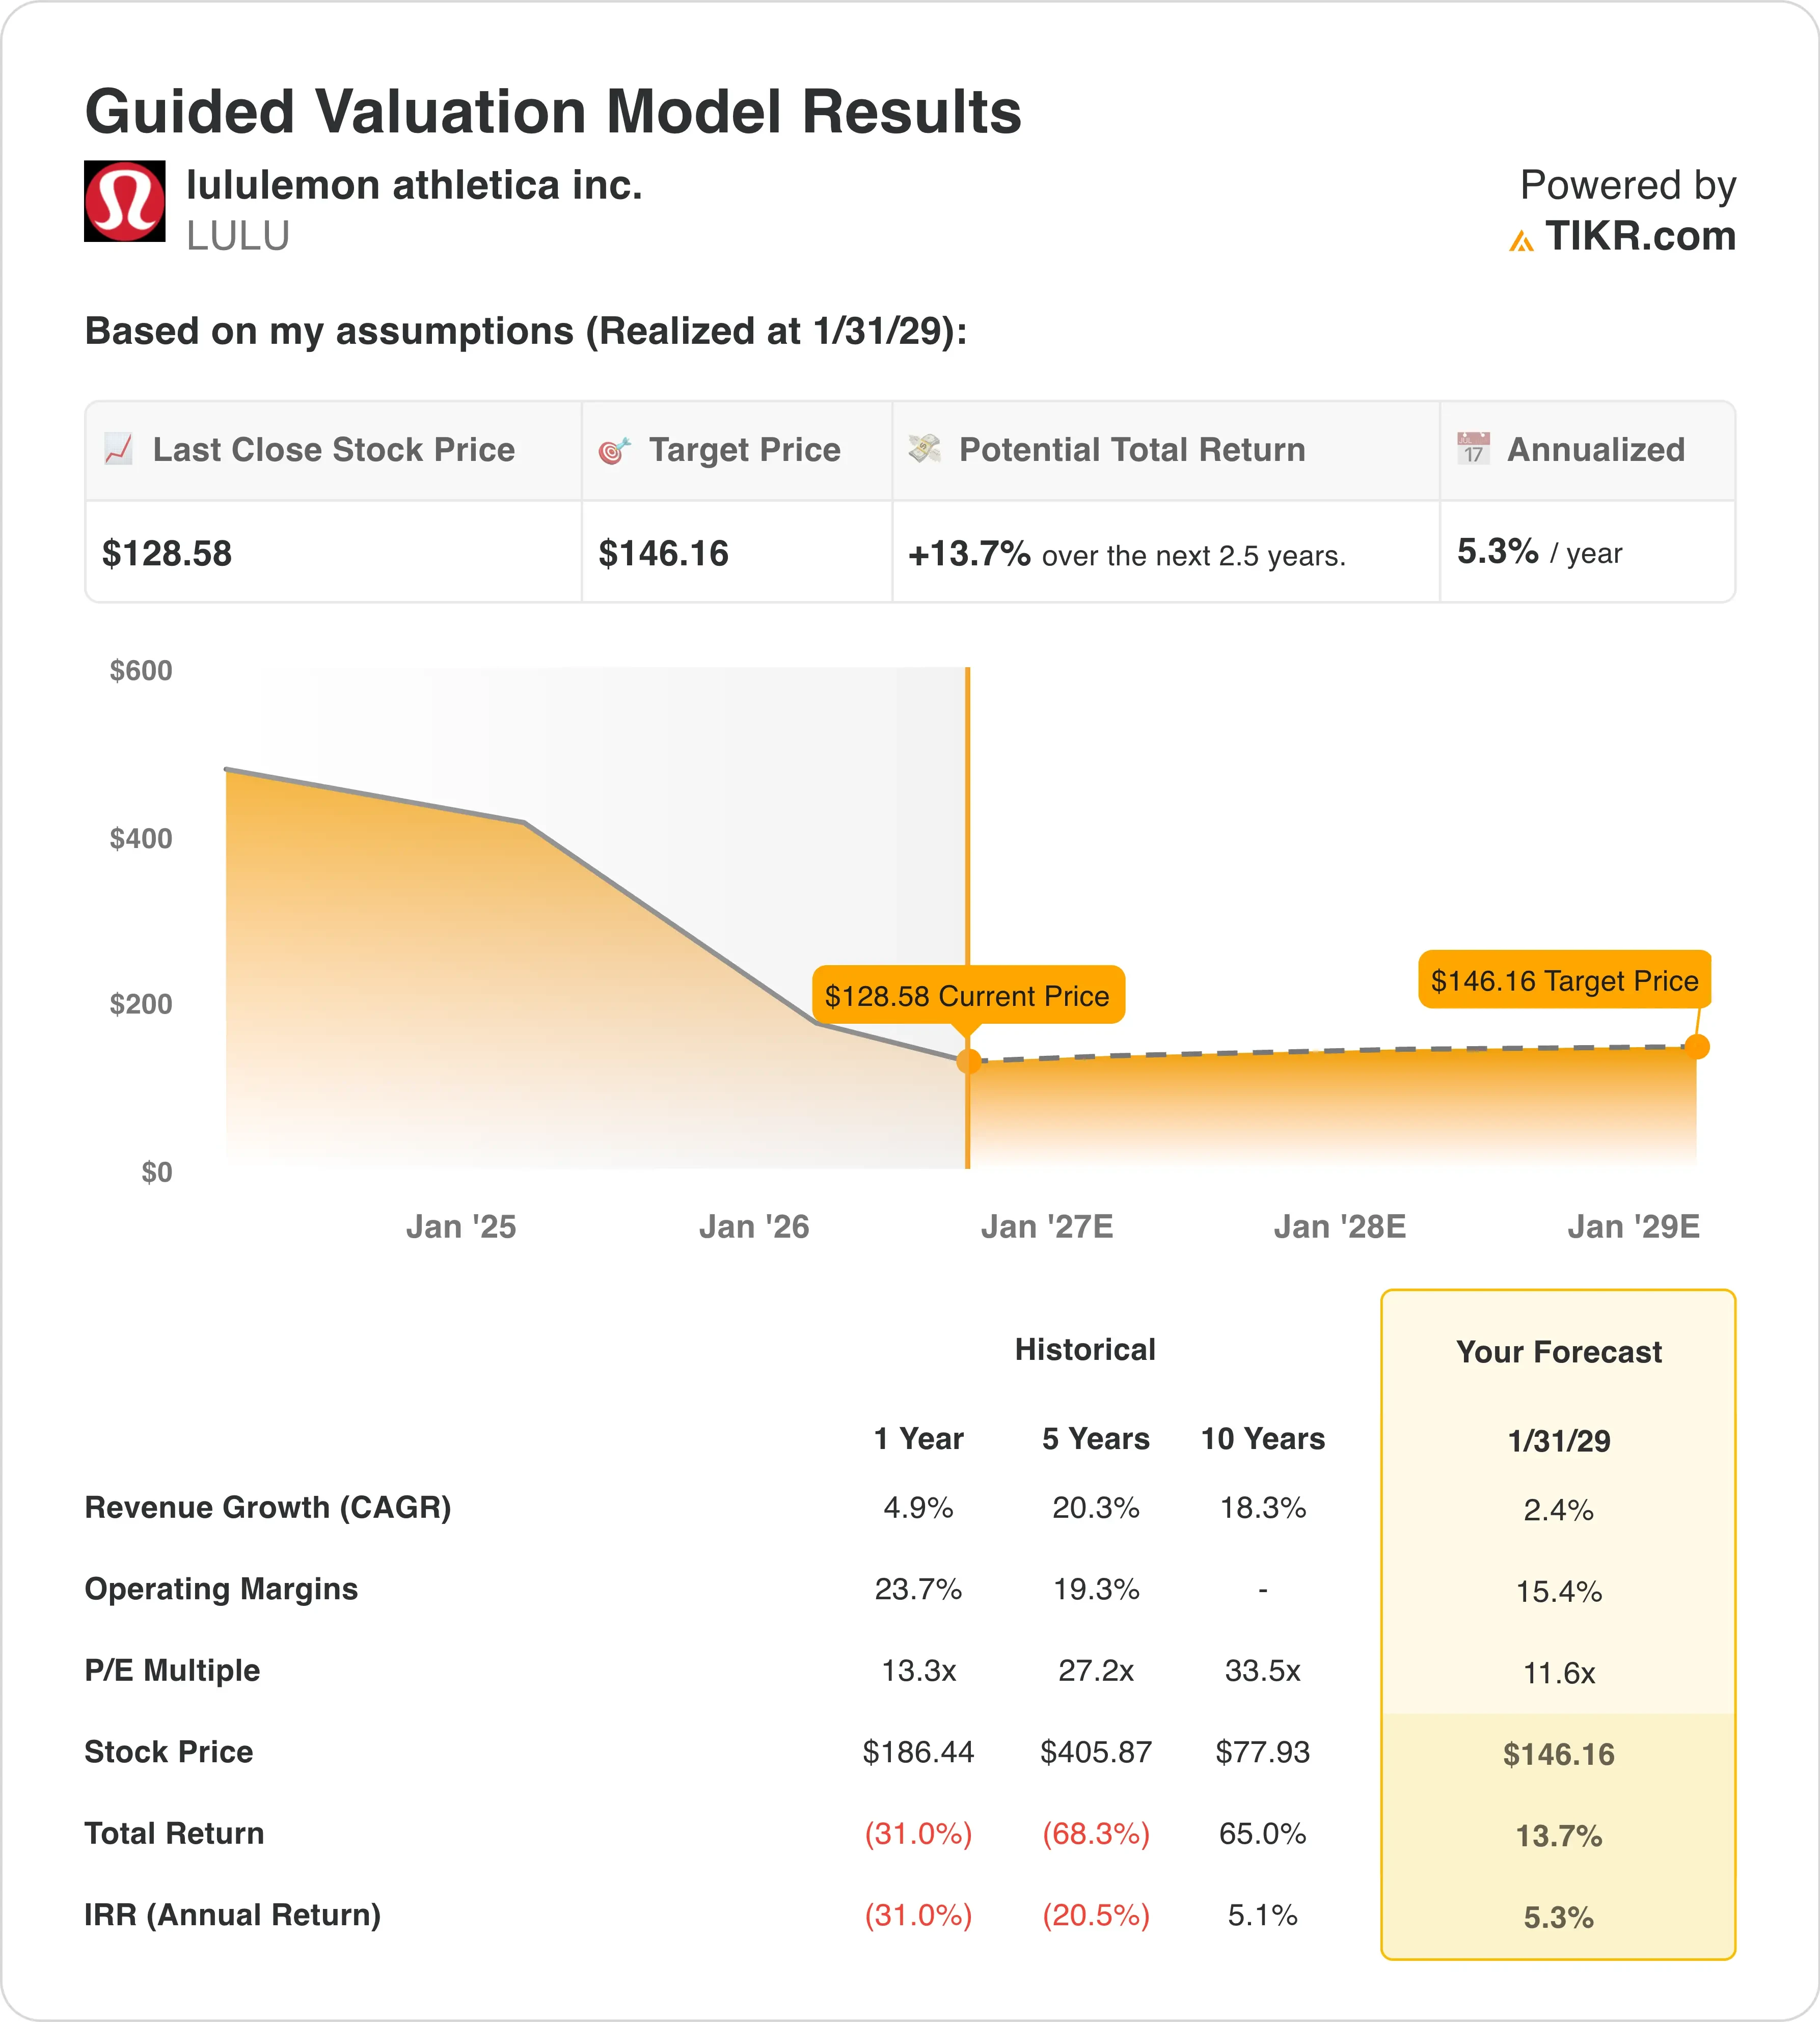
Under valuation model assumptions realized through 1/31/29, the stock is modeled using:
- Revenue Growth (CAGR): 2.4%
- Operating Margins: 15.4%
- Exit P/E Multiple: 11.6x
Based on these inputs, the model estimates a target price of $146, implying a 13.7% total return and an annualized return of 5.3% over the next 2.5 years.
Lululemon’s valuation model tells a cautious story that matches its current fundamentals. A 2.4% revenue growth assumption sits well below the company’s own five-year average near 20%, reflecting how far North American demand has fallen from its earlier trajectory. The 15.4% operating margin estimate is similarly conservative next to Lululemon’s historical margins closer to 19% to 24%.

The 11.6x exit multiple stands out as unusually low for a brand that once traded above 30x forward earnings. That contraction reflects investor skepticism about whether Lululemon can defend its premium positioning against faster-growing athletic and athleisure competitors gaining share in North America.
Whether the stock looks cheap or simply reflects a structurally weaker business depends on execution under new leadership. If Heidi O’Neill can stabilize U.S. traffic and reduce markdown activity, margins could recover toward historical levels faster than the model assumes, since even modest improvement from a low base would meaningfully lift returns.
The annualized return of 5.3% sits below the 10% ownership threshold many investors use as a baseline, signaling limited upside until North American trends turn. That leaves Lululemon firmly in show-me mode heading into its next earnings report.
See how Lululemon’s multiple compares to its own trading history (Free with TIKR) >>>
Lululemon vs. the Athletic Apparel Field
Lululemon’s struggles stand out most clearly next to Nike (NKE) and On Holding (ONON), two competitors gaining share in categories Lululemon once dominated. Nike’s broader athletic portfolio has also faced its own North American softness, but the company’s global scale and lower valuation, trading closer to 25x forward earnings versus Lululemon’s 11.6x model assumption, reflect very different investor expectations for each brand’s recovery path.
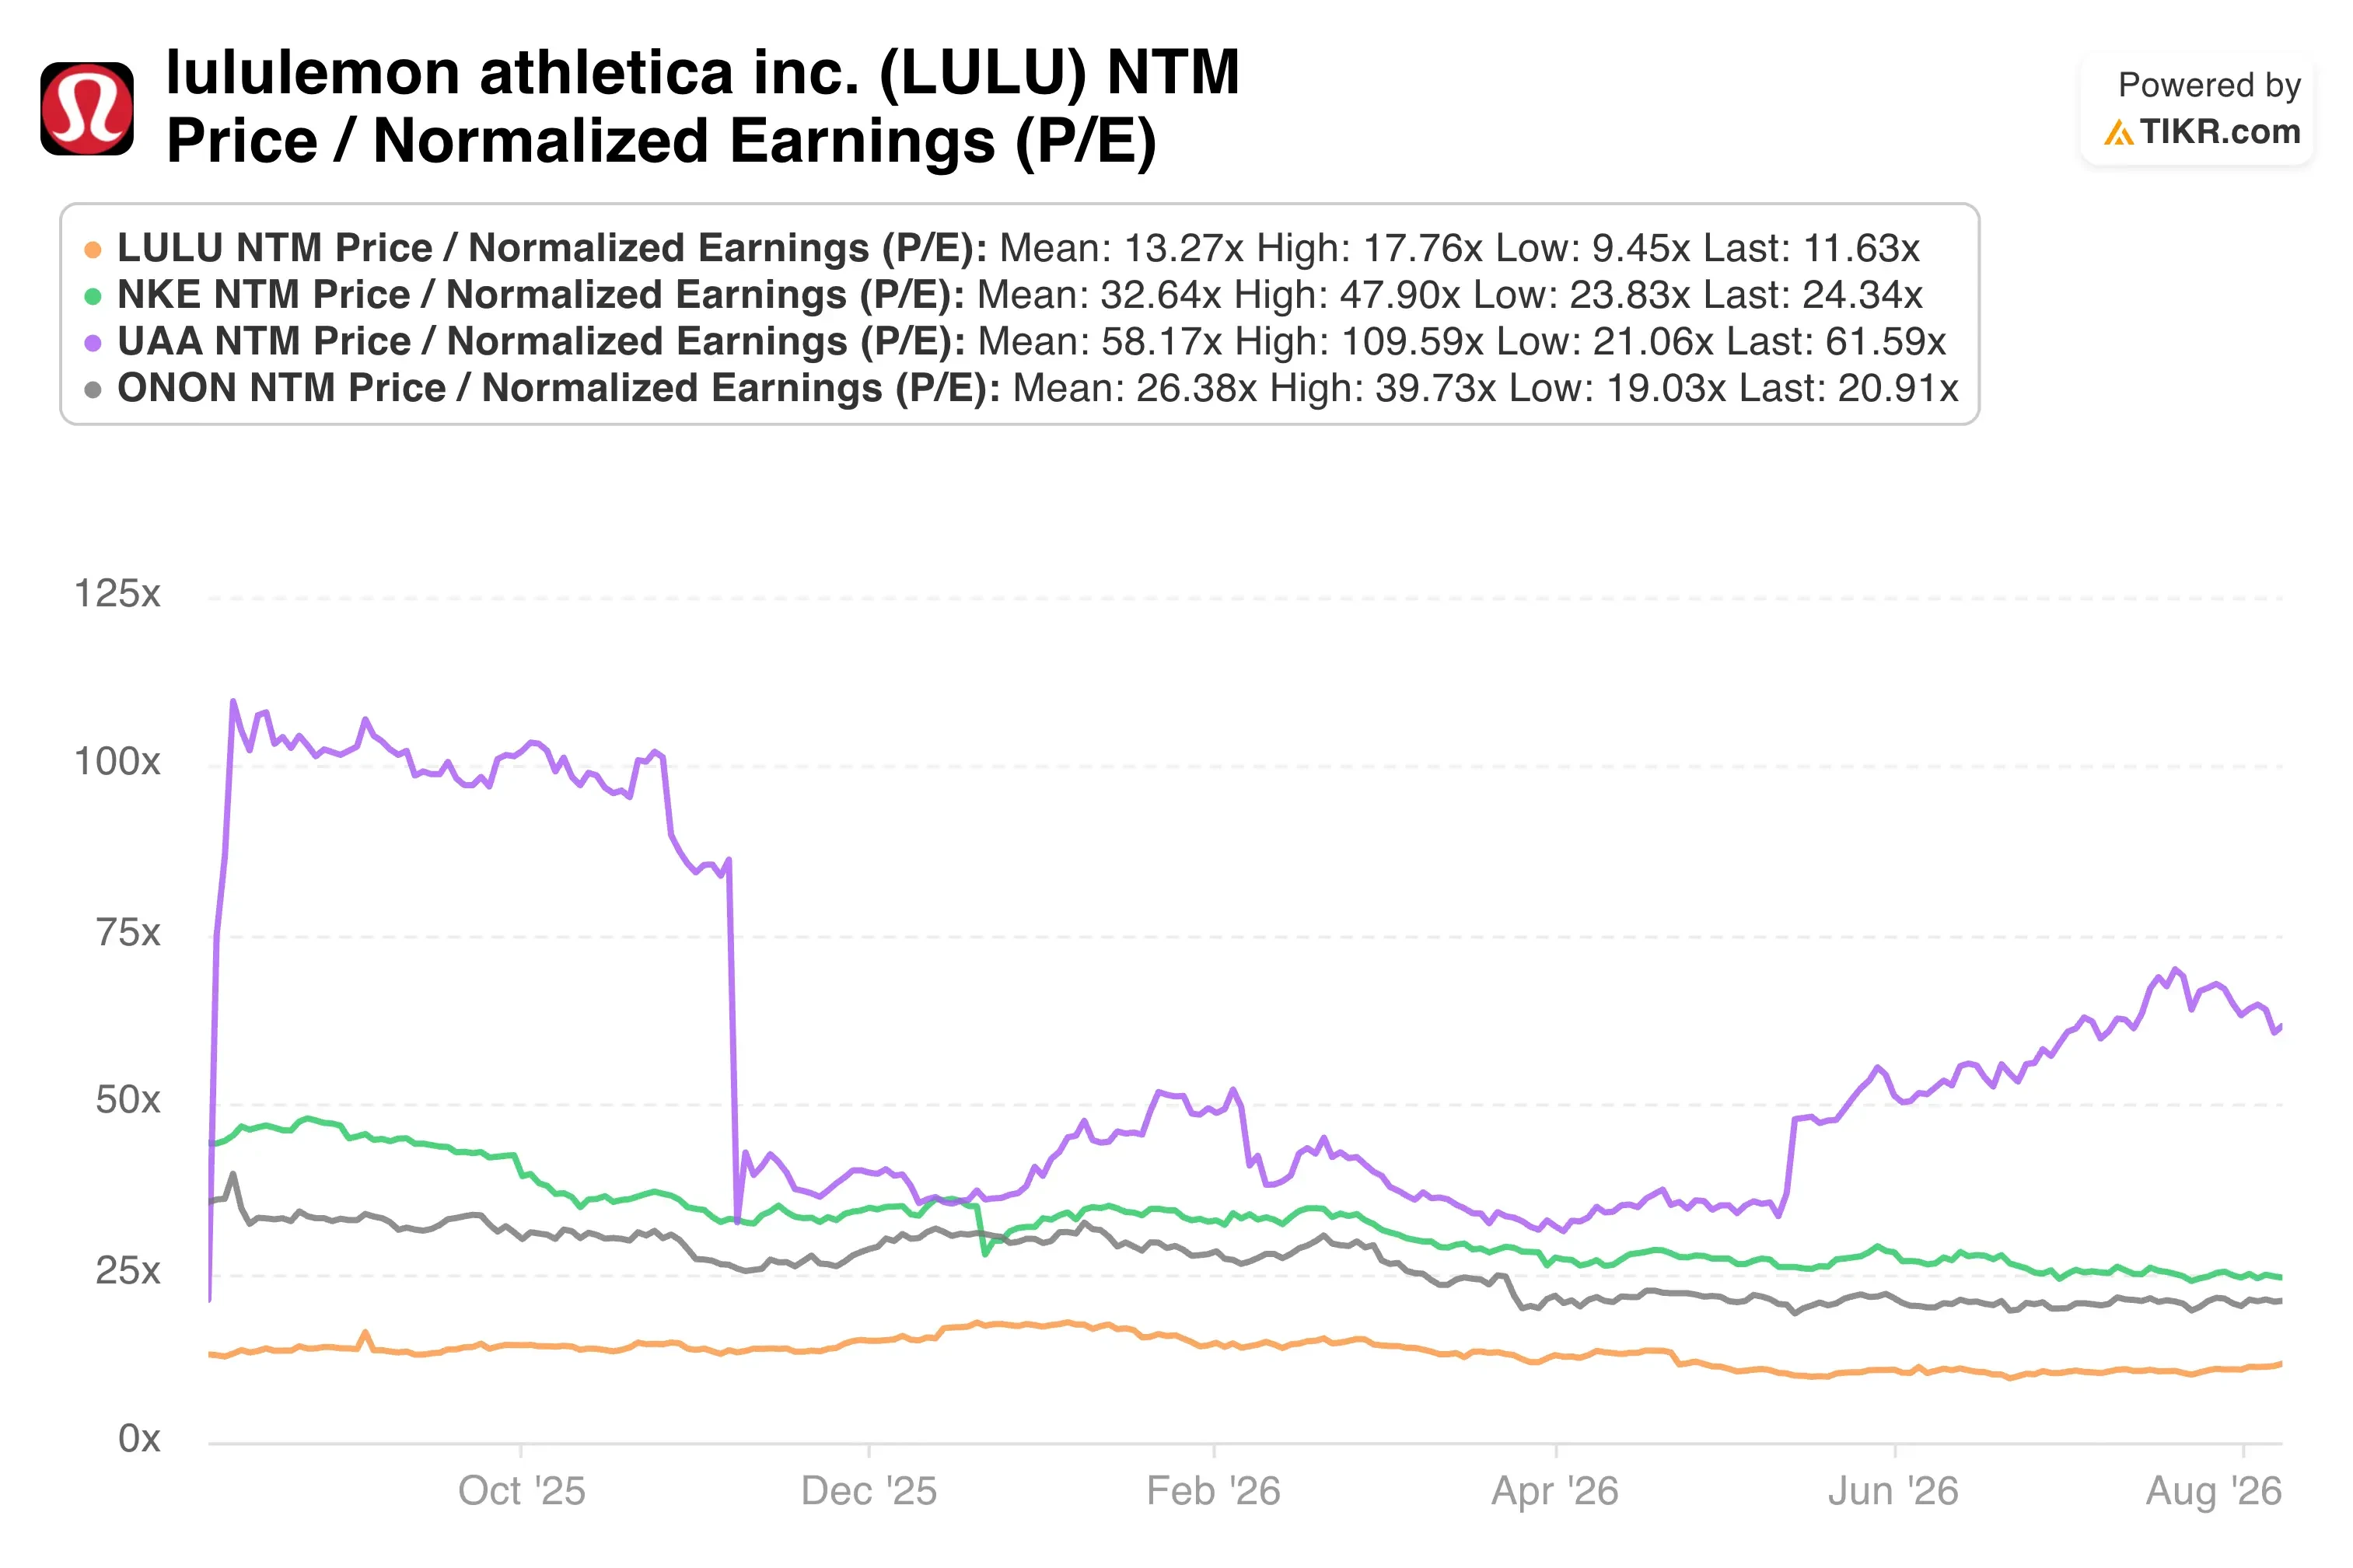
On Holding, the faster-growing Swiss athletic brand, has continued posting revenue growth in the twenties percentage range even as Lululemon’s growth has slowed toward flat. That gap helps explain why some of Lululemon’s North American customers appear to be shifting spending toward newer, culturally relevant brands rather than established athleisure names.
Under Armour (UAA) offers a cautionary parallel rather than a direct comparison, since it recently forecast a steeper annual sales decline tied to weak North American demand, the same core problem now facing Lululemon. The read for investors is that North American athletic apparel demand broadly has softened, even as Lululemon’s issues are compounded by brand-specific execution problems layered on top of the category-wide slowdown.
What’s Driving LULU Stock Going Forward?
The most immediate catalyst is Lululemon’s upcoming Q2 report, where investors will look for evidence that North American comparable sales and traffic are stabilizing. Management’s own guidance calls for North America revenue to decline in the high single digits for the full year, so any improvement versus that bar would be meaningfully positive.
Leadership transition remains a central storyline. Heidi O’Neill’s arrival as permanent CEO gives Lululemon a chance to reset its product strategy after a proxy fight with founder Chip Wilson ended in a negotiated settlement earlier this year. The board’s product-first agreement with Wilson could shape merchandising decisions heading into the holiday season.
Tariff costs will keep pressuring margins in the near term, since gross margin already fell more than four points last quarter due to tariff impact and fixed-cost deleverage. Any relief on trade policy, or further deterioration, would move Lululemon’s already reduced earnings guidance in either direction.
Finally, China remains a genuine growth engine worth tracking separately from the North American story. Continued expansion there, alongside rest-of-world growth in the mid-teens, could offset some domestic weakness if North American trends take longer than expected to recover.
Estimate a company’s fair value instantly (Free with TIKR) >>>
Should You Invest in lululemon?
The only way to really know is to look at the numbers yourself. TIKR gives you free access to the same institutional-quality financial data that professional analysts use to answer exactly that question.
Pull up LULU, and you’ll see years of historical financials, what Wall Street analysts expect for revenue and earnings in the quarters ahead, how valuation multiples have moved over time, and whether price targets are trending up or down.
You can build a free watchlist to track LULU alongside every other stock on your radar. No credit card required. Just the data you need to decide for yourself.
Analyze LULU stock on TIKR Free→
Disclaimer:
Please note that the articles on TIKR are not intended to serve as investment or financial advice from TIKR or our content team, nor are they recommendations to buy or sell any stocks. We create our content based on TIKR Terminal’s investment data and analysts’ estimates. Our analysis might not include recent company news or important updates. TIKR has no position in any stocks mentioned. Thank you for reading, and happy investing!