Key Stats for Chevron Stock
- Current Price: $186.56
- Target Price (Mid): ~$204
- Potential Total Return: ~9%
- Annualized IRR: ~2% / year
Now Live: Discover how much upside your favorite stocks could have using TIKR’s new Valuation Model (It’s free) >>>
What Happened?
Chevron Corporation (CVX) ran one of the cleanest quarters in its recent history in the second quarter of 2026, and the TIKR model says a buyer at today’s price still earns only about 2% a year through 2030. That gap is the story. The business is executing at a level Chevron has rarely matched, yet the return the numbers support from $186.56 is thin, because most of what management delivered is already in the price.
The tell is in CFO Eimear Bonner’s own framing of the long-term plan. Chevron’s 2030 objectives, she told analysts, including production growth of 2% to 3% and free cash flow growth averaging more than 10% a year, are built “at flat commodity prices that are lower than today.” Strip out the geopolitical premium in oil, and the forward case leans on the execution that the model already assumes.
A Clinic in Execution, Priced In
Adjusted earnings came in at $6.06 per share on $70.06 billion in revenue, beating the Street’s roughly $5.57 estimate, and reported net income reached $12.1 billion. US upstream production set a record near 2.1 million barrels of oil equivalent per day, US refinery throughput topped 1 million barrels per day, and global output grew more than 5% quarter over quarter. Much of that came from Tengizchevroil in Kazakhstan, where a low-capital debottlenecking lifted the third-generation plant’s nameplate oil capacity from 260,000 to 320,000 barrels per day, taking total field processing above 1 million barrels per day.
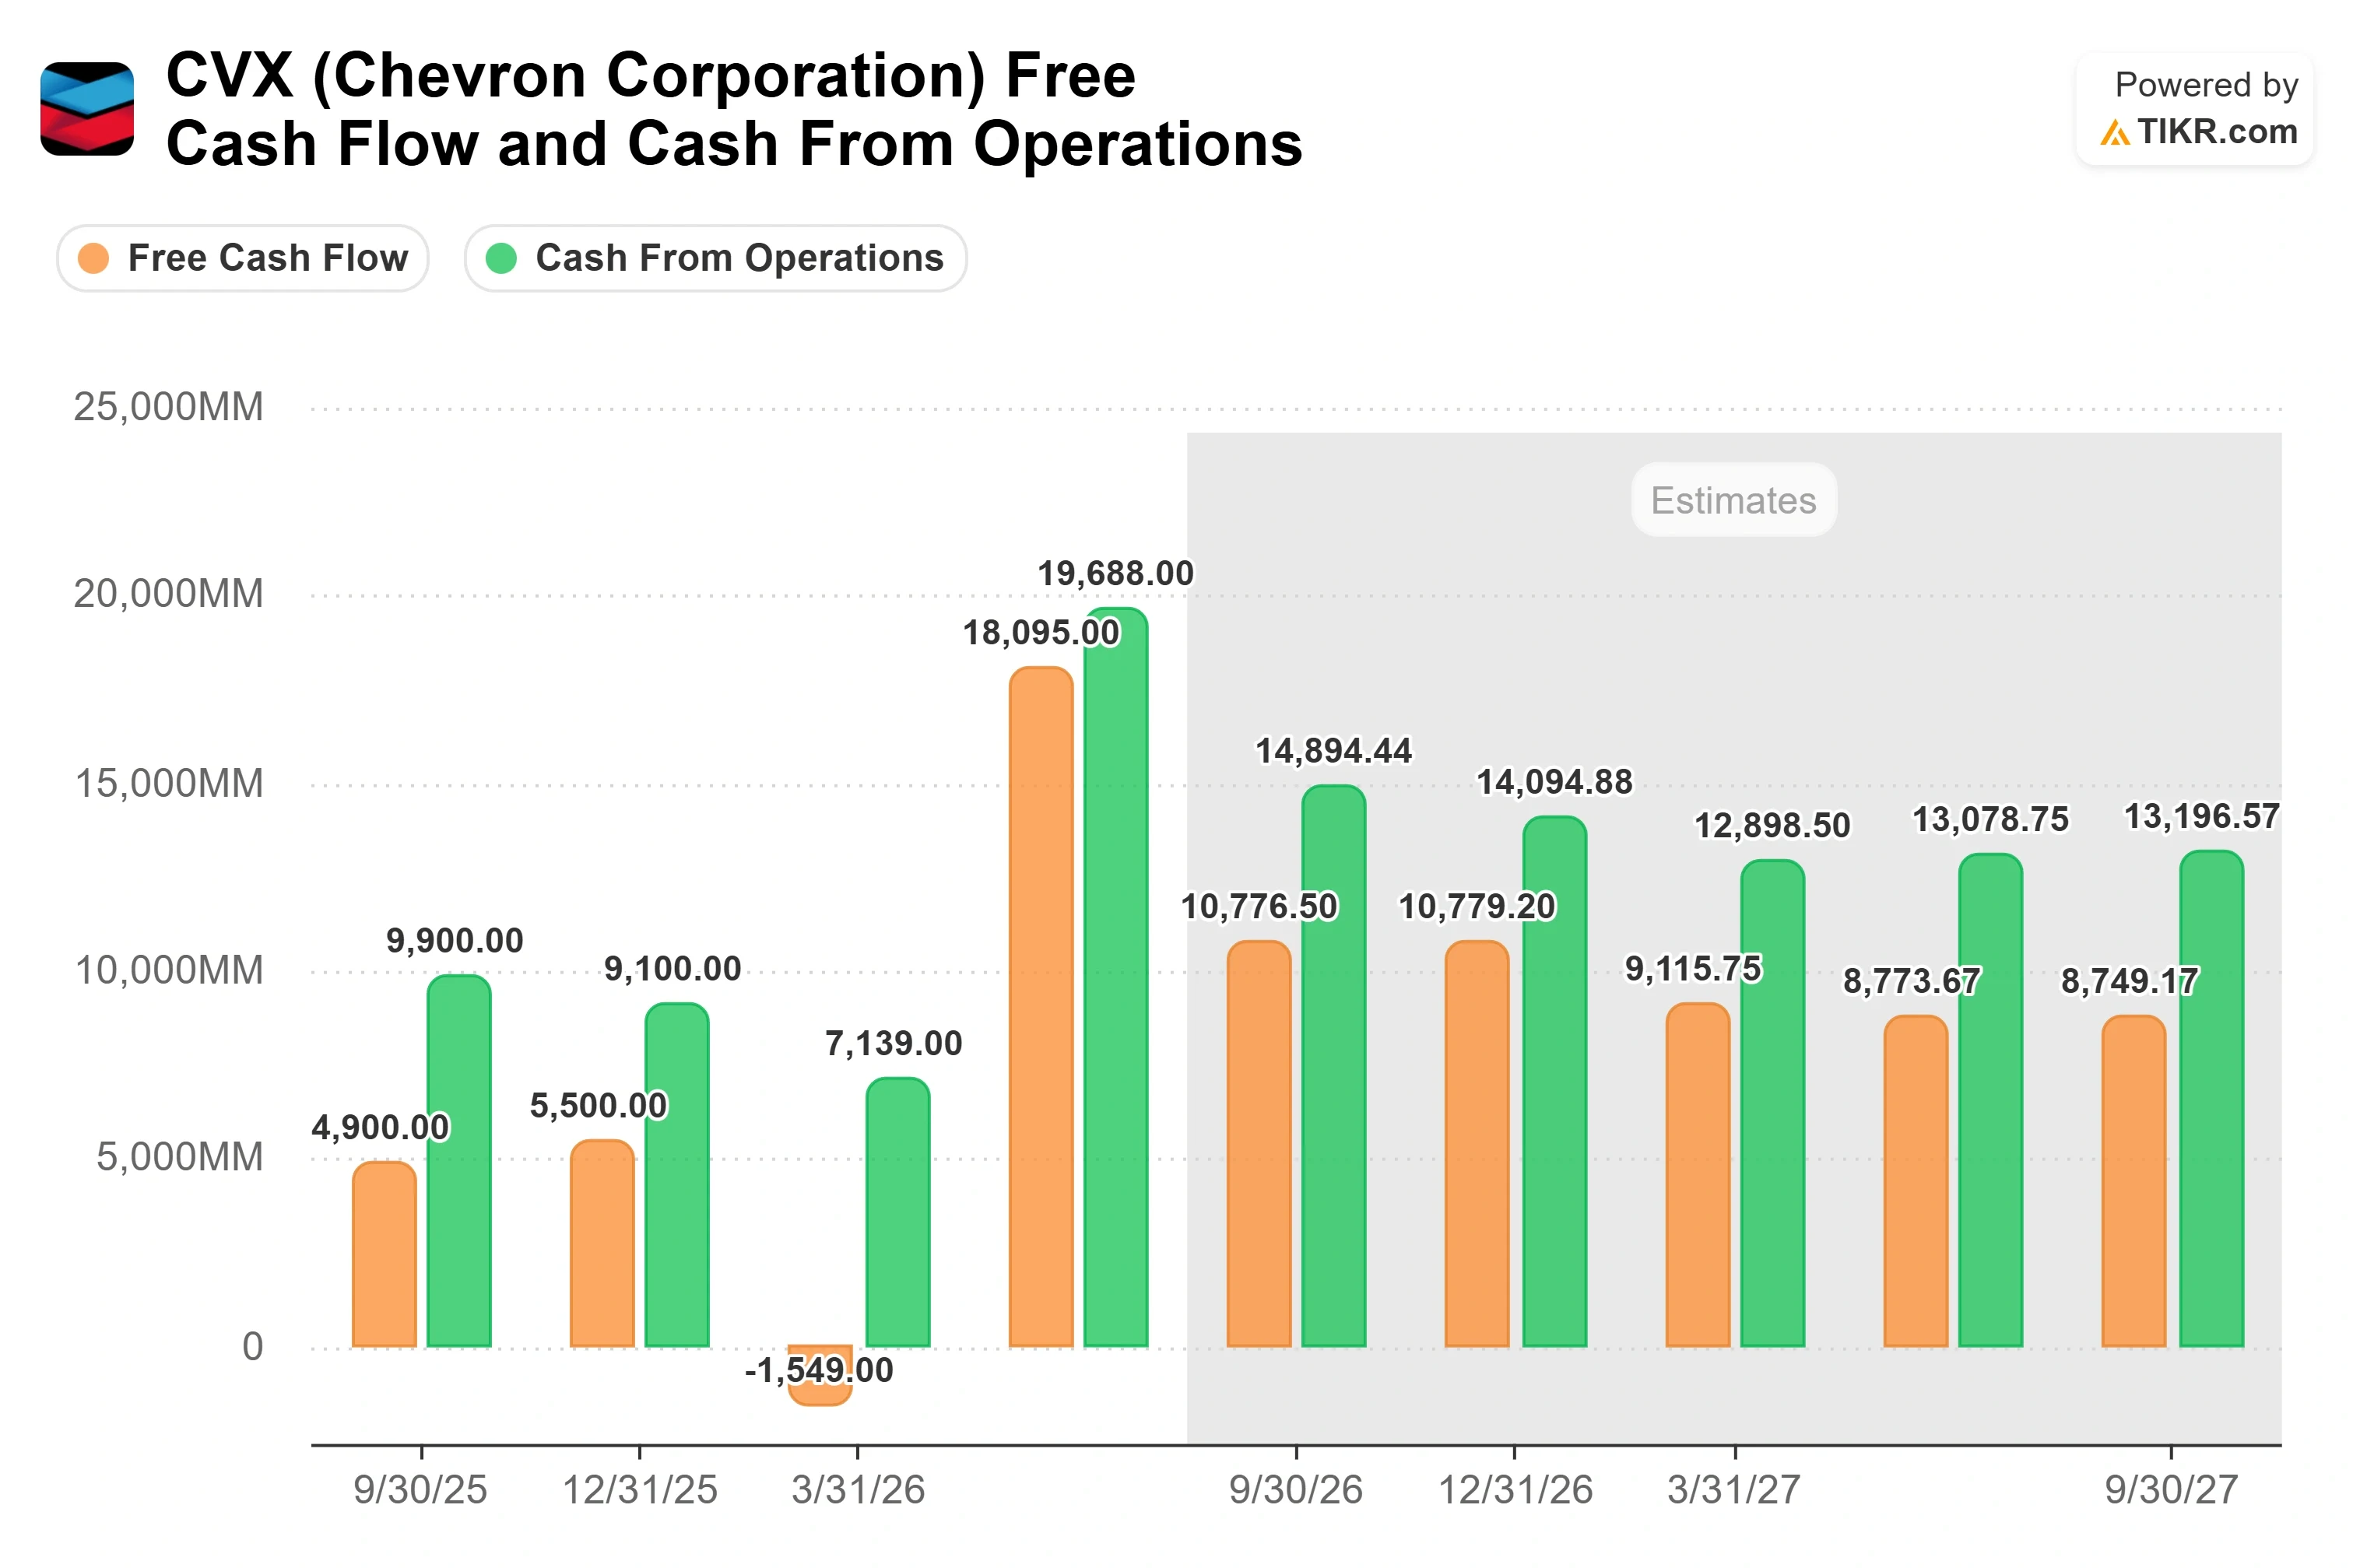
The discipline underneath was just as strong. “We achieved $3 billion of structural cost reductions over the past 12 months, reaching our target 6 months ahead of schedule,” Bonner said, noting more than 70% came from efficiency gains rather than one-time cuts, which tend to stick better. The Hess integration, one year in, captured 50% more synergies than first targeted, with $1.5 billion realized six months early and Guyana throwing off free cash flow that management says is roughly double the incremental dividends the deal added. Chevron also cut debt by more than $8 billion in the quarter, finishing at 0.6x net debt to cash flow from operations, on $19.7 billion of operating cash flow and $15.4 billion of adjusted free cash flow.
See historical and forward estimates for Chevron stock (It’s free!) >>>
What a Near-Perfect Quarter Is Actually Worth
The mechanics explain the modest number. The mid case assumes forward revenue growth of essentially zero, roughly 0.6% a year, with net margin climbing toward roughly 11.5%. Earnings still grow around 8% a year on that margin expansion and buybacks. The drag is the multiple: the same model bakes in P/E ratio compression of about 6% a year, which absorbs most of the earnings growth as oil-driven strength fades and growth normalizes.
A large share of this year’s earnings power came from price rather than volume, as Middle East disruption tightened crude and widened refining margins. It is worth remembering that the Kazakhstan barrels behind the production record ship through the Caspian Pipeline Consortium terminal at Novorossiysk, which was halted several times over July and early August by drone strikes, a reminder that realized prices carry real geopolitical risk in both directions.
The stock is not obviously cheap against peers either. Chevron trades at about 5.6x NTM EV/EBITDA, below ExxonMobil at 7.4x but above Shell at 4.2x and TotalEnergies at 4.7x on the same measure. The premium to the European majors is real, earned by the balance sheet and the Hess-fed growth runway, but it is a premium a buyer pays into, not a discount to capture.

See how Chevron performs against its peers in TIKR (It’s free!) >>>
TIKR Advanced Model Analysis
- Current Price: $186.56
- Target Price (Mid): ~$204
- Potential Total Return: ~9%
- Annualized IRR: ~2% / year

See analysts’ growth forecasts and price targets for Chevron stock (It’s free!) >>>
Using the mid-case realized through 2030, the model targets roughly $204. The two revenue drivers are modest: incremental volume from Guyana and the Permian plateau, and Hess synergies feeding cash rather than the top line. The margin driver is the structural cost program lifting net margin toward roughly 11.5%. The primary risk is the multiple, where the model assumes steady P/E compression that offsets most of the earnings growth.
The upside is clean: if oil holds near current levels instead of the flat, lower prices management plans around, realized earnings run ahead of the model, and the stock pushes toward the Street’s ~$217 mean or the model’s high case near $303. The downside is just as clean: if crude softens and the multiple compresses as modeled, a buyer at $186.56 waits several years for a high-single-digit total return, most of it collected as the dividend.
Conclusion
The next real test is the third-quarter print, expected in late October or early November. The number to watch is not headline EPS but the spread between realized prices and the flat commodity assumption under the model. If oil stays elevated and refining margins hold, Chevron over-earns its plan, and the stock has a reason to close toward $217. If crude reverts and the multiple compresses as modeled, the operational excellence on display this quarter is already in the price, and the return from here stays near 2% a year.
See what stocks billionaire investors are buying so you can follow the smart money with TIKR.
Should You Invest in Chevron?
The only way to really know is to look at the numbers yourself. TIKR gives you free access to the same institutional-quality financial data that professional analysts use to answer exactly that question.
Pull up Chevron, and you’ll see years of historical financials, what Wall Street analysts expect for revenue and earnings in the quarters ahead, how valuation multiples have moved over time, and whether price targets are trending up or down.
You can build a free watchlist to track Chevron alongside every other stock on your radar. No credit card required. Just the data you need to decide for yourself.
Analyze Chevron on TIKR Free →
Looking for New Opportunities?
- See what stocks billionaire investors are buying so you can follow the smart money.
- Analyze stocks in as little as 5 minutes with TIKR’s all-in-one, easy-to-use platform.
- The more rocks you overturn… the more opportunities you’ll uncover. Search 100K+ global stocks, global top investor holdings, and more with TIKR.
Disclaimer:
Please note that the articles on TIKR are not intended to serve as investment or financial advice from TIKR or our content team, nor are they recommendations to buy or sell any stocks. We create our content based on TIKR Terminal’s investment data and analysts’ estimates. Our analysis might not include recent company news or important updates. TIKR has no position in any stocks mentioned. Thank you for reading, and happy investing!