

Key Stats for Home Depot Stock
- Current Price: $355.62
- Target Price (Mid): ~$540
- Street Target: ~$370
- Potential Total Return: ~52%
- Annualized IRR: ~10% / year
Now Live: Discover how much upside your favorite stocks could have using TIKR’s new Valuation Model (It’s free) >>>
What Happened?
The Home Depot (HD) reports fiscal second-quarter results before the market opens on Tuesday, August 18, and the stock walks in with something to prove. Shares closed at $355.62 on August 7, down about 8% over the past year on a total-return basis, while the S&P 500 gained double digits. The company has spent a year telling investors its business has stabilized. Now it has to show that stabilization is turning into something a buyer gets paid for.
What makes this print different is that management already told everyone where the pressure sits. On the May call, CEO Ted Decker was blunt that the expected pickup later this year is “solely driven by a return to normal storm activity,” not a rebound in underlying demand. Q2 is the first read on whether the spring promises hold, and two lines carry the quarter.
The Comp Number Has to Clear a Bar Management Set Itself
Wall Street expects roughly $47 billion in revenue and adjusted earnings of around $4.73 per share, against $4.68 a year ago. The revenue jump from Q1’s $41.8 billion is normal, since Q2 holds the year’s largest selling weeks. The tell is the comparable sales line underneath.
Home Depot guided fiscal 2026 comps to flat-to-2% growth, and Q1 landed at positive 0.6%. Reaching even the midpoint needs the back half to do real work, and Decker attributed that assumed improvement to storms normalizing rather than customers taking on big projects. That sets a clean test. A Q2 comp near or above the 0.6% pace, with U.S. comps positive, keeps the full-year path intact. A flat-to-negative comp puts the guide at the mercy of Q3 and Q4 and revives the question the stock has been stuck on all year: is the consumer engaging, or just browsing?
The Q1 detail offers some reason for optimism. Nine of 16 merchandising departments posted positive comps, the average ticket rose 2.2% even as transactions slipped, and big-ticket transactions over $1,000 turned positive at 0.8%. The weakness sat in large discretionary projects, the kind that need a homeowner confident enough to pull a permit. Whether that confidence showed up in the peak spring weeks is what the comp line will reveal.

See historical and forward estimates for Home Depot stock (It’s free!) >>>
Margins Are the Line Bears Will Read First
The number bears will read first is gross margin, and the setup is genuinely mixed. Q1 gross margin came in at 33%, down about 75 basis points year over year, and CFO Richard McPhail was explicit that the drag was mostly the GMS acquisition changing the sales mix, not a break in the core. He told investors that pressure would continue in Q2, “not quite the degree that you saw in Q1,” before improving to roughly flat by the back half.
McPhail flagged that fuel and commodity costs had started biting since the prior call and new tariffs were in play, with the environment “changing almost every day,” while filed tariff refunds sit as an offset the company has not yet collected. A cleaner-than-feared number validates the operating-leverage recovery bulls are counting on, while any pressure beyond the mix drag lands hard on a stock the market still values for quality. Home Depot trades near a 23 forward P/E ratio, a discount to the roughly 30 for TJX and 32 for Ross Stores among the large specialty retailers TIKR groups it with, yet its return on invested capital of 25.4% in the quarter, down from 31.3% a year earlier, dwarfs the peer set. A business earning those returns trading below lower-quality peers is the setup bulls point to, and a clean margin print is what turns that discount into a re-rating.

See how Home Depot performs against its peers in TIKR (It’s free!) >>>
The Pro Build Is the Real Story, and It Just Got a New Org Chart
The most consequential story at Home Depot is the one least visible in a single earnings line: the push to win the professional contractor. Management sizes the Pro opportunity at a $700 billion market, and the May completion of the Mingledorff’s HVAC distribution deal lifted the total addressable market to $1.2 trillion. On the call, Decker put a number on the near-term payoff, saying the company expects “something like $400 million of cross-sell run rate” this year across Home Depot, SRS, and GMS, with plans to double that next year. That figure is a run-rate target, not booked revenue, and it builds over the year rather than resolving in one print.
Investors got a fresh signal on July 30, when Home Depot announced an organizational realignment unifying leadership across merchandising, loyalty, finance, Pro operations, and technology, and renamed its Office of Integration the Office of Pro Acceleration under McPhail. Restructuring the org chart around the Pro states where management believes the growth comes from, and the call is the first chance to hear how the cross-sell engine tracks against that marker.
One overhang rounds out the backdrop. Home Depot is working through a data-privacy class action filed July 1 in Virginia federal court, alleging it sold customer information through its Orange Apron Media network without notice. The allegations are unproven, and no financial exposure has been quantified, though the headline drew attention and sits alongside a separate California surveillance suit.
TIKR Advanced Model Analysis
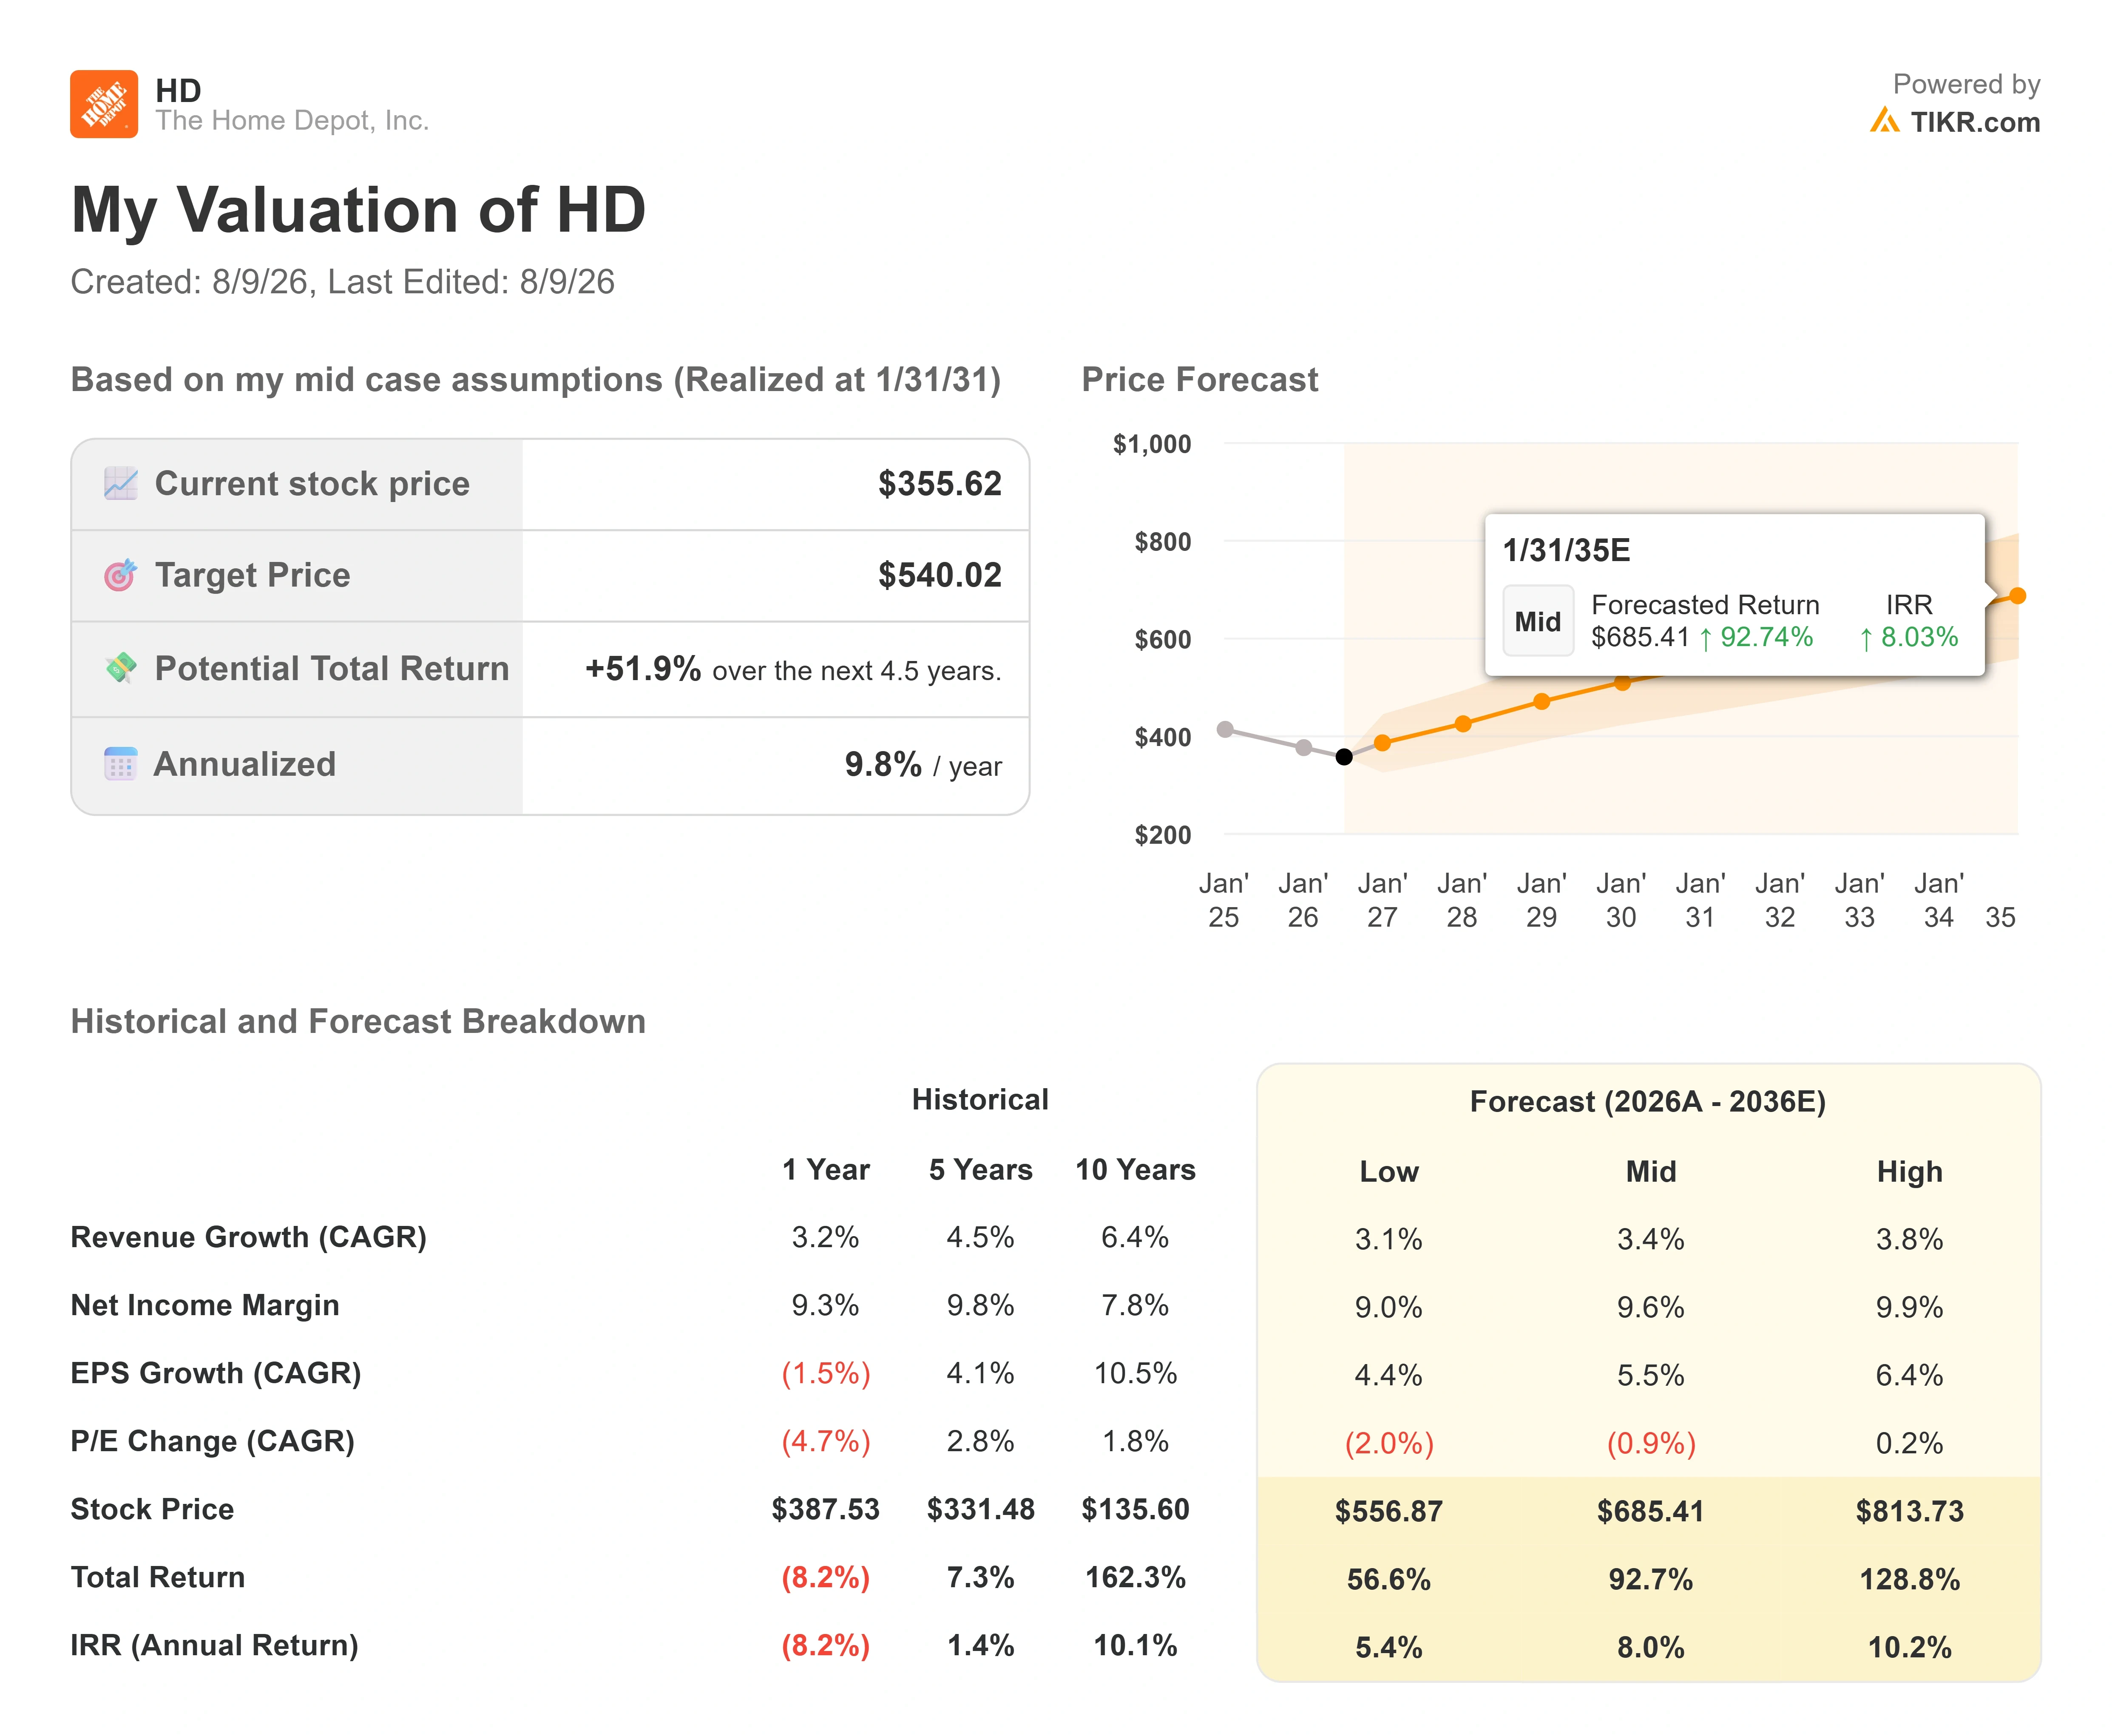
- Current Price: $355.62
- Target Price (Mid): ~$540
- Potential Total Return: ~52%
- Annualized IRR: ~10% / year
See analysts’ growth forecasts and price targets for Home Depot stock (It’s free!) >>>
TIKR’s mid-case model puts fair value near $540 over roughly the next four and a half years, well above the Street’s ~$370 mean. Two revenue drivers carry it: mid-single-digit organic growth at the core, plus the SRS specialty-distribution and Pro cross-sell build. The margin driver is a net income margin recovering toward the high-9% range as the GMS mix fades, and that recovery is also the primary risk, since the model assumes no multiple expansion to reach its target. Upside: comps hold, margins normalize, and the stock re-rates toward its own history. Downside: rates stay higher for longer, housing turnover holds at multi-decade lows, and the stock keeps doing what it has done for a year, which is nothing.
Conclusion
The one line to watch on August 18 is comparable sales. Management set the bar itself: the flat-to-2% full-year guide leans on a stronger second half that Decker attributed to storms returning, not demand recovering. A Q2 comp holding near or above the Q1 pace of 0.6%, paired with a gross margin decline no worse than the expected mix drag, says the setup is intact and the flat year was a pause. A negative comp, or margin pressure beyond the GMS mix, says the recovery is still being deferred. Results come before the open, with a 9 a.m. ET call to follow. Whether this stock is a coiled spring or a value trap runs through that comp line.
See what stocks billionaire investors are buying so you can follow the smart money with TIKR.
Should You Invest in Home Depot?
The only way to really know is to look at the numbers yourself. TIKR gives you free access to the same institutional-quality financial data that professional analysts use to answer exactly that question.
Pull up Home Depot, and you’ll see years of historical financials, what Wall Street analysts expect for revenue and earnings in the quarters ahead, how valuation multiples have moved over time, and whether price targets are trending up or down.
You can build a free watchlist to track Home Depot alongside every other stock on your radar. No credit card required. Just the data you need to decide for yourself.
Analyze Home Depot on TIKR Free →
Looking for New Opportunities?
- See what stocks billionaire investors are buying so you can follow the smart money.
- Analyze stocks in as little as 5 minutes with TIKR’s all-in-one, easy-to-use platform.
- The more rocks you overturn… the more opportunities you’ll uncover. Search 100K+ global stocks, global top investor holdings, and more with TIKR.
Disclaimer:
Please note that the articles on TIKR are not intended to serve as investment or financial advice from TIKR or our content team, nor are they recommendations to buy or sell any stocks. We create our content based on TIKR Terminal’s investment data and analysts’ estimates. Our analysis might not include recent company news or important updates. TIKR has no position in any stocks mentioned. Thank you for reading, and happy investing!


