


Key Stats for Bank of America Stock
- Current Price: $63.17
- Target Price (Mid): ~$78
- Street Target: ~$69
- Potential Total Return: ~24%
- Annualized IRR: ~5% / year
Now Live: Discover how much upside your favorite stocks could have using TIKR’s new Valuation Model (It’s free) >>>
What Happened?
Bank of America (BAC) closed at $63.17 on August 7, near its highest level in years and up around 38% over the past year from a low near $46. The rally has a real engine behind it: the bank just posted its strongest quarter in years, with trading revenue at a decade high and investment banking fees up 50%. So the question facing a buyer now is not whether the business is doing well. It plainly is. The question is what a record-adjacent price is actually paying for, and how much of the good news is already in the number.
That tension sharpened at the end of June, when Oppenheimer downgraded the stock to Perform and told clients it would rather “take the money and run” than wait for the next fear cycle in bank stocks.
The Quarter That Sent the Stock Higher
Bank of America earned $1.21 per share in the second quarter, beating the Street’s $1.13 estimate and growing 34% from a year ago. Revenue rose 15% to $31.6 billion, net income reached $9.1 billion, and every segment grew both revenue and net income while the efficiency ratio improved to 59%.
Global Markets was the standout. Sales and trading revenue climbed 33% to $7.2 billion, equities set a record at $3.6 billion, and fixed income delivered its best quarter in more than a decade. Investment banking fees jumped 50% to more than $2.1 billion, and net interest income reached $16.2 billion on a fully taxable equivalent basis, up 9%, prompting management to guide full-year NII growth to the top of its 6% to 8% range.
Two forward markers carried the call. CFO Alastair Borthwick reaffirmed the bank’s net interest margin goal: “We still feel good about that 2.30% number that we’re aiming for,” he said, adding the bank is “probably inside a couple of years now to get there.” With margin near 2.08% today, that gap is a large part of the earnings the bank believes it can produce without help from rates or the economy. On costs, after the first half delivered more than 450 basis points of operating leverage, management raised full-year guidance to 300 to 400 basis points, up from the “more than 200” guided in April. CEO Brian Moynihan said the company is “letting it come to the bottom line” while still investing in the franchise.

See historical and forward estimates for Bank of America stock (It’s free!) >>>
Why the Discount Argument Has Weakened
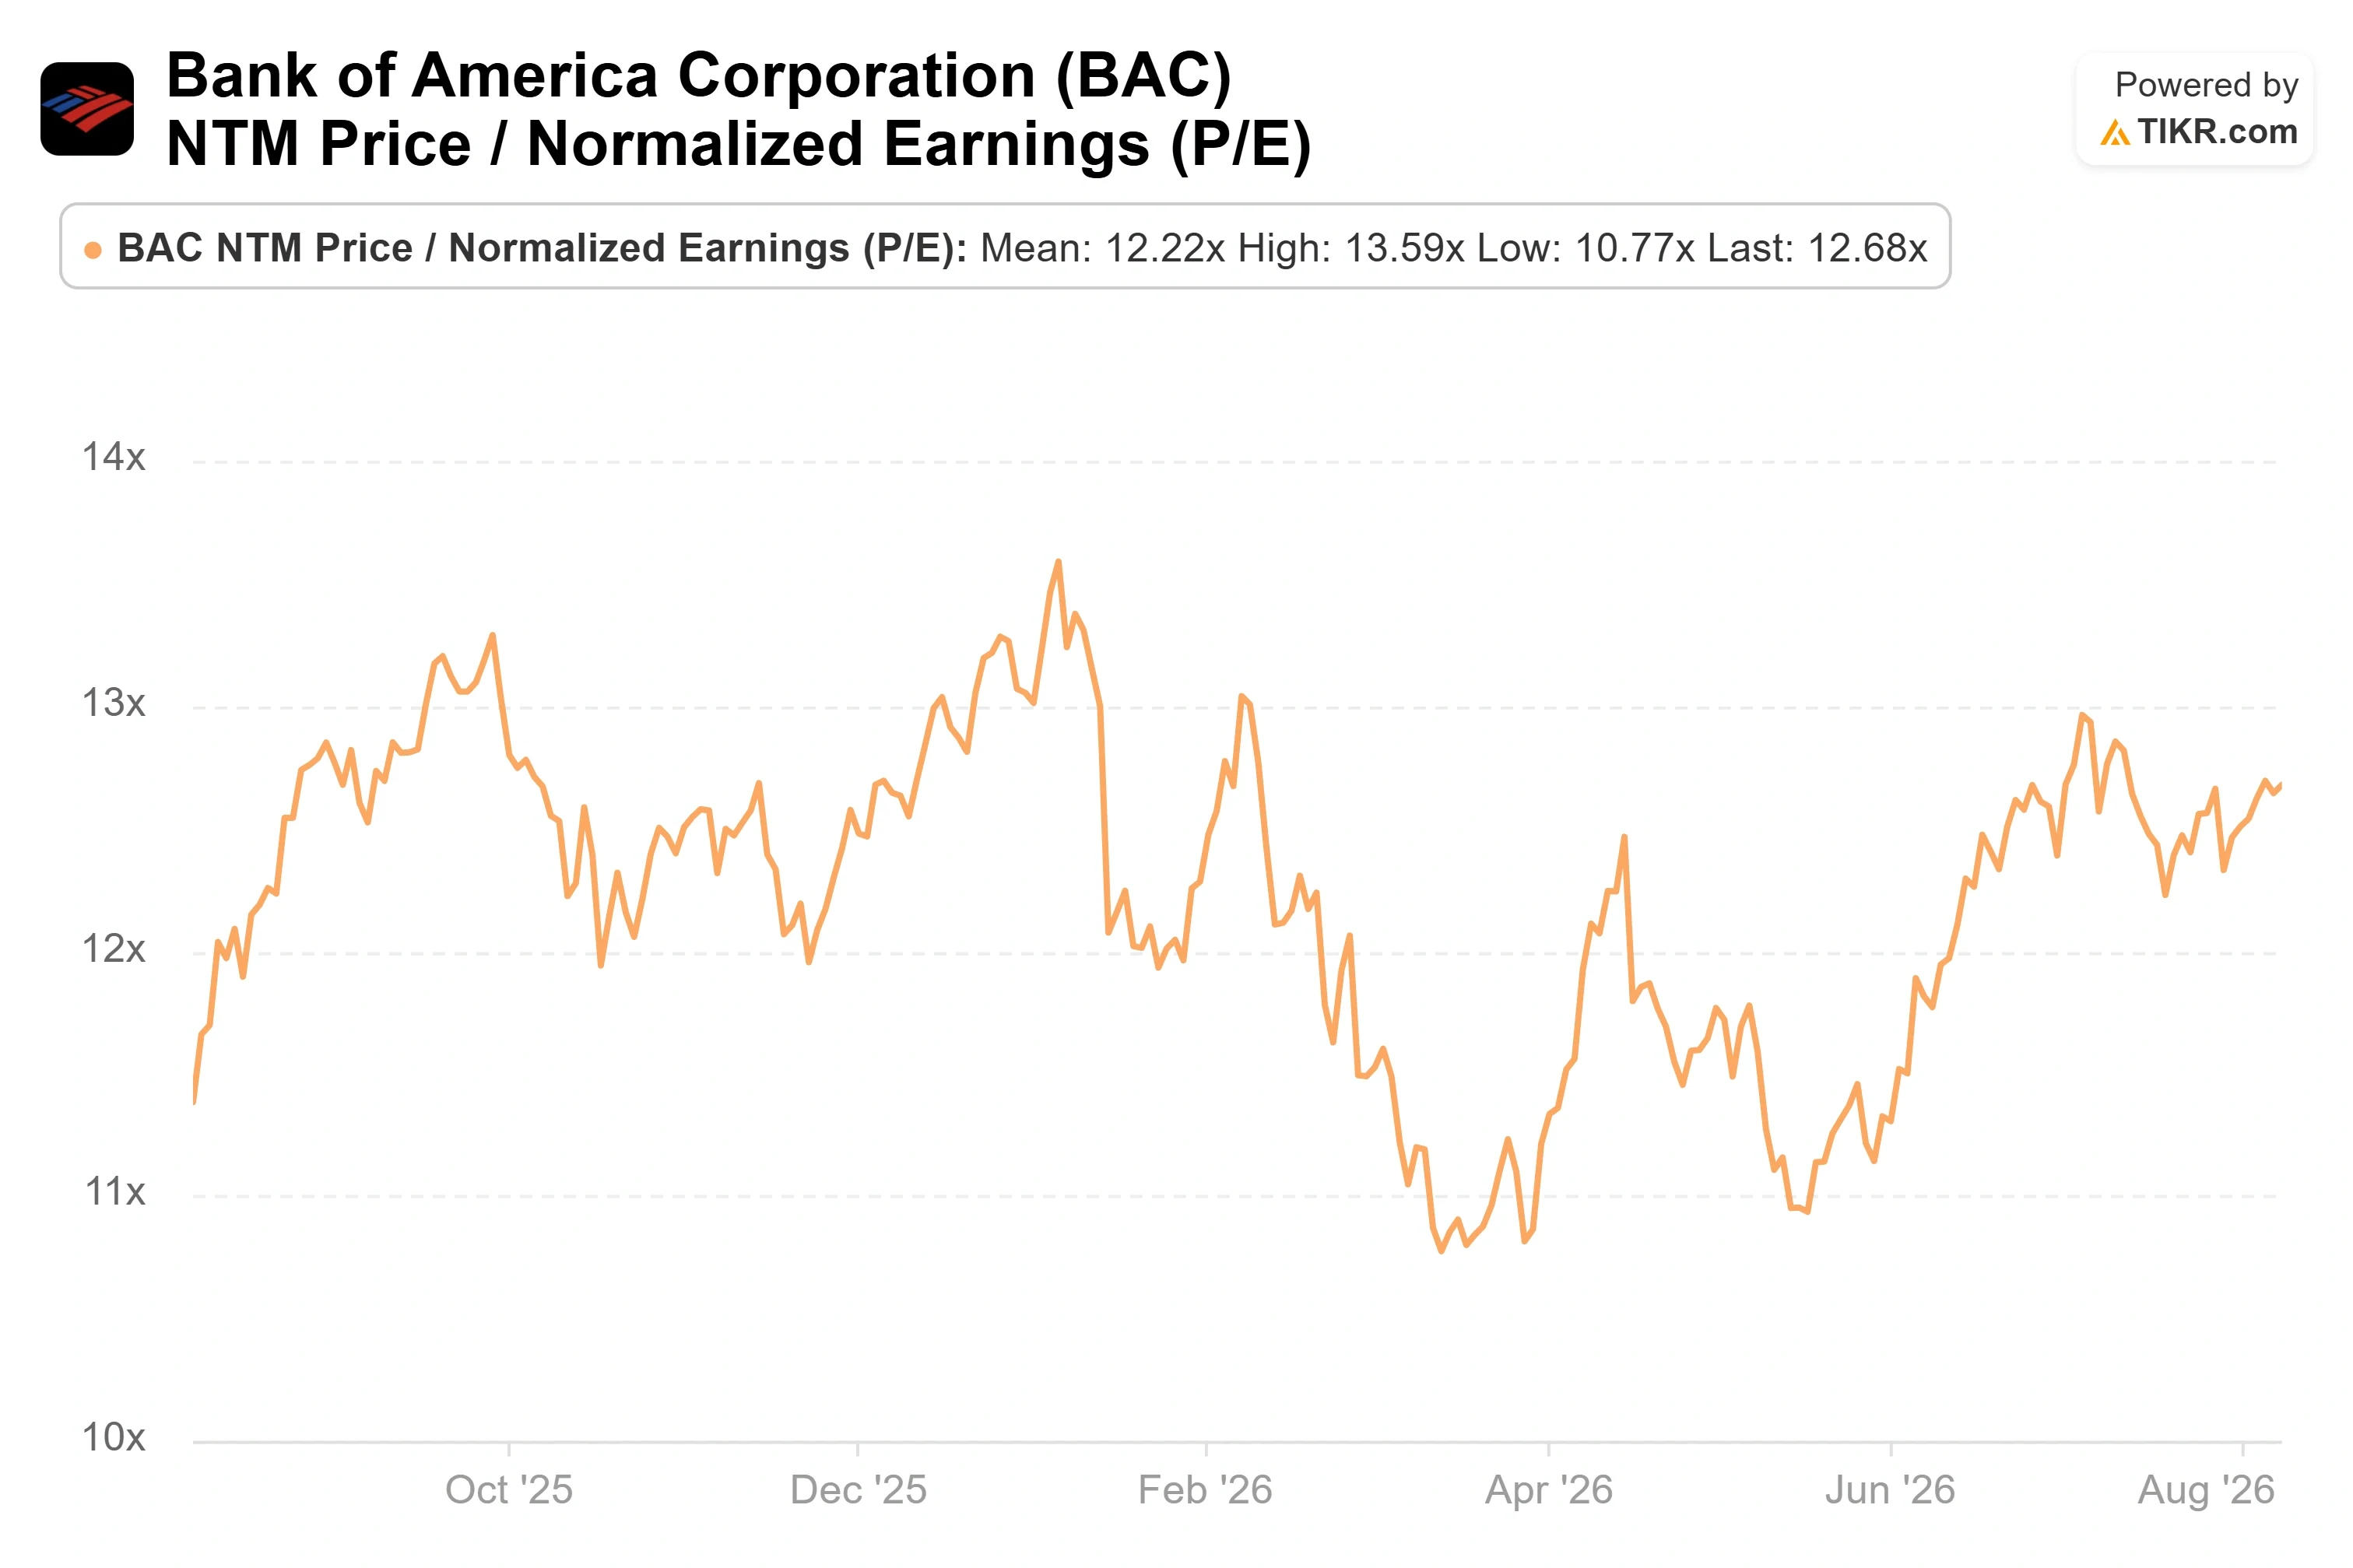
At $63.17, Bank of America trades at about 12.7 times next-twelve-month earnings and roughly 2.1 times tangible book value. Those are not stretched multiples in the abstract, but they sit at the high end of where this bank has traded in recent years, and the stock has re-rated faster than its earnings estimates have moved.
That is the observation behind the Oppenheimer call. Analyst Chris Kotowski argued that large banks have moved from years of structural undervaluation to valuations that now price in optimism about sustained earnings growth, leaving little room for error if a fear cycle returns. He recommended rotating toward super-regional banks with more expansion potential. It is a valuation call, not a business call, and that distinction is the whole point for a buyer here.
Bank of America trades at 12.68 times forward earnings, against JPMorgan at 14.81 times, and above Wells Fargo at 11.74. The stock is no longer visibly cheap against its closest competitors, and its 17% return on tangible common equity, while strong, no longer comes at a discount price. The valuation gap that powered the last leg of the rally has largely closed. Not everyone reads it Oppenheimer’s way: UBS raised its target to $70 in early August and kept a Buy, and Barclays carries a $72 target. Against those, the Street’s mean of around $69 implies roughly 9% upside, and a split of 15 Buys, 5 Outperforms, and 4 Holds points to a stock the Street likes but no longer sees as deeply mispriced.
See how Bank of America performs against its peers in TIKR (It’s free!) >>>
TIKR Advanced Model Analysis
- Current Price: $63.17
- Target Price (Mid): ~$78
- Potential Total Return: ~24%
- Annualized IRR: ~5% / year

See analysts’ growth forecasts and price targets for Bank of America stock (It’s free!) >>>
The two revenue drivers are broad-based commercial loan growth near 8% and continued fee income from wealth management, markets, and investment banking. The margin driver is net interest income repricing toward management’s 2.30% net interest margin goal, which supports a modeled net income margin near 28%. The primary risk runs the other way: if the trading and investment banking strength that defined this quarter normalizes, the fee base that justified the re-rating softens, and a multiple near the top of its range has little room to expand.
The upside is that earnings and book value keep compounding, capital keeps flowing back to shareholders, and the stock advances on execution. The downside is Oppenheimer’s: a cyclical business near the top of its valuation range meets an ordinary slowdown, and a buyer at $63 waits years to break even.
Conclusion
The next real test is the third-quarter report on October 14. The bar is specific: full-year NII growth at the top of the 6% to 8% range, and operating leverage inside the raised 300 to 400 basis point band. The number that matters most is trading revenue. This quarter’s $7.2 billion set a high mark, and Borthwick flagged tougher second-half comparisons directly. Good looks like markets revenue holding near this quarter’s run rate with NII still climbing, which would make the current price look earned. Bad looks like a clear sequential markets decline and an NII guide walked back, which leaves the buyer at $63 holding the exact risk Oppenheimer named.
See what stocks billionaire investors are buying so you can follow the smart money with TIKR.
Should You Invest in Bank of America?
The only way to really know is to look at the numbers yourself. TIKR gives you free access to the same institutional-quality financial data that professional analysts use to answer exactly that question.
Pull up Bank of America, and you’ll see years of historical financials, what Wall Street analysts expect for revenue and earnings in the quarters ahead, how valuation multiples have moved over time, and whether price targets are trending up or down.
You can build a free watchlist to track Bank of America alongside every other stock on your radar. No credit card required. Just the data you need to decide for yourself.
Analyze Bank of America on TIKR Free →
Looking for New Opportunities?
- See what stocks billionaire investors are buying so you can follow the smart money.
- Analyze stocks in as little as 5 minutes with TIKR’s all-in-one, easy-to-use platform.
- The more rocks you overturn… the more opportunities you’ll uncover. Search 100K+ global stocks, global top investor holdings, and more with TIKR.
Disclaimer:
Please note that the articles on TIKR are not intended to serve as investment or financial advice from TIKR or our content team, nor are they recommendations to buy or sell any stocks. We create our content based on TIKR Terminal’s investment data and analysts’ estimates. Our analysis might not include recent company news or important updates. TIKR has no position in any stocks mentioned. Thank you for reading, and happy investing!


