
Key Takeaways:
- Record Quarter: Lam Research posted record revenue of $5.84 billion in Q1 2026, up 24% year-over-year, with its services business topping $2 billion for the first time.
- Price Projection: Based on current assumptions, LRCX stock could reach $482.14 by June 2028.
- Potential Gains: That target implies a total return of 17.3% from the current price of $410.91.
- Annual Return: Investors could see roughly 8.3% annualized growth over the next 2 years.
Now Live: Discover how much upside your favorite stocks could have using TIKR’s new Valuation Model (It’s free)>>>
Lam Research (LRCX) makes the machines that chipmakers use to etch and deposit material onto silicon wafers. It’s a business that depends entirely on how much chip companies are spending on new factories. Right now, that spending is accelerating fast.
- Revenue grew 24% year-over-year in the March quarter to $5.84 billion, a third straight record.
- Gross margin came in at 49.9%, and
- operating margin hit 35%, both at the high end of guidance.
- Earnings per share of $1.47 beat expectations.
- CEO Tim Archer raised the company’s estimate of total industry equipment spending for 2026 to $140 billion, up from an earlier estimate of $135 billion, with potential for further increases.
That’s not a small revision. It reflects real demand from AI chipmakers who need more advanced memory and logic chips, built using increasingly complex manufacturing processes that require more of Lam’s tools per wafer.
See analysts’ full growth forecasts and estimates for LRCX stock (It’s free) >>>
What the Model Says for Lam Research Stock
We analyzed Lam Research through its position at the center of an AI-driven semiconductor manufacturing upgrade cycle.
The clearest growth driver is memory. AI data centers need more advanced NAND and DRAM chips, and existing factories can’t easily produce them.
Management says roughly $40 billion will be spent converting existing NAND factories to handle chips with more than 200 layers, with most of that spending now expected before the end of 2027 rather than spread out over many more years.
DRAM is undergoing a similar shift, as chipmakers move to a new generation of memory design that requires different deposition technology — an area where Lam already holds the leading position.
The second driver is the company’s services business, which just posted its first-ever $2 billion quarter. As chip factories run at very high utilization to keep up with demand, they need more spare parts, upgrades, and maintenance — all of which flows through Lam’s high-margin service operations.
A smaller but fast-growing piece is advanced packaging, where chips are stacked and connected in increasingly sophisticated ways. Lam expects that business to grow more than 50% in 2026.
Using a forecast of 25.2% annual revenue growth and 37.4% operating margins, with an exit P/E of 38.8x, our model projects LRCX reaching $482.14 by June 2028. That’s a 17.3% total return, or 8.3% annualized.
The 38.8x P/E assumption sits below LRCX’s current NTM multiple of 54.6x but above its one-year average of 34.2x. The higher multiple reflects the unusually strong growth environment, though it leaves less room for error if industry spending slows.
Our Valuation Assumptions

Estimate a company’s fair value instantly (Free with TIKR) >>>
Our Valuation Assumptions
TIKR’s Valuation Model lets you plug in your own assumptions for a company’s revenue growth, operating margins, and P/E multiple, and calculates the stock’s expected returns.
Here’s what we used for LRCX stock:
1. Revenue Growth: 25.2%
Lam grew revenue by 23.7% over the past year after a rough stretch in which revenue remained flat or declined over the prior three years.
The 25.2% assumption reflects continued strength as memory conversion spending accelerates and foundry customers keep investing at the leading edge.
Management’s own commentary suggests 2027 should be another strong growth year.
2. Operating margins: 37.4%
Trailing operating margins are 32.3%, already above the five-year average of 27.1%.
The 37.4% assumption reflects continued gains from manufacturing efficiency and a favorable shift toward higher-margin services and advanced technology sales.
Management guided to a June quarter operating margin of 36.5%, so this assumption is only modestly above the current run rate.
3. Exit P/E Multiple: 38.8x
LRCX currently trades at 54.6x forward earnings.
The model assumes meaningful compression to 38.8x, reflecting the expectation that today’s exceptionally high multiple won’t persist once growth normalizes from these elevated levels.
Build your own Valuation Model to value any stock (It’s free!) >>>
What Happens If Things Go Better or Worse?
Here’s how LRCX stock could perform under different scenarios by June 2030:
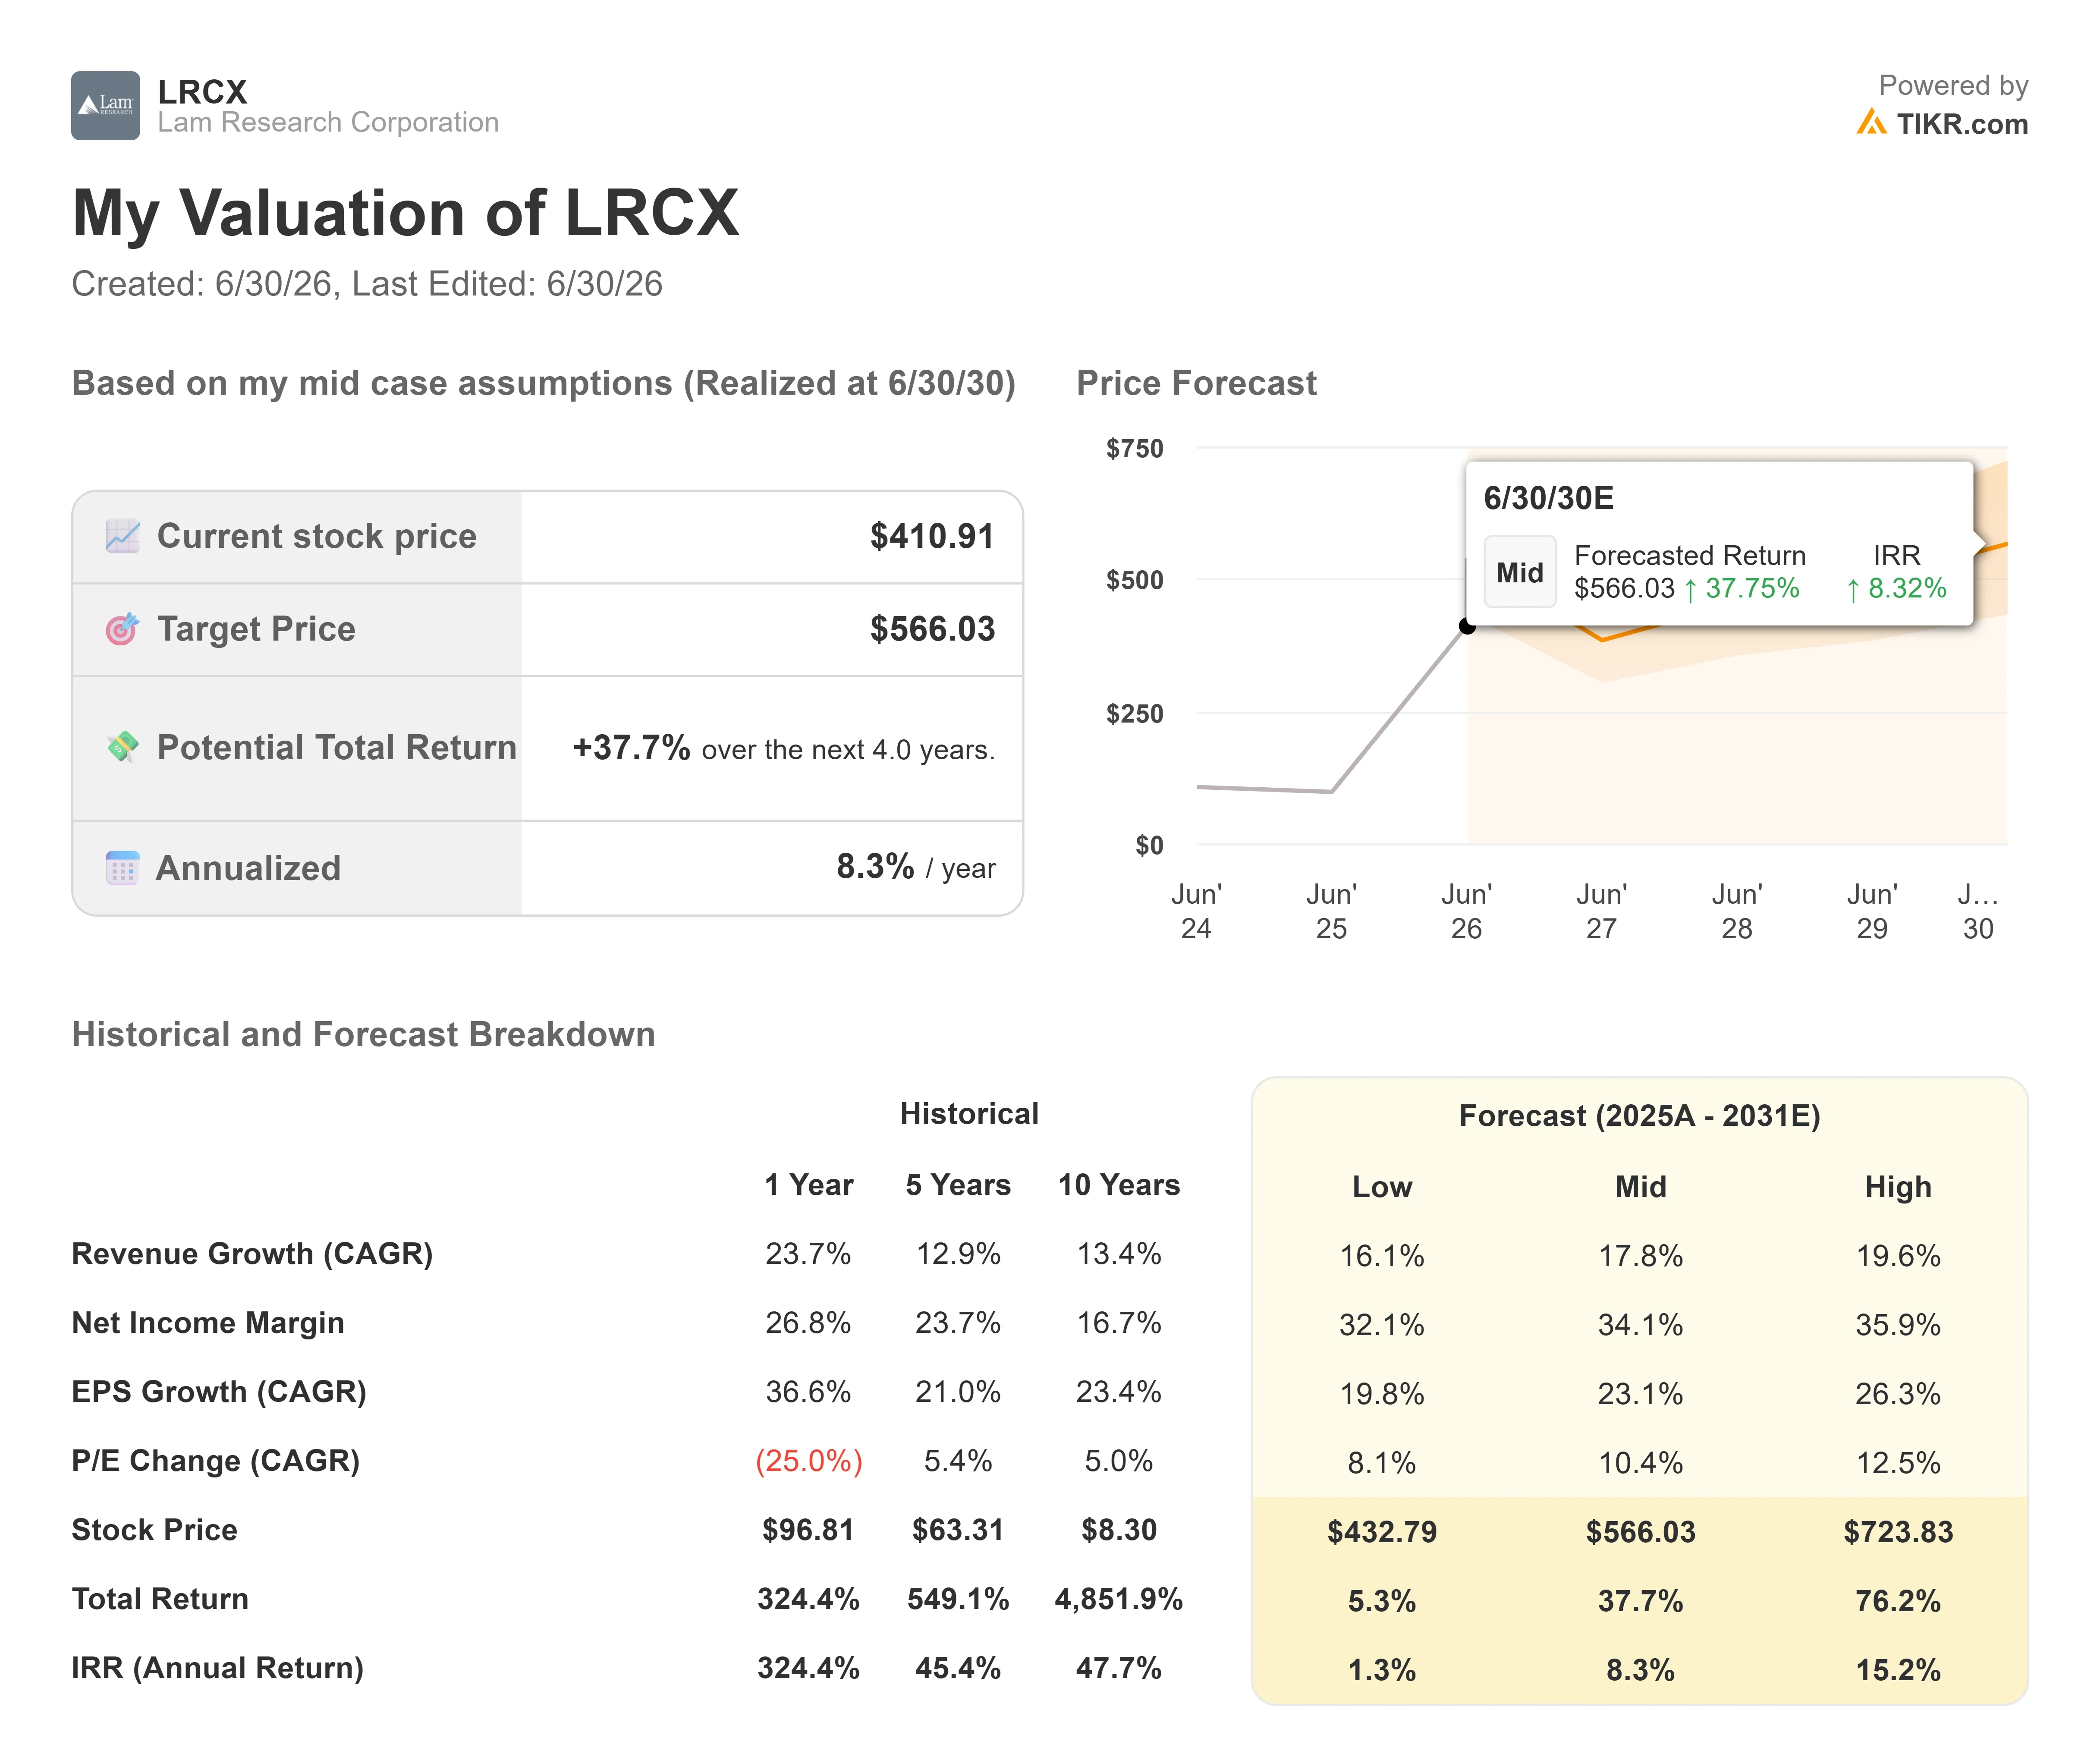
- Low Case: With revenue growing at 16.1% and net income margins of 32.1%, investors could see a total return of 5.3% (1.3% annually).
- Mid Case: At 17.8% revenue growth and 34.1% net income margins, the total return climbs to 37.7% (8.3% annually).
- High Case: If revenue grows at 19.6% and margins reach 35.9%, total returns could hit 76.2% (15.2% annually).
See what analysts think about LRCX stock right now (Free with TIKR) >>>
The spread is wide because so much depends on the pace of memory conversion spending and whether 2027 demand materializes as management currently expects.
A slowdown in AI infrastructure investment would hit the low case; sustained or accelerating chip demand supports the high end.
How Much Upside Does Lam Research Stock Have From Here?
With TIKR’s new Valuation Model tool, you can estimate a stock’s potential share price in under a minute.
All it takes is three simple inputs:
- Revenue Growth
- Operating Margins
- Exit P/E Multiple
If you’re not sure what to enter, TIKR automatically fills in each input using analysts’ consensus estimates, giving you a quick, reliable starting point.
From there, TIKR calculates the potential share price and total returns under Bull, Base, and Bear scenarios so you can quickly see whether a stock looks undervalued or overvalued.
See a stock’s true value in under 60 seconds (Free with TIKR) >>>
Looking for New Opportunities?
- See what stocks billionaire investors are buying so you can follow the smart money.
- Analyze stocks in as little as 5 minutes with TIKR’s all-in-one, easy-to-use platform.
- The more rocks you overturn… the more opportunities you’ll uncover. Search 100K+ global stocks, global top investor holdings, and more with TIKR.
Disclaimer:
Please note that the articles on TIKR are not intended to serve as investment or financial advice from TIKR or our content team, nor are they recommendations to buy or sell any stocks. We create our content based on TIKR Terminal’s investment data and analysts’ estimates. Our analysis might not include recent company news or important updates. TIKR has no position in any stocks mentioned. Thank you for reading, and happy investing!


