Key Stats for INTC Stock
- Past-6-Month Performance: 88%
- 52-Week Range: $18 to $55
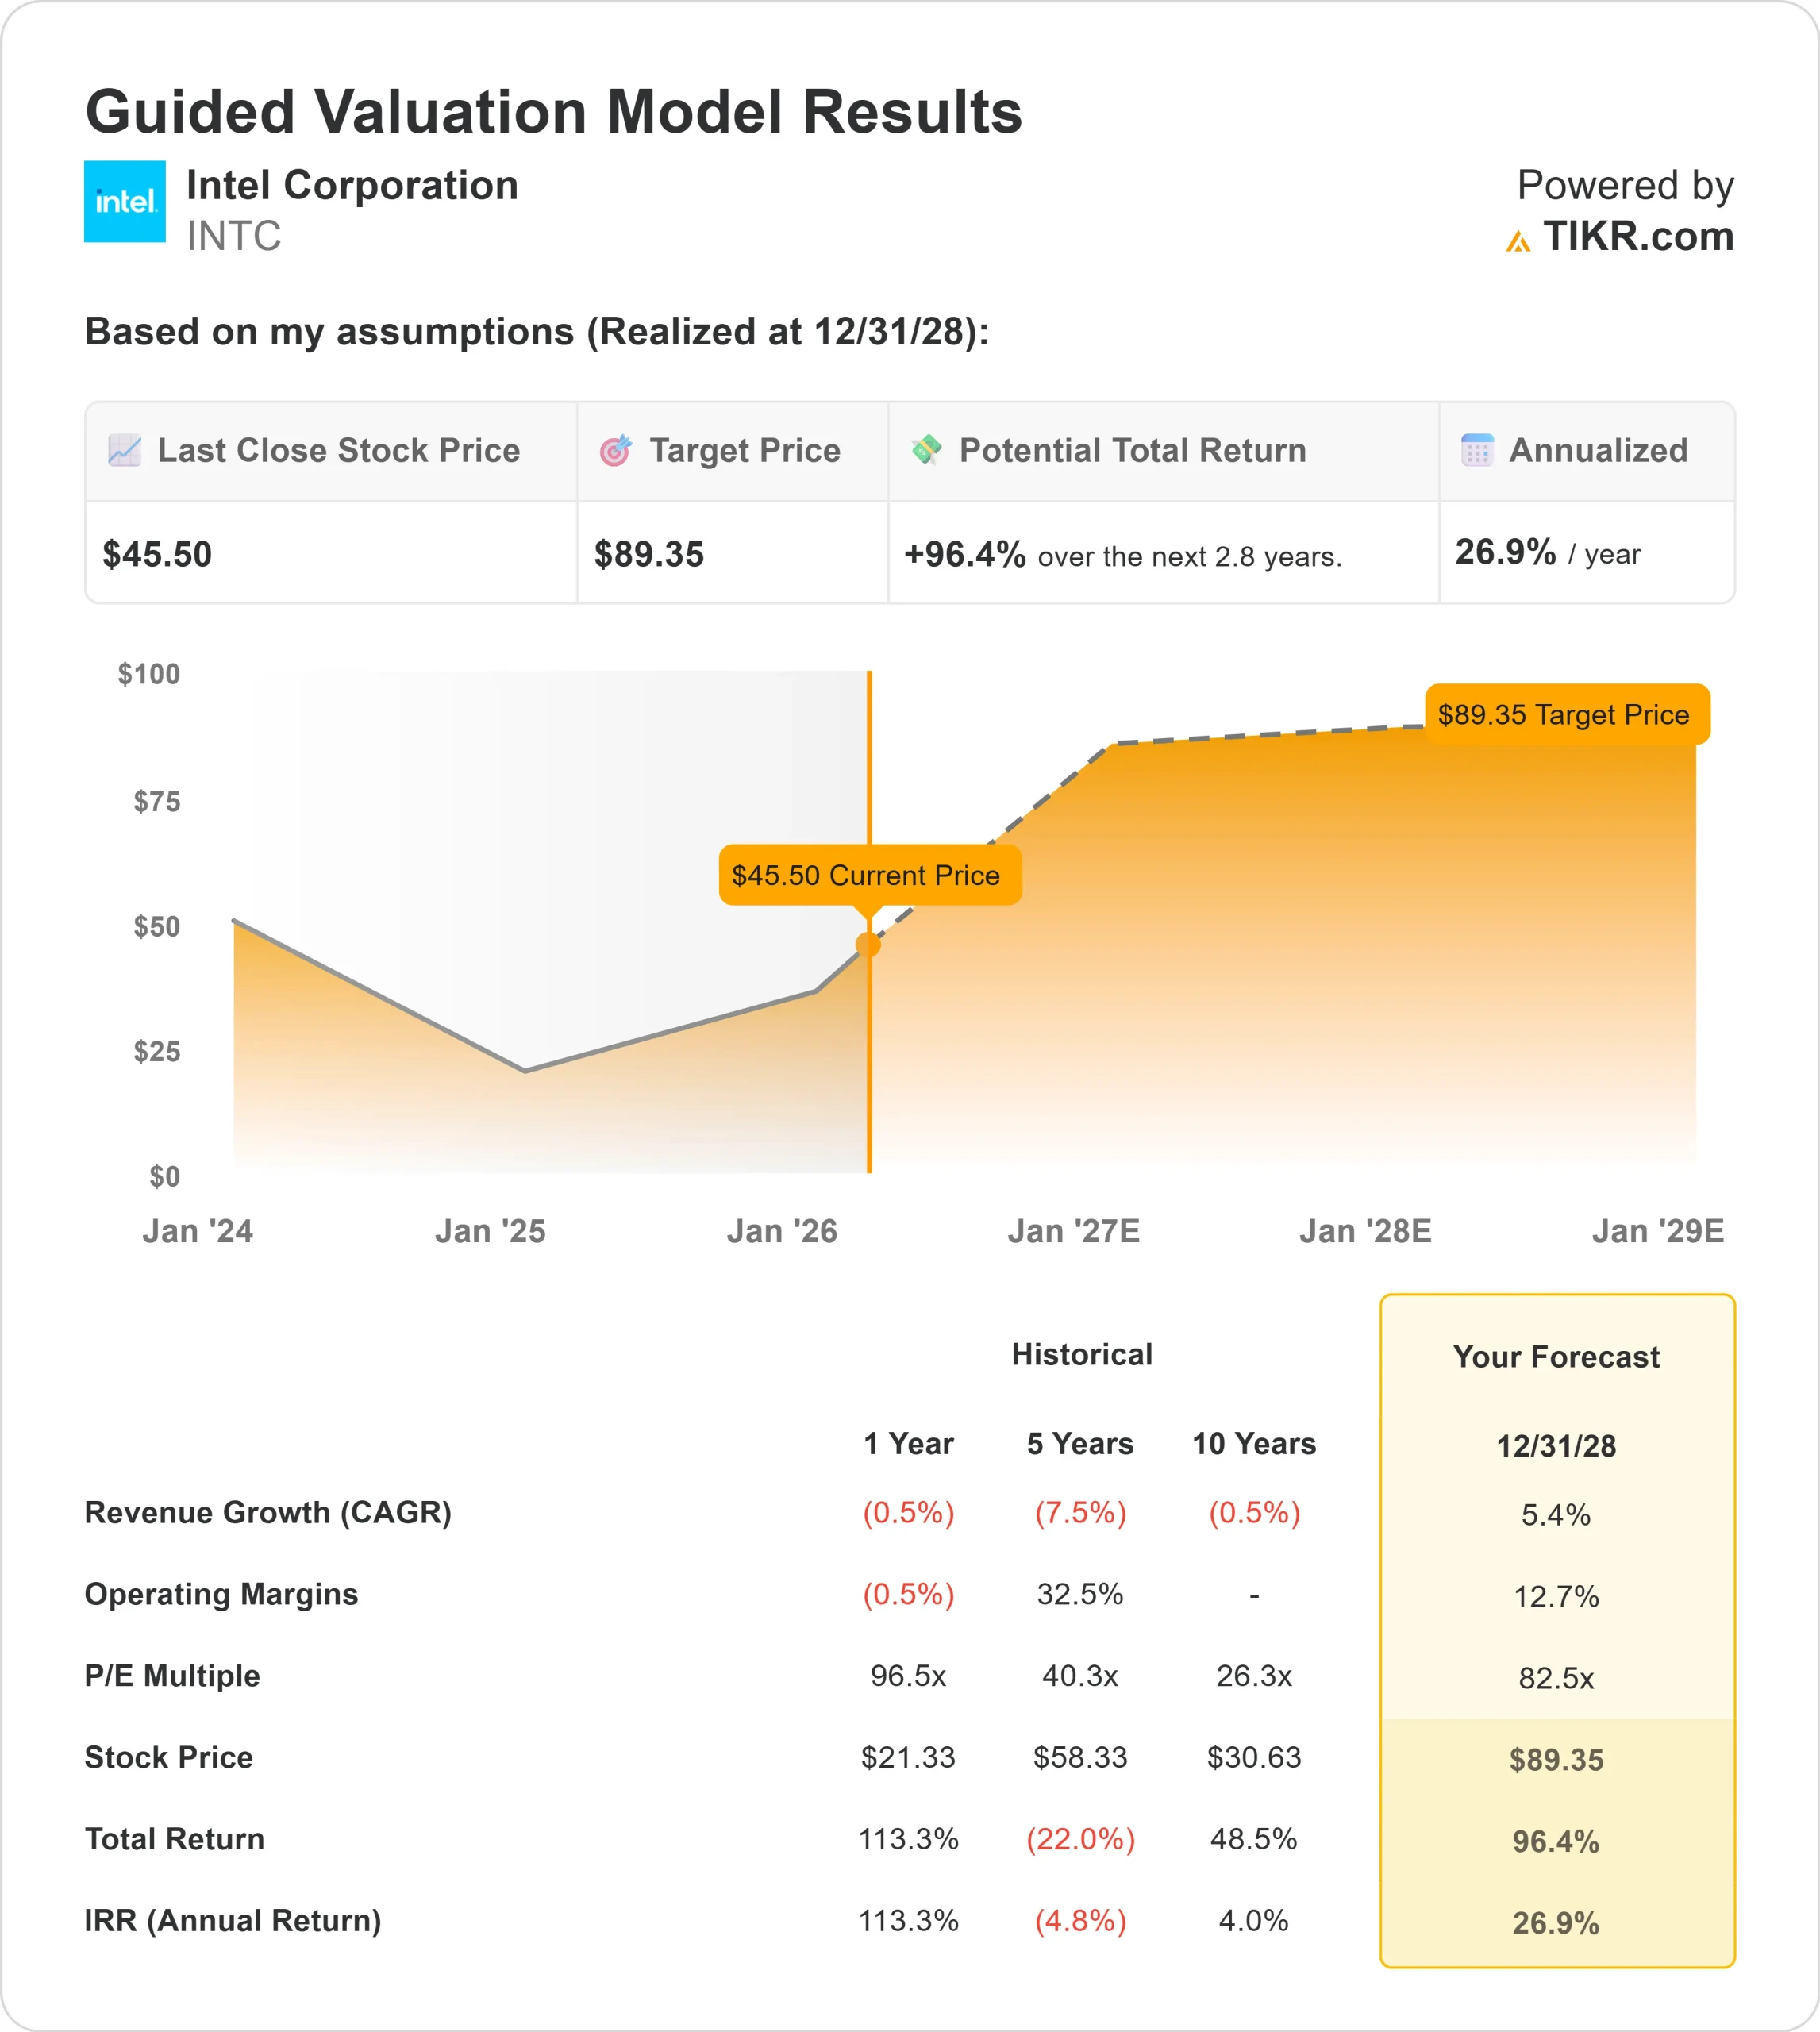
- Valuation Model Target Price: $89
- Implied Upside: 96.4%
Value your favorite stocks like Intel with 5 years of analysts’ forecasts using TIKR’s new Valuation Model (It’s free) >>>
What Happened?
Intel Corporation stock has climbed about 88% over the past six months, rising to roughly $46 per share as investors repriced the stock around improving foundry execution, stronger AI-related demand, and visible institutional accumulation.
Shares now sit within their $18 to $55 52-week range, reflecting a dramatic recovery from last year’s lows as confidence in Intel’s turnaround has strengthened.
The rally has been driven by growing belief that Intel’s manufacturing roadmap is stabilizing and that AI compute demand is translating into real production requirements.
With margins still depressed but showing operational improvement, investors have been willing to look through near-term earnings softness in anticipation of stronger operating leverage in 2026.
Recent 13F filings reinforced that positioning shift. APG Asset Management increased its stake by 51.1% to 3,677,815 shares worth about $123.4 million, Allianz SE raised its position by 68.6% to 160,025 shares valued at $5.37 million, and Clare Market Investments opened a new 45,748-share position worth about $1.54 million.
Telligent Fund LP initiated an 88,000-share stake valued at approximately $2.95 million, while Fox Run Management purchased 21,672 shares worth about $727,000.
At the same time, Rafferty Asset Management cut its stake by 25.7%, US Bancorp DE reduced its position by 15.3%, and Banco Santander trimmed its stake by 22.2%.
Institutional investors now own approximately 64.53% of Intel, underscoring that large funds remain deeply involved even as positions rotate.
This week at Intel’s AI Summit, CEO Lip-Bu Tan highlighted improving 18A yields of 7% to 8% per month and confirmed 14A remains on track for risk production in 2028 and volume production in 2029, while emphasizing that AI-driven compute demand is strong and that memory remains a key constraint with “no relief until 2028.”
Customer engagement on 0.5 PDK test chips and expected volume commitments in the second half of this year reinforce expectations for continued execution progress throughout 2026.
See analysts’ growth forecasts and price targets for Intel (It’s free) >>>
Is INTC Undervalued?
Under valuation assumptions, the stock is modeled using:
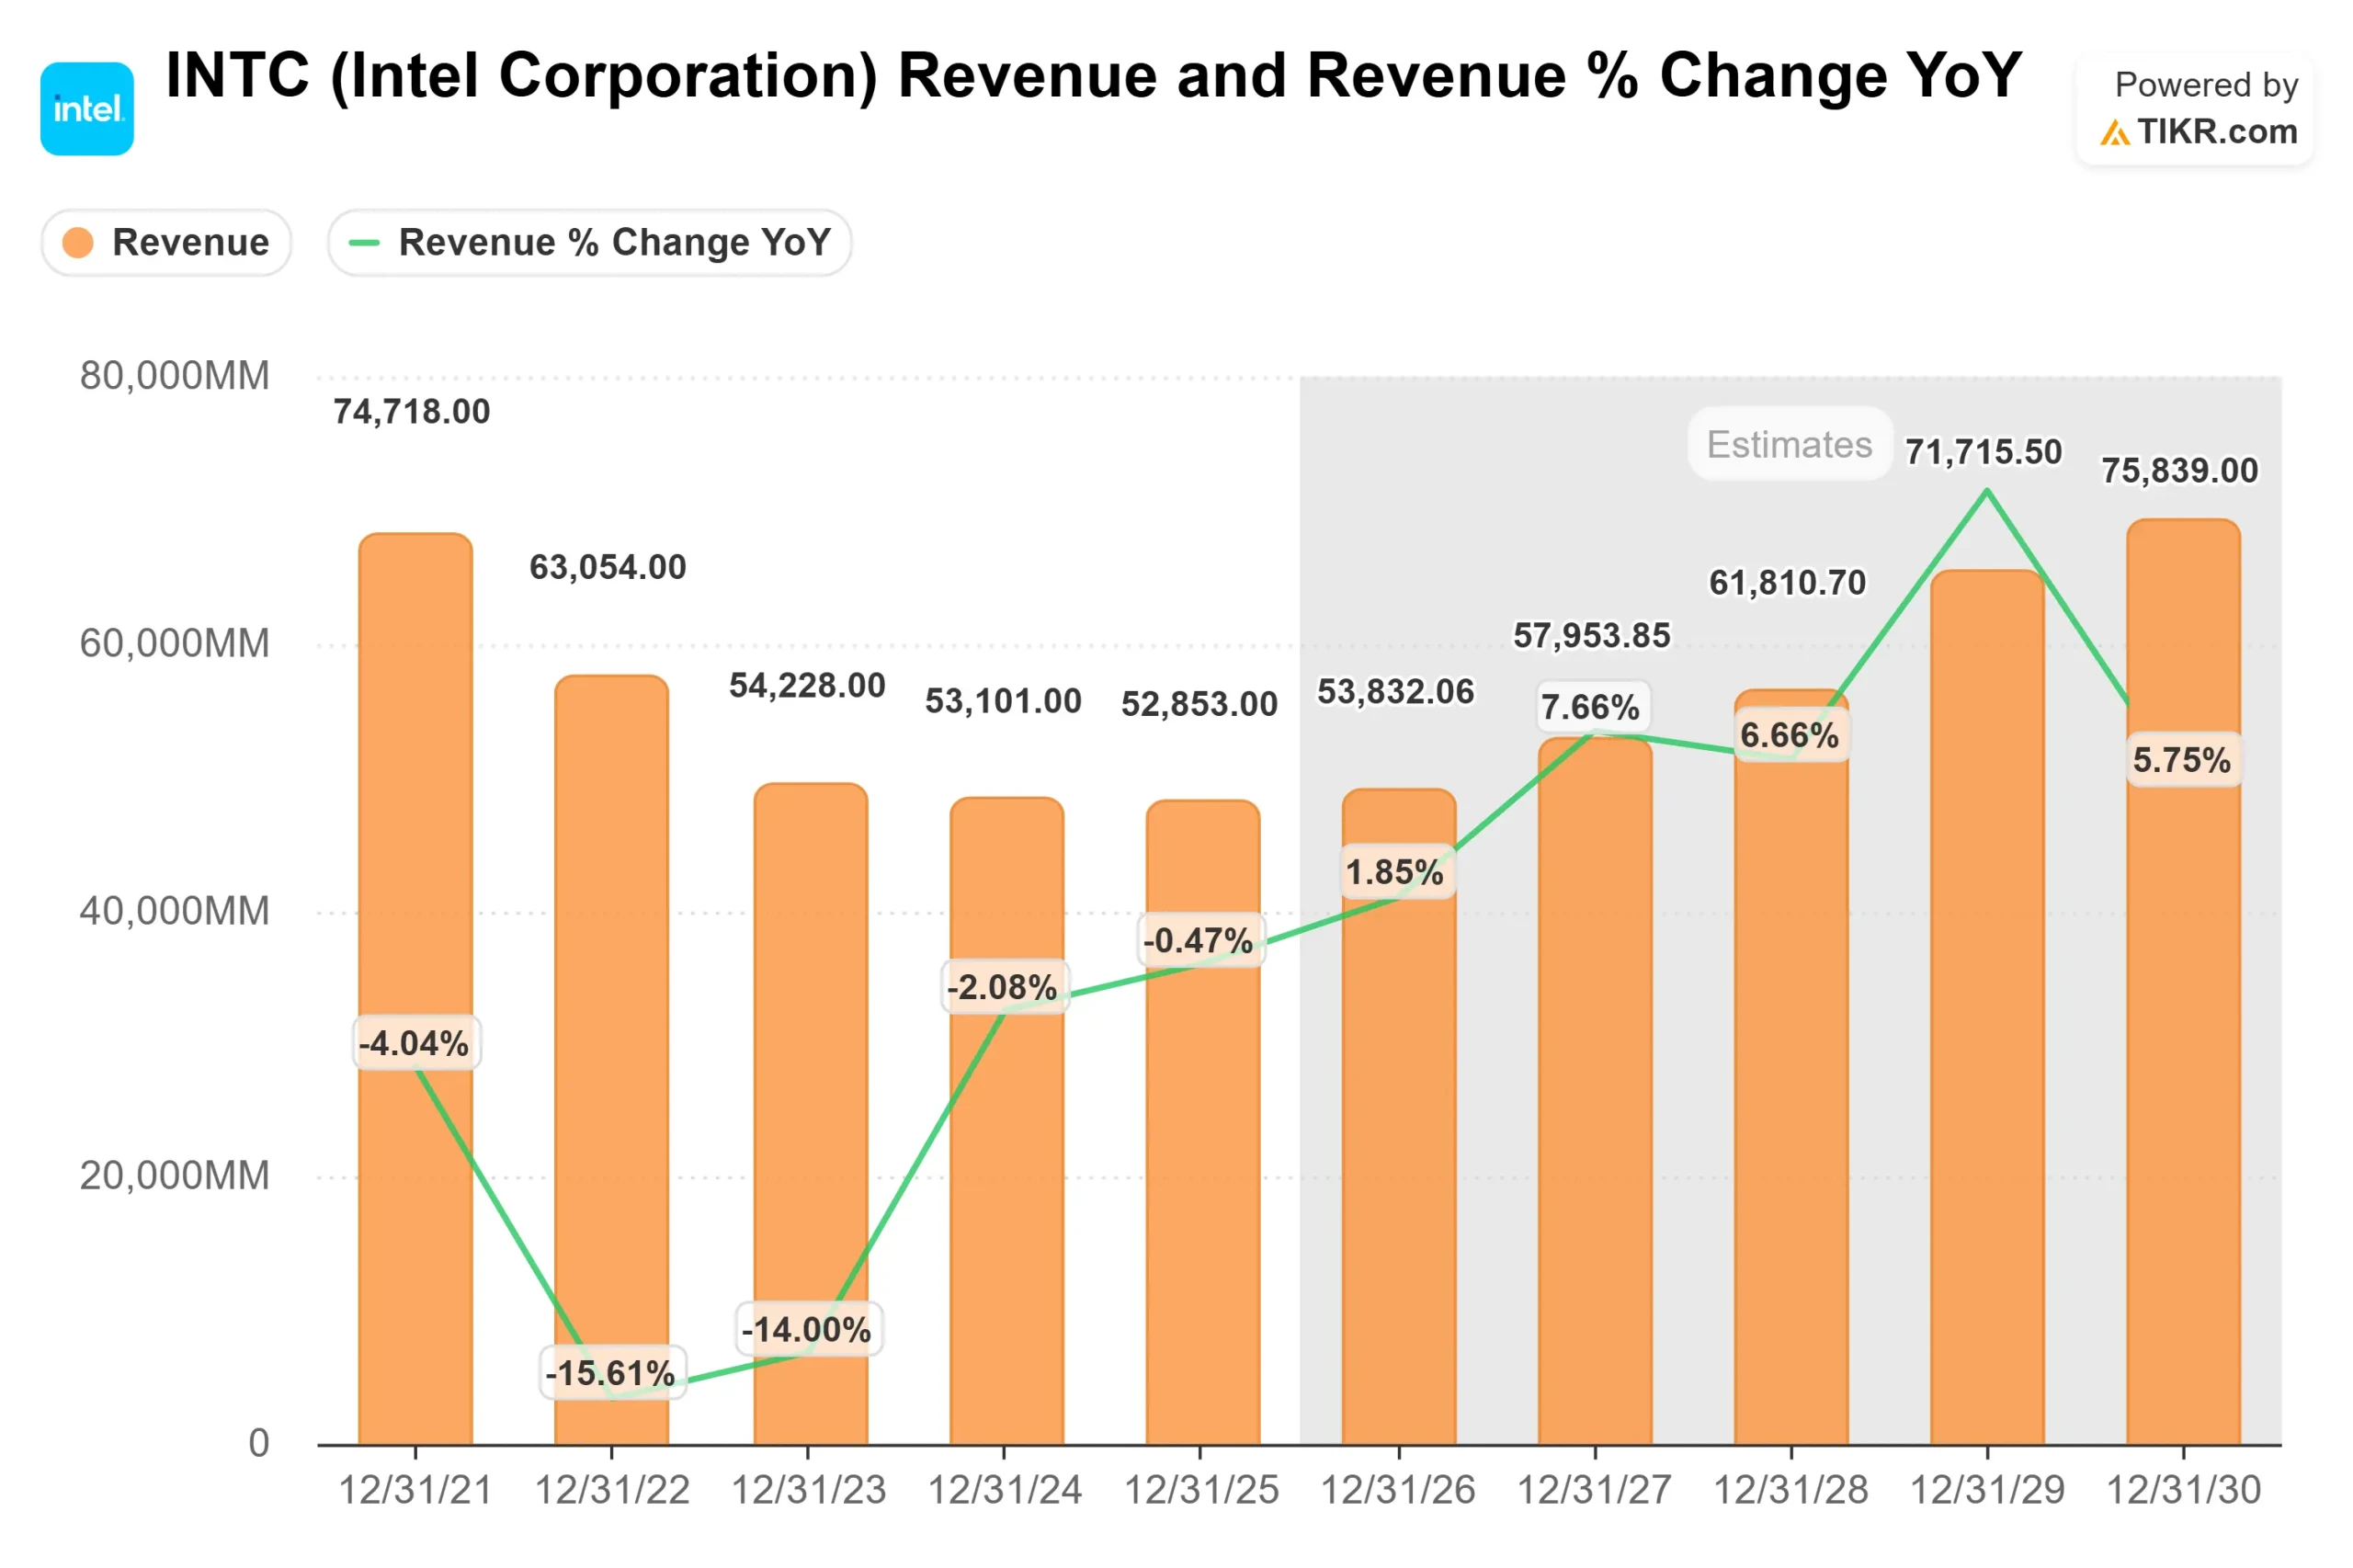
- Revenue Growth (CAGR): 5.4%
- Operating Margins: 12.7%
- Exit P/E Multiple: 82.5x
Revenue growth assumptions reflect stabilizing PC demand, gradual data center recovery, and incremental AI-related silicon contribution.
The 12.7% operating margin assumption implies significant improvement from the current 1.8% LTM EBIT margin, requiring higher factory utilization, stronger mix in Data Center and AI, and sustained yield improvements on advanced nodes.
The most important variable in 2026 is whether Intel can convert improving 18A yields into meaningful volume production and secure foundry customer commitments that drive capacity utilization.
Scaling AI compute supply, expanding advanced packaging, and securing external wafer demand would directly improve fixed-cost absorption and lift gross margins.
At the same time, success in next-generation Xeon processors and competitive AI accelerators would strengthen average selling prices and restore confidence in Intel’s long-term data center position.
If those levers translate into mid-teens operating margins and consistent revenue growth, earnings power would look structurally different from the past two years.
Based on these inputs, the model estimates a target price of $89.35, implying 96.4% upside from current levels.
At roughly $46 per share, Intel appears undervalued, with future performance tied to AI competitiveness, foundry scaling, and durable margin recovery in 2026.
Estimate a company’s fair value instantly (Free with TIKR) >>>
How Much Upside Does INTC Stock Have From Here?
Investors can estimate Intel potential share price, or what any stock could be worth, in under a minute using TIKR’s New Valuation Model tool.
All it takes is three simple inputs:
- Revenue Growth
- Operating Margins
- Exit P/E Multiple
From there, TIKR calculates the potential share price and total returns under Bull, Base, and Bear scenarios so you can quickly see whether a stock looks undervalued or overvalued.
If you’re not sure what to enter, TIKR automatically fills in each input using analysts’ consensus estimates, giving you a quick, reliable starting point.
See Intel true value, or any stock’s, in under 60 seconds (Free with TIKR) >>>