

Key Stats for IBM Stock
- This-Week Performance: 7%
- 52-Week Range: $215 to $325
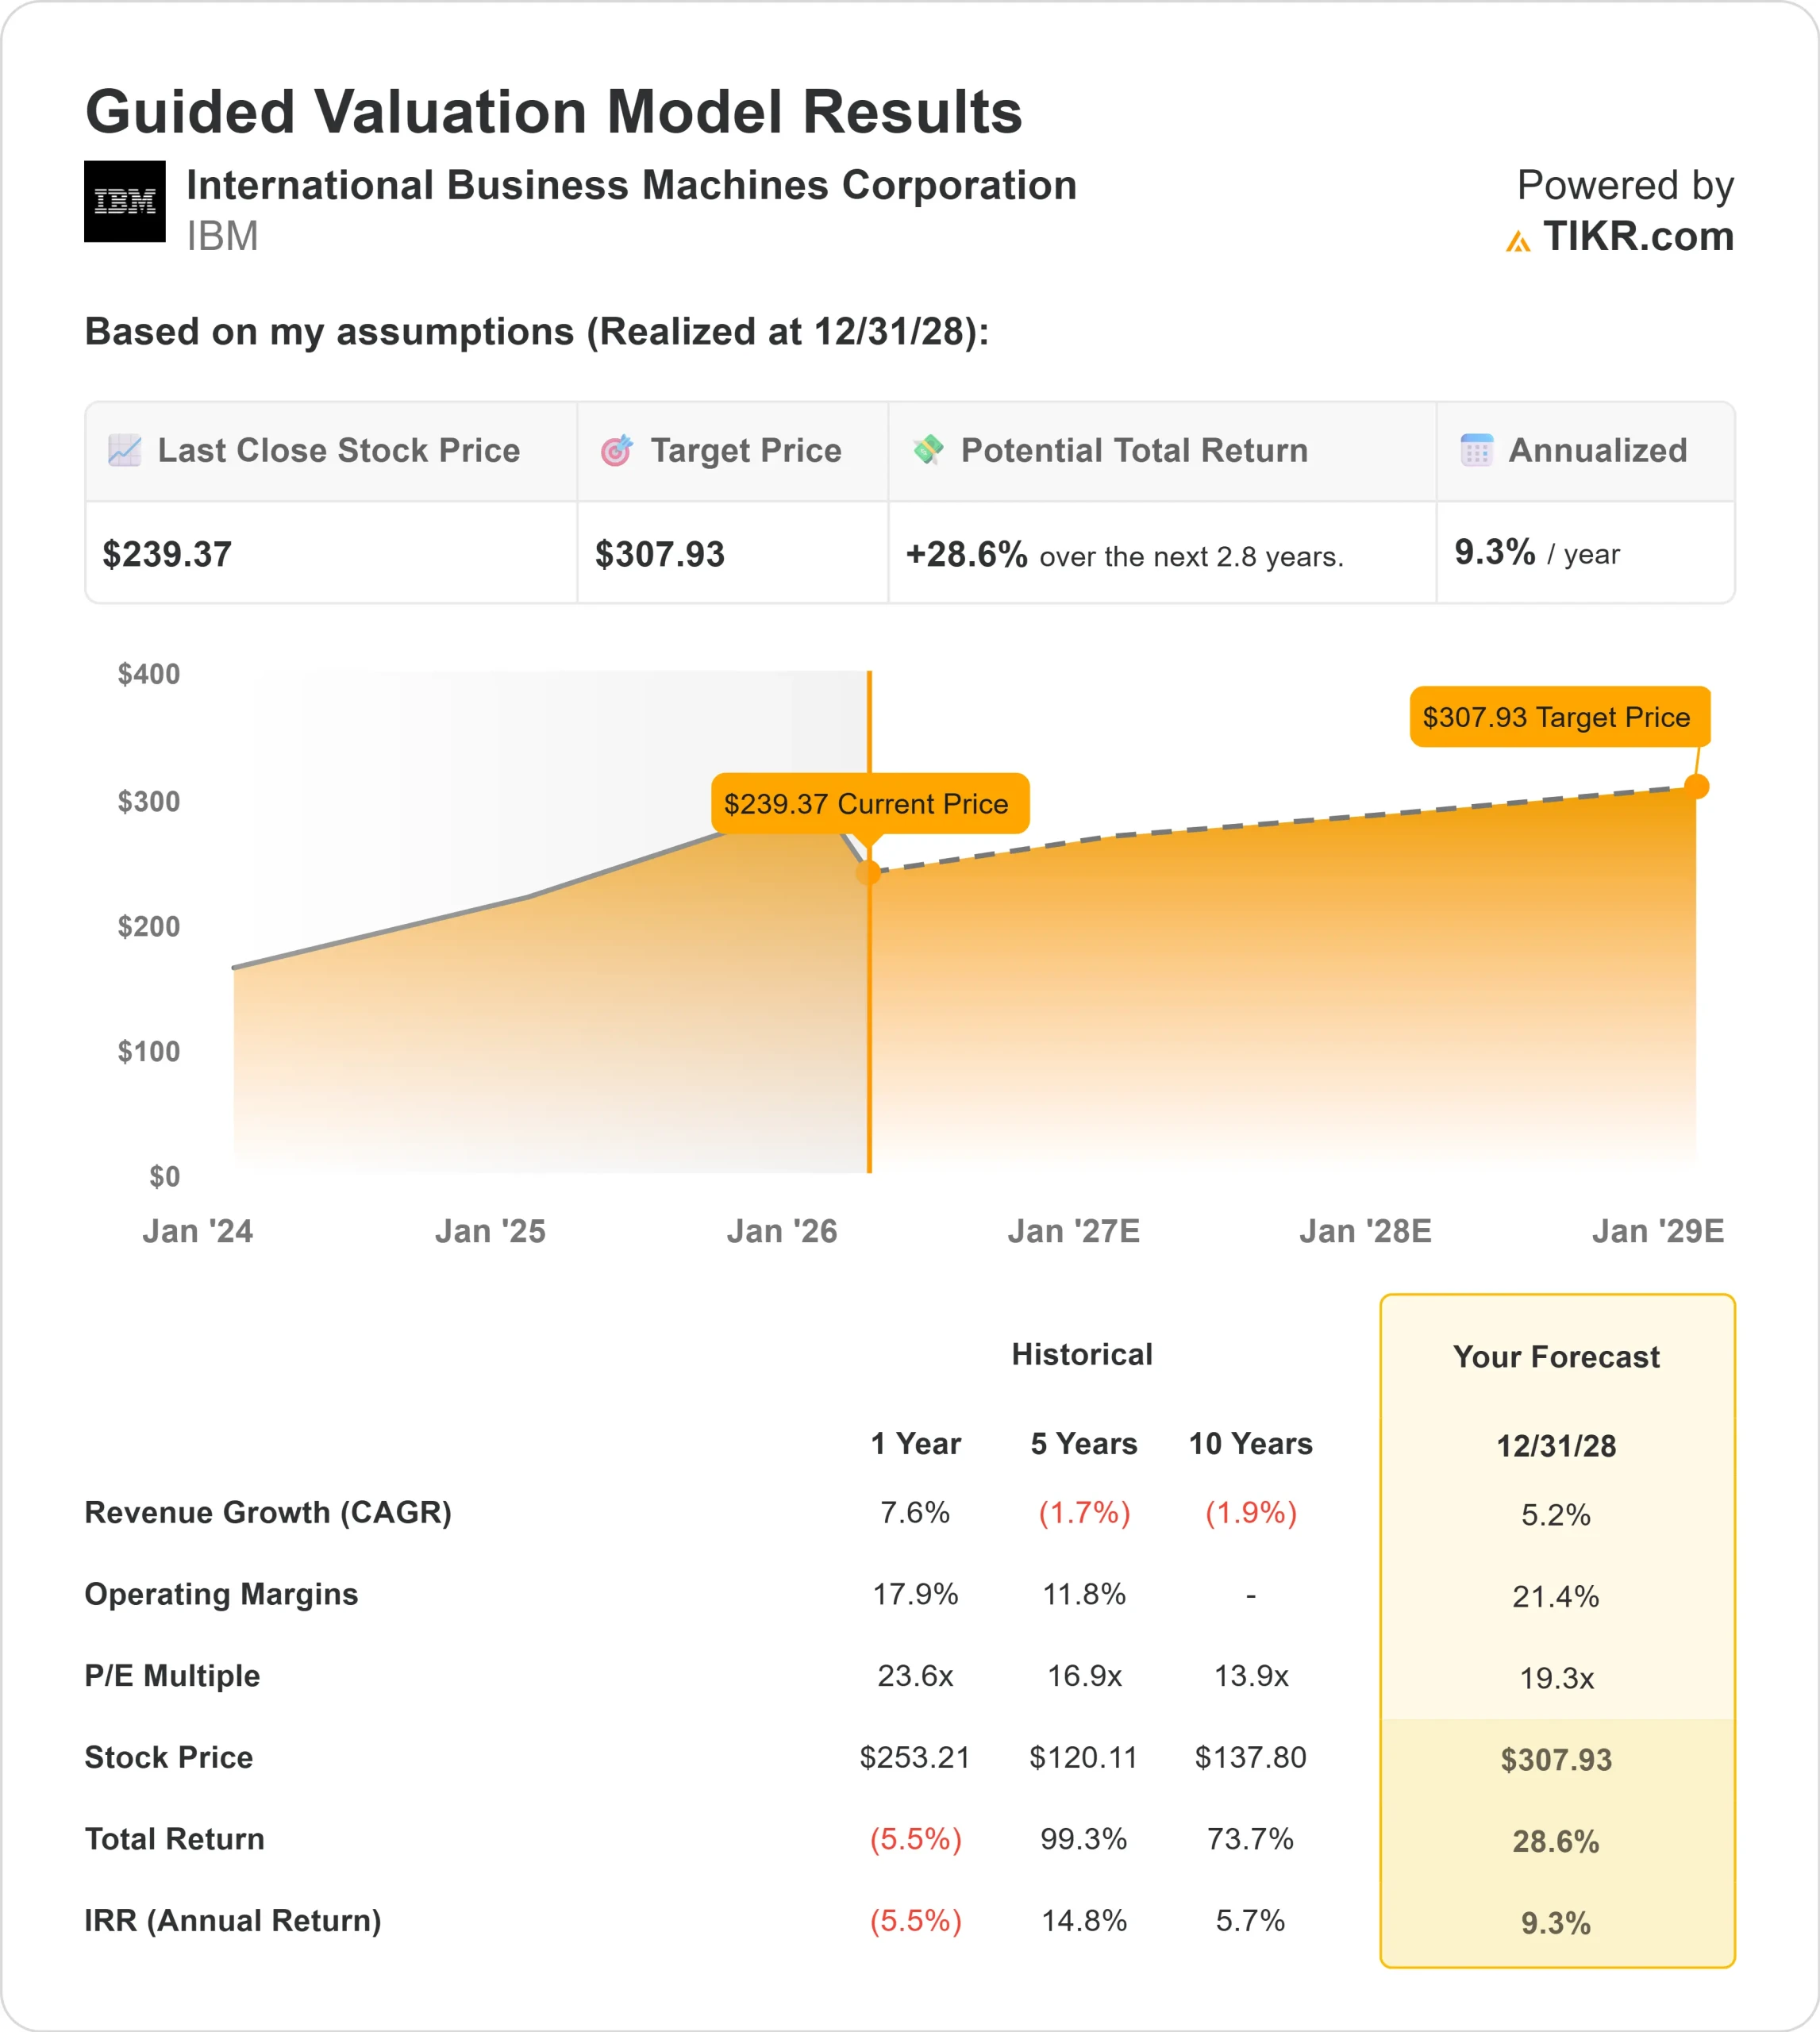
- Valuation Model Target Price: $308
- Implied Upside: 28.6%
Value your favorite stocks like International Business Machines with 5 years of analysts’ forecasts using TIKR’s new Valuation Model (It’s free) >>>
What Happened?
International Business Machines Corporation stock rose about 7% this week, finishing near $239 per share as investors reacted to stronger-than-expected fourth quarter results and confident 2026 guidance.
The move pushed shares higher within their $215 to $325 52-week range and reflected renewed confidence in IBM’s software-led growth and AI momentum.
The stock climbed specifically because IBM reported 9% revenue growth in the fourth quarter, its strongest pace in over three years, alongside 11% Software growth and 17% Infrastructure growth.
IBM Z revenue surged 61% year over year, contributing to full-year revenue growth of 6% and free cash flow of $14.7 billion, up 16% and the highest level in over a decade.
Management also guided for 2026 constant currency revenue growth of 5% plus, about 10% Software growth, and roughly $15.7 billion in free cash flow.
CEO Arvind Krishna said the company entered 2026 “with momentum and confidence in our ability to sustain 5% plus revenue growth and grow free cash flow by about $1 billion.”
Institutional activity added to the bullish tone. Meridian Wealth Advisors raised its stake by 32.4% to 11,991 shares worth about $3.38 million, Creative Financial Designs increased its position by 54.7% to 6,539 shares valued near $1.845 million, and Mosaic Family Wealth Partners lifted its holdings by 370.3% to 6,824 shares worth roughly $1.91 million.
Allianz SE increased its stake by 6.4%, while DNB Asset Management boosted its position by 6.5% to 278,996 shares valued at about $78.72 million, signaling continued institutional accumulation.
Some firms trimmed exposure, including Ibex Wealth Advisors, which cut its stake by 62.8%, and Erste Asset Management, which reduced its position by 22.9%.
Even with selective profit-taking, institutional ownership remains near 58.96%, underscoring sustained large-investor participation as IBM enters 2026 with accelerating Software growth, record AI-related bookings above $12.5 billion, and expanding margins.
See analysts’ growth forecasts and price targets for International Business Machines (It’s free) >>>
Is IBM Undervalued?
Under valuation assumptions, the stock is modeled using:
- Revenue Growth (CAGR): 5.2%
- Operating Margins: 21.4%
- Exit P/E Multiple: 19.3x
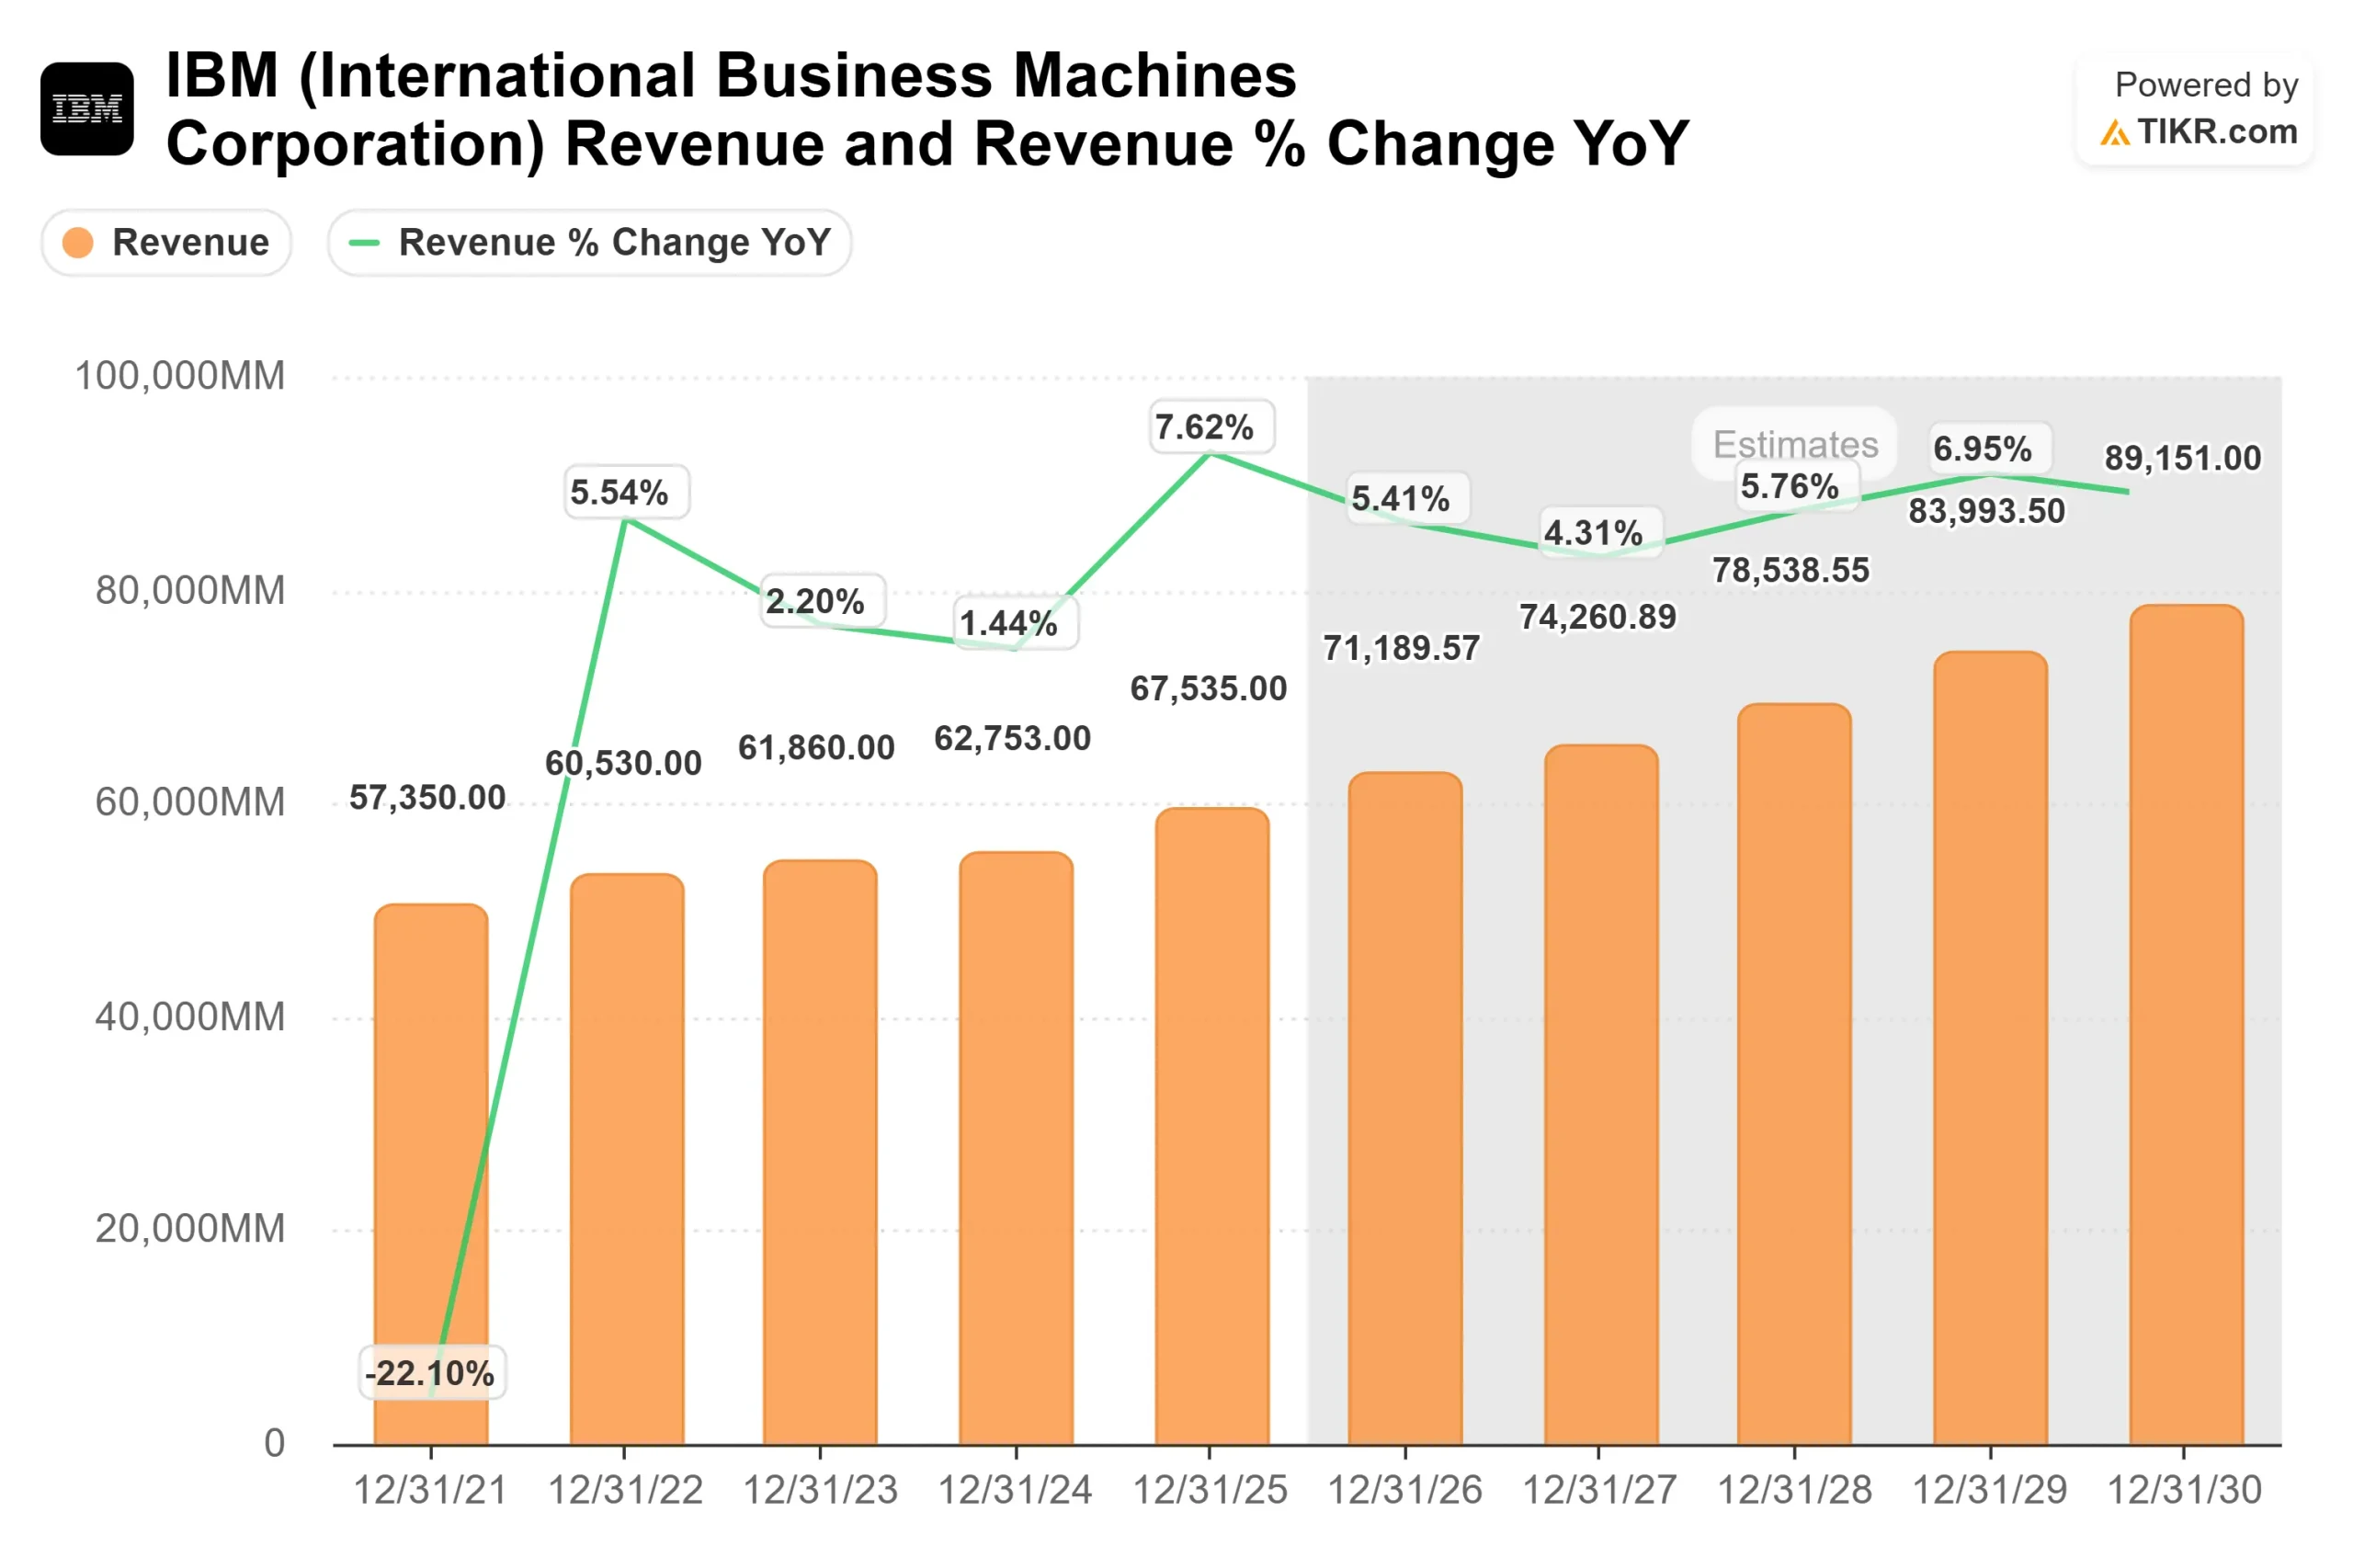
Revenue is projected to rise from $67,535 million in 2025 to $89,151 million by 2030, reflecting steady hybrid cloud expansion, AI software adoption, and consulting backlog conversion.
Software now represents about 45% of IBM’s business and grew 9% in 2025, its highest annual growth rate in history, with Data up 19% and Automation up 14% in the fourth quarter.
That mix shift toward higher-margin recurring software revenue supports operating margin expansion toward 21.4%.
The most important driver in 2026 is AI monetization across IBM’s installed base. The company exited 2025 with a cumulative GenAI book of business above $12.5 billion and expects Software to grow around 10% this year, driven by Data, Automation, and monetization of record z17 placements.
Consulting backlog stands at $32 billion with more than 25% tied to GenAI, supporting low to mid-single-digit growth and margin improvement.
Based on these inputs, the model estimates a target price of $307.93, implying 28.6% total upside over roughly 2.8 years, indicating the stock appears undervalued at current levels near $239.
At current levels, IBM appears undervalued, with future performance driven by AI commercialization, Software mix expansion, consulting backlog conversion, and sustained free cash flow growth rather than broad economic acceleration.
Estimate a company’s fair value instantly (Free with TIKR) >>>
How Much Upside Does IBM Stock Have From Here?
Investors can estimate International Business Machines potential share price, or what any stock could be worth, in under a minute using TIKR’s New Valuation Model tool.
All it takes is three simple inputs:
- Revenue Growth
- Operating Margins
- Exit P/E Multiple
From there, TIKR calculates the potential share price and total returns under Bull, Base, and Bear scenarios so you can quickly see whether a stock looks undervalued or overvalued.
If you’re not sure what to enter, TIKR automatically fills in each input using analysts’ consensus estimates, giving you a quick, reliable starting point.


