

When you own a stock, one of the most helpful questions you can ask is what the people closest to the business are doing with their own shares. Executives, directors, founders, and major institutions do not act on guesses. They act on what they understand about the company’s direction, pipeline, risks, and long-term potential. When they buy more shares, that usually reflects confidence. When they sell, that can raise questions. Watching those moves gives you context you cannot get from headlines alone.
For individual investors, this information is powerful because it shows real behavior, not commentary. You are not reading opinions from analysts or noise from social media. You are looking at what people with access to deeper visibility choose to do with their own money. The goal is not to predict the future. The goal is to understand sentiment, alignment, and conviction from the people who know the most.
The difficult part is figuring out which transactions matter. Executives sell shares for many reasons that have nothing to do with business performance. Fund managers rebalance portfolios as market conditions change. A single Form 4 filing tells you almost nothing unless you put it in context. What you need is structure, history, and clear numbers so you can separate routine activity from meaningful signals.
This is exactly where TIKR helps: the Ownership and Insider Transactions tabs bring all positions, changes, and insider trades into one place, with the numbers cleanly organized so patterns are easy to spot. Instead of digging through filings, you get everything laid out so even beginners can follow. That clarity turns insider and institutional data into a steady part of your investing routine rather than a confusing side task.
Why Tracking Ownership and Insiders Matters
Tracking ownership and insider activity helps you understand confidence inside and around the company. When large institutions build a position, that often signals a growing belief in the company’s direction. When they trim, it might reflect caution or simple rebalancing. Within the company, executive purchases usually stand out because insiders typically buy only when they believe the stock will be worth more later. Sales can mean many things, but the size and frequency of those sales can reveal whether sentiment is steady or shifting.
This information should not replace financial analysis, but it can support it. If you see improving financial results paired with insider buying and stable institutional ownership, that combination strengthens your own research. If the financial picture weakens while insiders sell heavily, that combination can reinforce caution.
A Breakdown of TIKR’s Ownership View
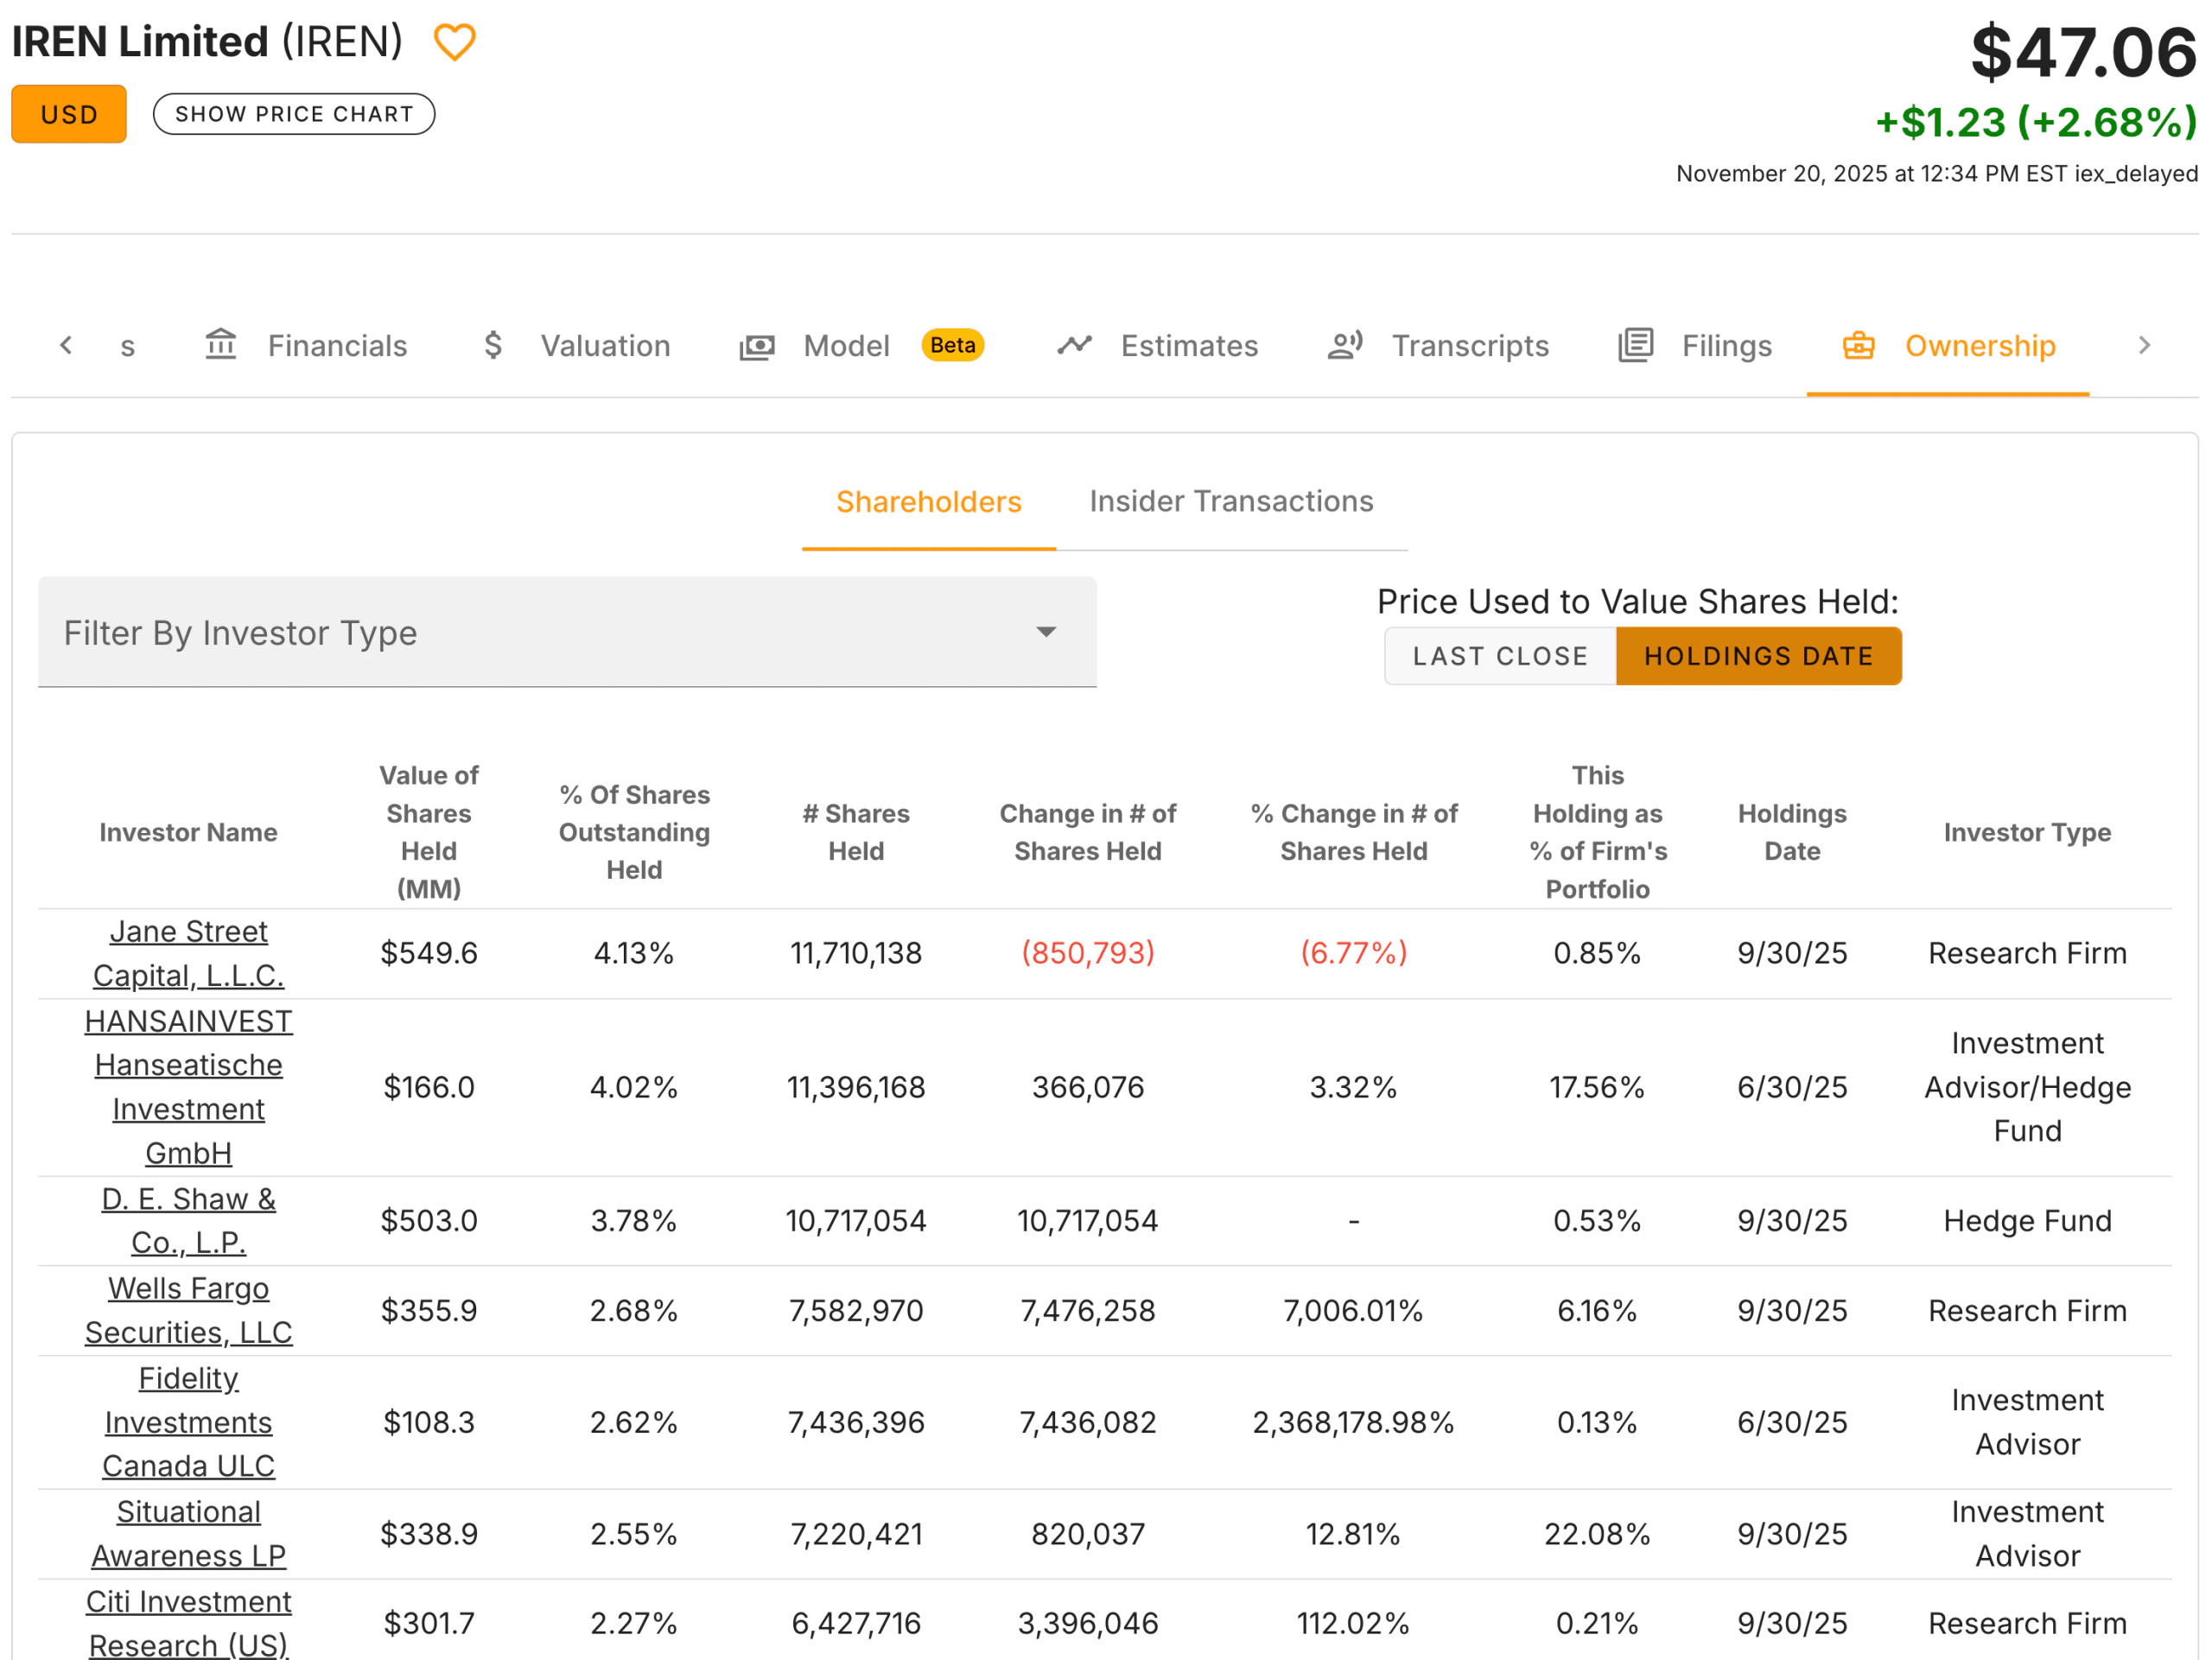
The Ownership tab in TIKR also presents a clean table of major shareholders, giving you a quick sense of who holds real influence over the company’s direction. You see the names of large institutions, index funds, asset managers, and other significant investors listed down the left side. Across the row, TIKR shows the value of their stakes, the number of shares held, the percentage of the company they own, and how those positions changed from the previous period. Because everything is displayed in one consistent layout, even beginners can understand the ownership structure without digging through multiple filings.
This setup is useful because it helps you separate long-term, high conviction holders from short-term or passive ones. Some institutions may only hold a small stake because they track an index. Others may have a large position because they believe strongly in the company’s long-term prospects. The percentage ownership column helps you recognize which investors really matter, and the change in shares column shows how their conviction shifts over time.
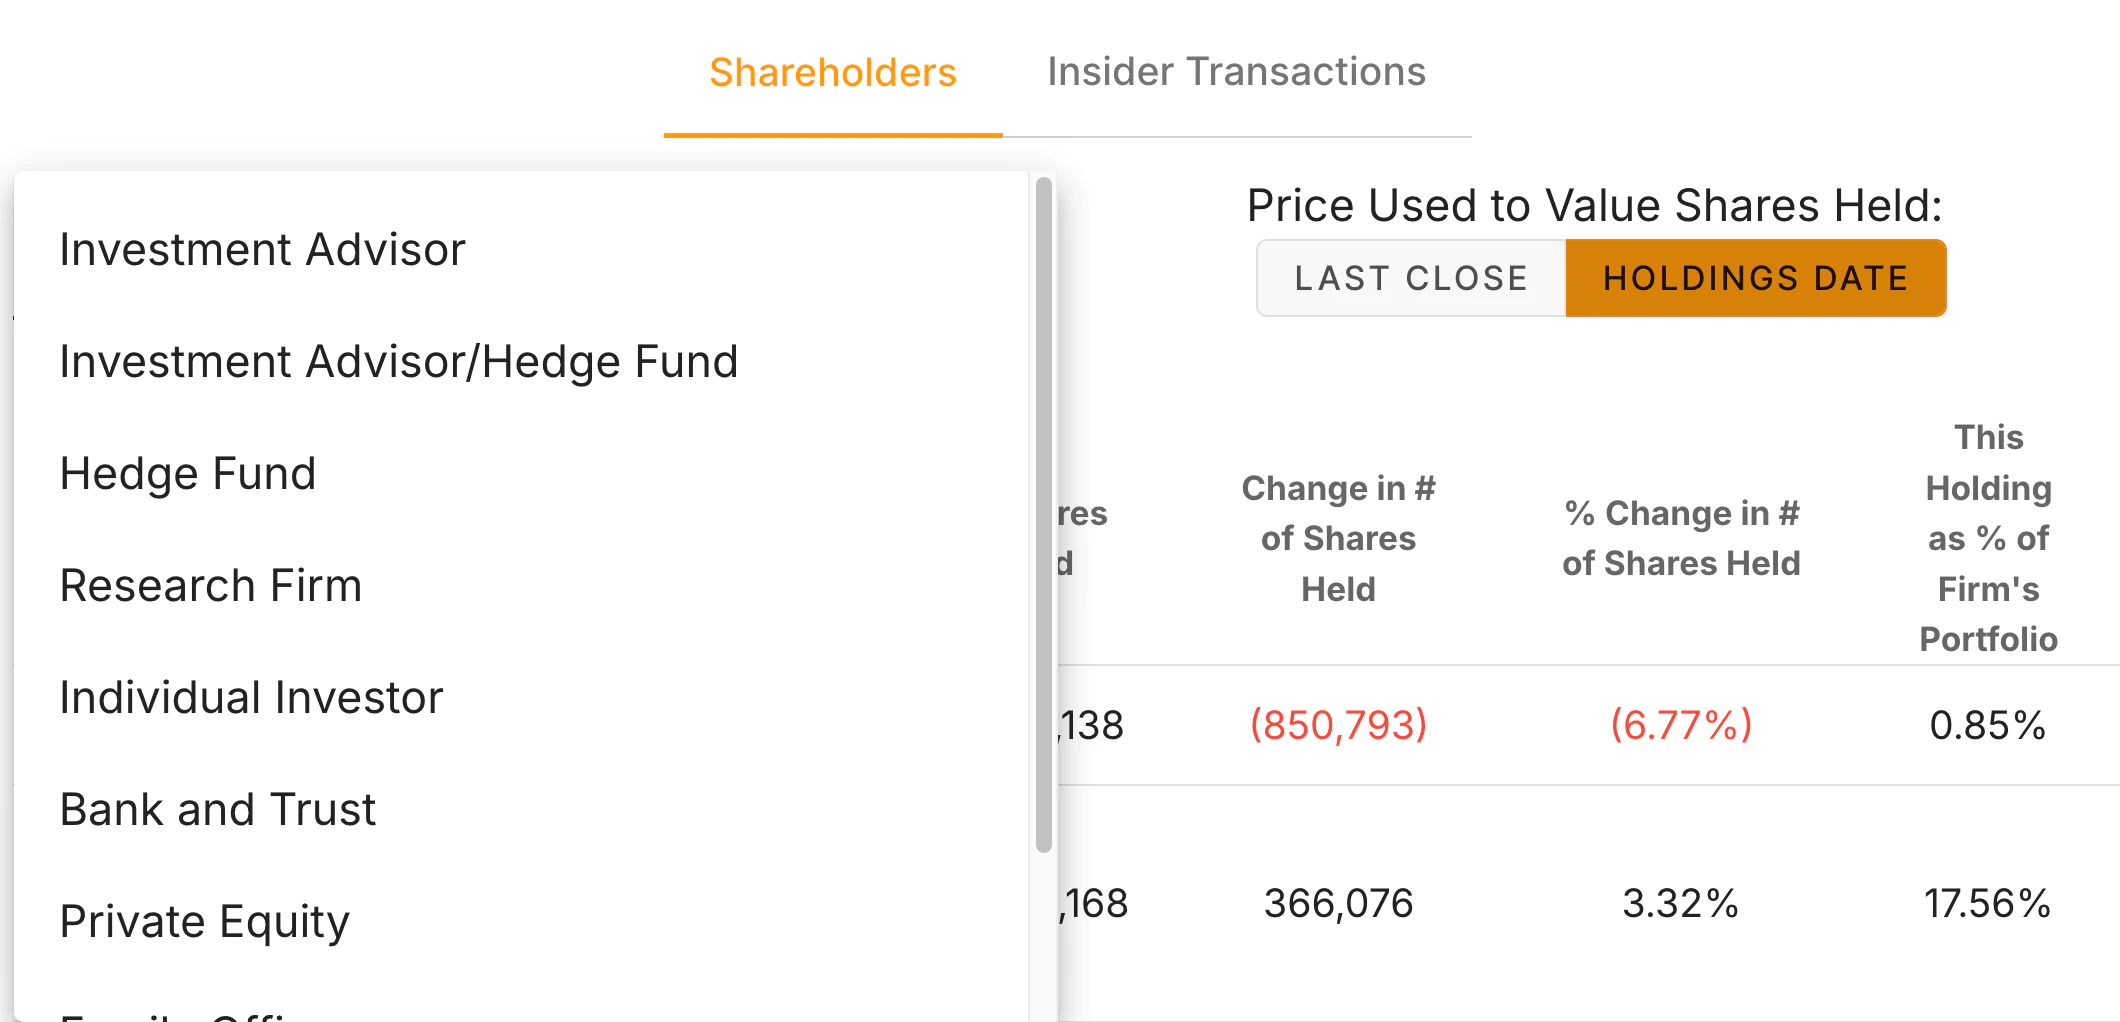
Another helpful aspect of TIKR’s layout is the ability to sort and filter by investor type. With a single click, you can view only hedge funds, only mutual funds, or only insiders. That makes it easier to analyze groups independently. For example, you might want to see whether long-term institutional holders are adding while short-term funds are selling, or whether a concentrated group of firms controls a large share of the company. TIKR’s filtering tools help you answer those questions quickly.
What makes this view especially valuable is that you can study ownership trends across multiple reporting periods. TIKR highlights share increases and decreases clearly, giving you a sense of how each major holder has moved over time. When several of the largest investors increase their stakes at the same time, that pattern can reinforce your confidence. When several reduce their positions simultaneously, that trend may prompt you to dig deeper. The Ownership tab lays out these patterns in a way that encourages steady, informed observation rather than rushed reactions.
Track ownership levels of your favorite stocks with TIKR (It’s free) >>>
How to Read Major Shareholder Moves
Reading shareholder activity is most useful when you focus on the largest owners, because these funds often have long-standing relationships with management and deep research teams behind their decisions. A noticeable increase from a top holder can reflect growing conviction. A noticeable reduction can suggest a change in view or a portfolio adjustment.
Patterns matter as much as single events. A fund that adds shares for several reporting periods may be building confidence over time. A fund that trims consistently may be reducing risk or shifting capital toward other ideas. TIKR highlights these changes in both raw numbers and percentages, making the trends easier to follow.
The size of the move also matters, as a small adjustment might be routine while a large shift is worth deeper thought. You do not need to jump to conclusions, but you should be aware of what the biggest owners are doing.
A Quick Tour of TIKR’s Insider Transactions View
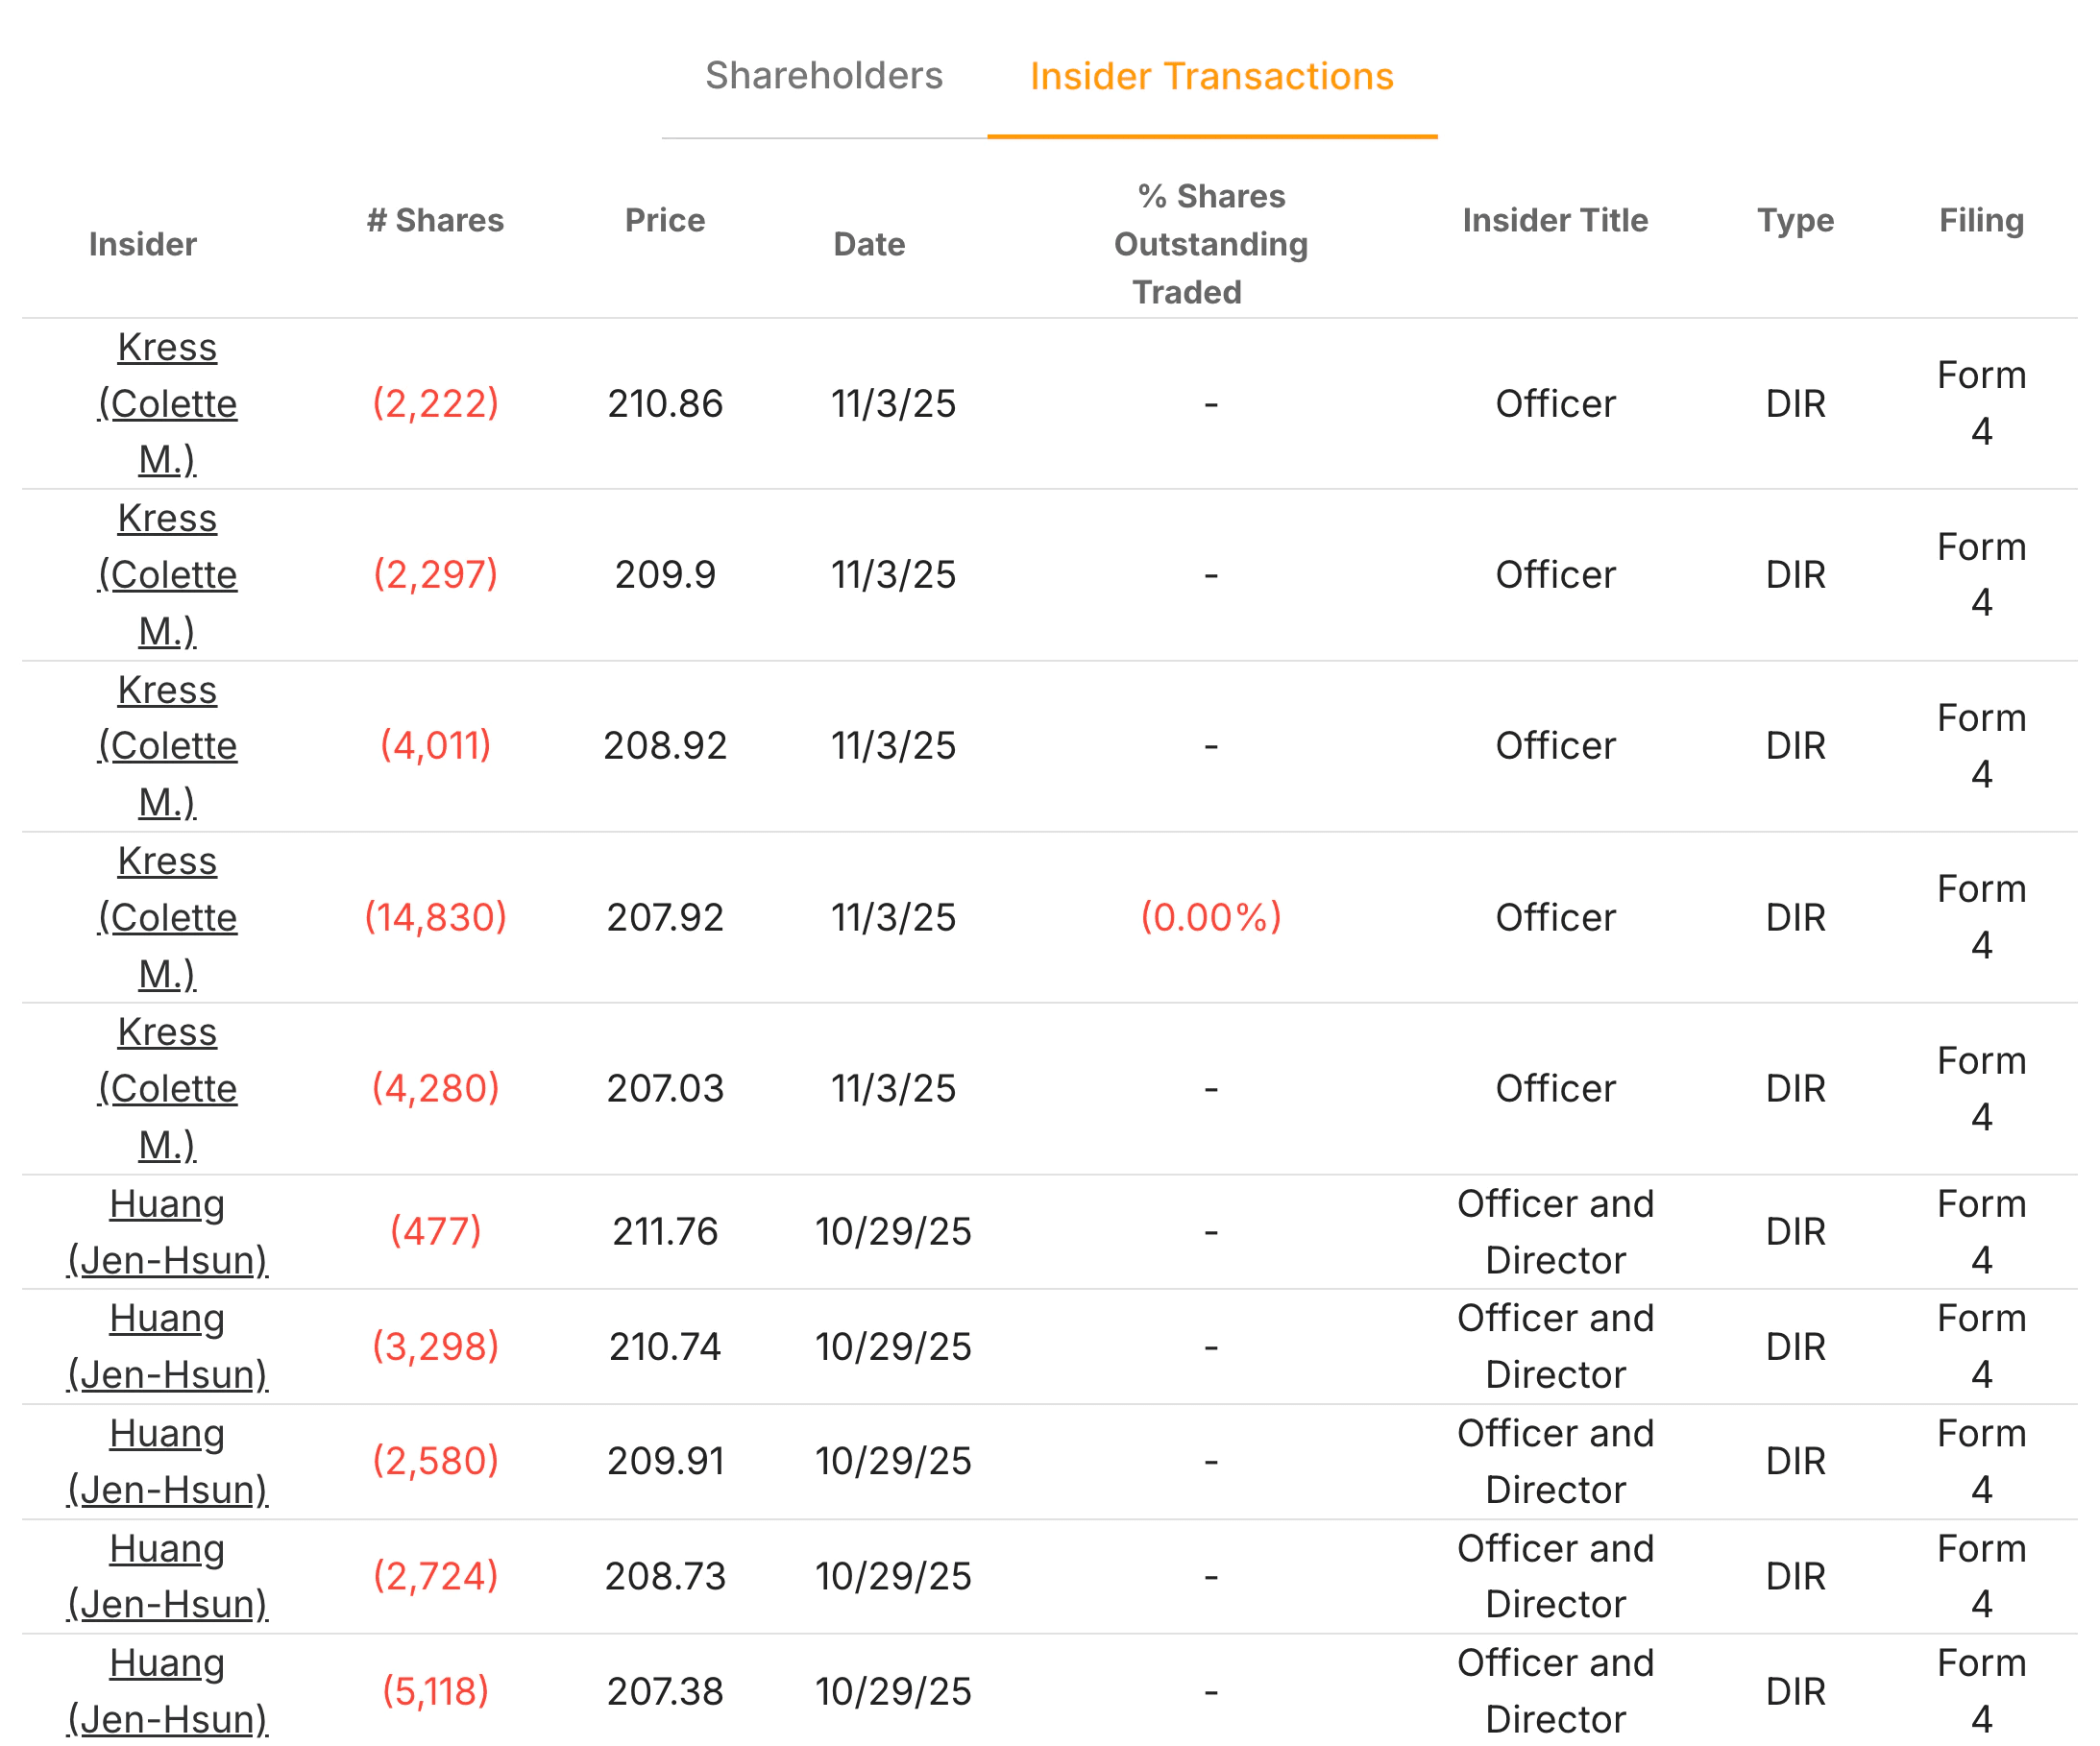
The Insider Transactions tab focuses on individual executives, directors, and key officials. It shows each trade, including the number of shares, price, date, and the insider’s role in the company. This level of detail gives you enough context to judge whether a move looks routine or noteworthy.
Seeing the full list of recent trades helps because it shows patterns that stand out more clearly than reading filings one at a time. If several insiders buy within a short period, that can be meaningful. If most insider activity is small and spaced out, it is usually routine.
Review insider transactions in less than 60 seconds with TIKR (It’s free) >>>
How to Interpret Insider Activity
Insider activity becomes useful when you compare the size, timing, and type of trade. Small, scattered sales often relate to compensation or tax planning. These do not usually signal a change in confidence. Larger sales, especially repeated ones, deserve more attention, though you still want to compare them to the financial picture and any recent news.
Insider buying tends to be a stronger signal because insiders rarely buy unless they believe the stock is undervalued. Even small buys matter because insiders already receive equity through compensation. When they go beyond those grants to buy more, it usually reflects a positive view.
The most important point is not to react to a single trade. Look for clusters, patterns, and alignment with financial results. Insider activity is most helpful when it fits into a broader story.
Connecting Ownership and Insider Signals to Your Research
Once you understand what shareholders and insiders are doing, connect that information to the company’s fundamentals. If you see strong financial results, stable margins, and healthy cash flow alongside steady buying from insiders or institutions, that combination supports confidence. If results weaken while insiders sell heavily, that combination supports caution.
TIKR makes this process simple by allowing you to move directly from Ownership to Financials or Valuation within the same platform. This lets you check whether shareholder behavior aligns with the underlying numbers without switching tools.
A Simple Checklist for Tracking Insider Moves
A short checklist helps keep your process consistent:
- Focus on whether major holders are adding or reducing.
- Whether insiders are buying.
- Whether sales are routine or large.
- Whether these moves repeat over several periods.
- Does this behavior match what you see in the company’s financials?
- Remember, you want clarity, not perfection. The goal is to understand whether shareholder actions strengthen or weaken your confidence in holding the stock.
Track what stocks hedge funds are buying on TIKR (It’s free) >>>
TIKR Takeaway
Tracking insider and institutional activity can feel overwhelming if you rely on scattered filings. TIKR makes the process simple by presenting ownership and insider data in a clear, structured layout that even new investors can follow. You see who holds the stock, how those positions change, and which insiders are trading, all in one place. This removes the guesswork and gives you a fuller view of sentiment around the company.
The strength of TIKR is that this information connects directly to the rest of your research. You can check ownership trends, then jump to financial results, valuation, or estimates without leaving the platform. This flow turns insider and institutional data into a regular part of your investing process instead of an occasional task. Over time, that structure helps you make steadier, more informed decisions about the stocks you own.
Value Any Stock in Under 60 Seconds with TIKR
With TIKR’s new Valuation Model tool, you can estimate a stock’s potential share price in under a minute.
All it takes is three simple inputs:
- Revenue Growth
- Operating Margins
- Exit P/E Multiple
If you’re not sure what to enter, TIKR automatically fills in each input using analysts’ consensus estimates, giving you a quick, reliable starting point.
From there, TIKR calculates the potential share price and total returns under Bull, Base, and Bear scenarios so you can quickly see whether a stock looks undervalued or overvalued.
Value any stock in under 60 seconds (Free with TIKR) >>>
Looking for New Opportunities?
- Discover which stocks billionaire investors are purchasing, so you can follow the smart money.
- Analyze stocks in as little as 5 minutes with TIKR’s all-in-one, easy-to-use platform.
- The more rocks you overturn… the more opportunities you’ll uncover. Search 100K+ global stocks, global top investor holdings, and more with TIKR.
Disclaimer:
Please note that the articles on TIKR are not intended to serve as investment or financial advice from TIKR or our content team, nor are they recommendations to buy or sell any stocks. We create our content based on TIKR Terminal’s investment data and analysts’ estimates. Our analysis might not include recent company news or important updates. TIKR has no position in any stocks mentioned. Thank you for reading, and happy investing!


