

When you are new to investing, one of the biggest questions is simple. How do you know whether a company is financially healthy? Prices move every day, headlines come and go, but underneath all of that is a set of numbers that tell you how strong or fragile a business really is. Those numbers live in the financial statements.
The problem is that traditional reports feel overwhelming at first. Long tables, unfamiliar terms, and dozens of lines can make you want to give up before you start. Thankfully, you do not need an accounting degree. What you do need is a structured way to look at the key areas that matter most for survival, stability, and growth.
The Financials tab in TIKR is designed to do exactly that. It puts the income statement, balance sheet, cash flow statement, ratios, and segments side by side, using the same layout and time periods. You can see several years at once, along with year-over-year changes and margin percentages. That makes it much easier to spot trends and decide whether a company looks strong or shaky.
Think of this guide as a friendly walk-through of the Financials tab for beginners. You will see what each section means, which lines to care about, and how to read them in a way that answers one core question. Is this business financially healthy enough for me to feel comfortable owning the stock?
A Quick Tour of the Financials Tab
When you open the Financials tab in TIKR, you see a set of sub-tabs across the top: Income Statement, Balance Sheet, Cash Flow Statement, Ratios, and Segments. Across each table, you will see years or quarters running left to right. Down the left side, you see the main line items.
For beginners, the most helpful mindset is not to worry about every single line. Focus on a handful of big questions. Are sales growing? Are profits real and reasonably stable? Is the company drowning in debt, or is it managing it? Does it generate cash, or does it constantly need new funding? TIKR helps because you can view these answers over several years in a consistent format, rather than jumping between different reports.
TIKR also highlights trends in a way many platforms do not. You can see year-over-year changes in red or black, margin percentages next to raw numbers, and multi-year histories that stretch far enough back to show real patterns. This layout makes the learning curve much smoother by giving you context rather than isolated data points.
Income Statement: Is the Business Making Money?
Start with the Income Statement tab, as this table tells the story of what the company sells and how much profit it keeps from those sales. The top line is revenue. A financially healthy company usually shows revenue that is flat to rising over time, not shrinking year after year. In TIKR, you also see a row for percent change year over year, which helps you spot whether growth is speeding up or slowing down.
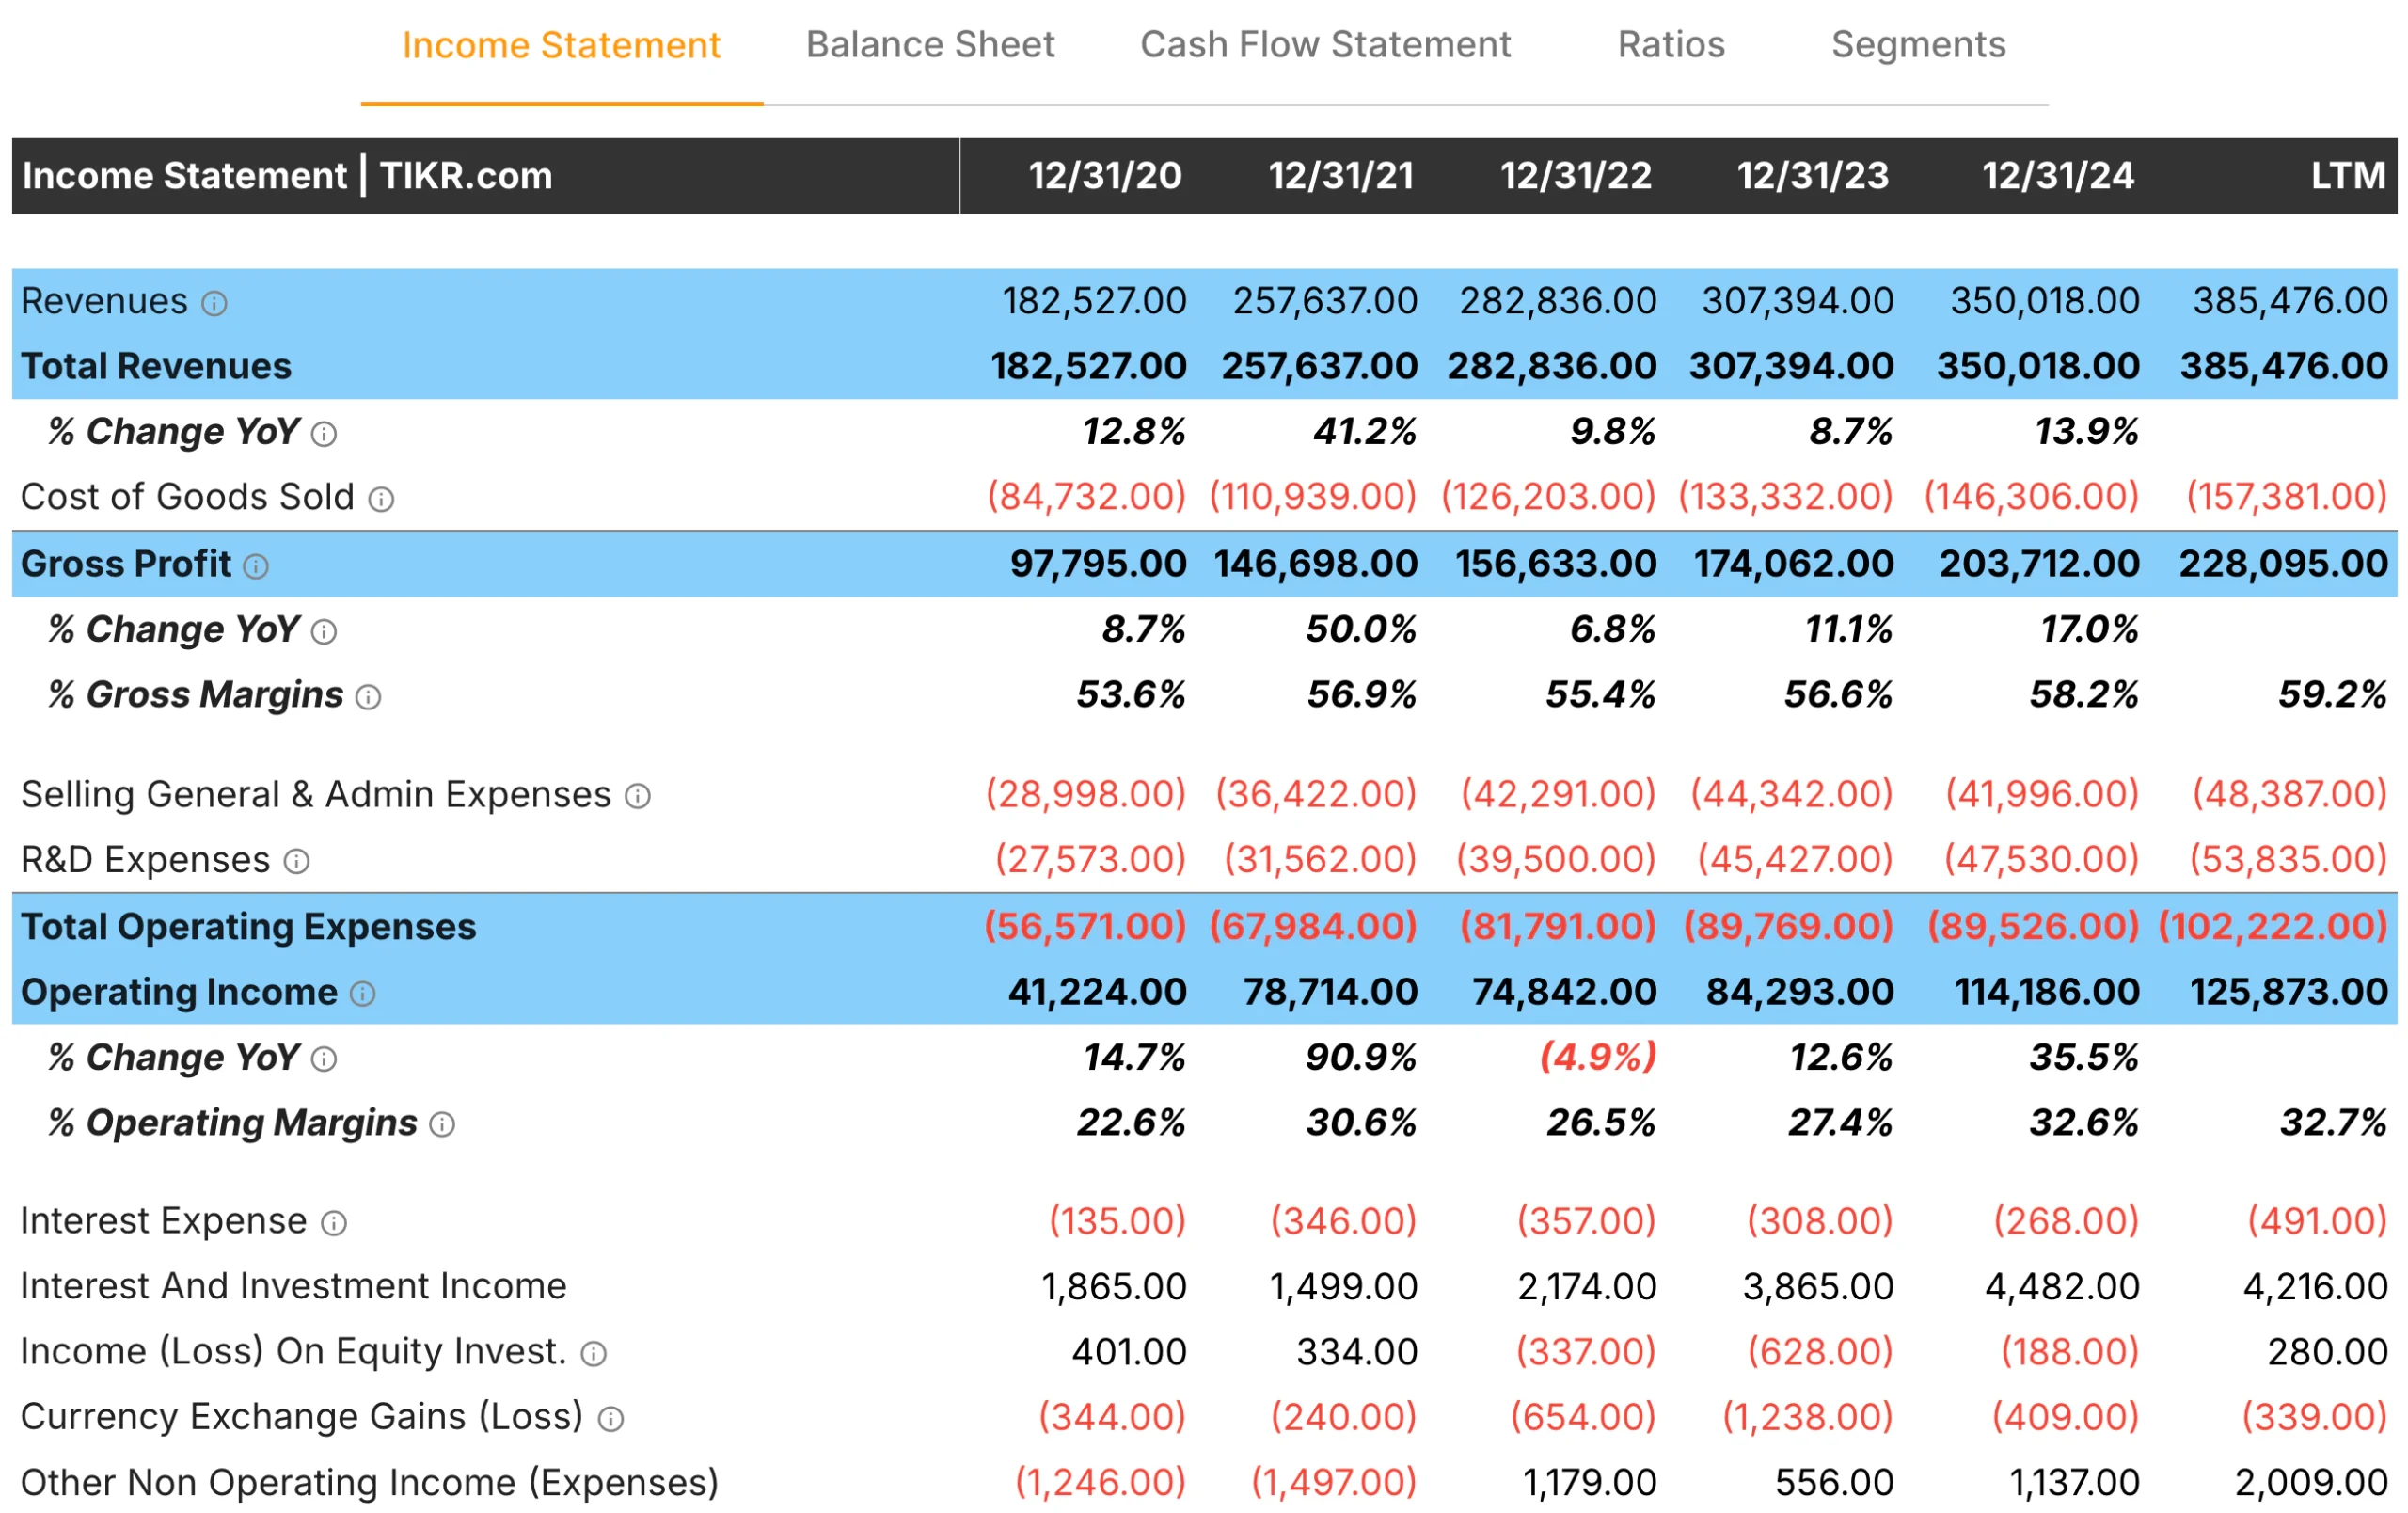
Below the revenue, you see the cost of goods sold and then gross profit. The gross margin row shows gross profit as a percentage of revenue. Healthy businesses often have stable or improving gross margins. A sudden, large drop can signal higher costs, price cuts, or a mix shift that hurts profitability.
Further down, you see operating income and operating margin. Operating income is the profit after paying core expenses such as salaries, marketing, and general overhead. Operating margin shows how much profit the company makes from its main operations for each dollar of sales. Healthy companies tend to keep this number positive and reasonably steady. If operating margin bounces wildly from positive to negative, that can be a sign of a more fragile business.
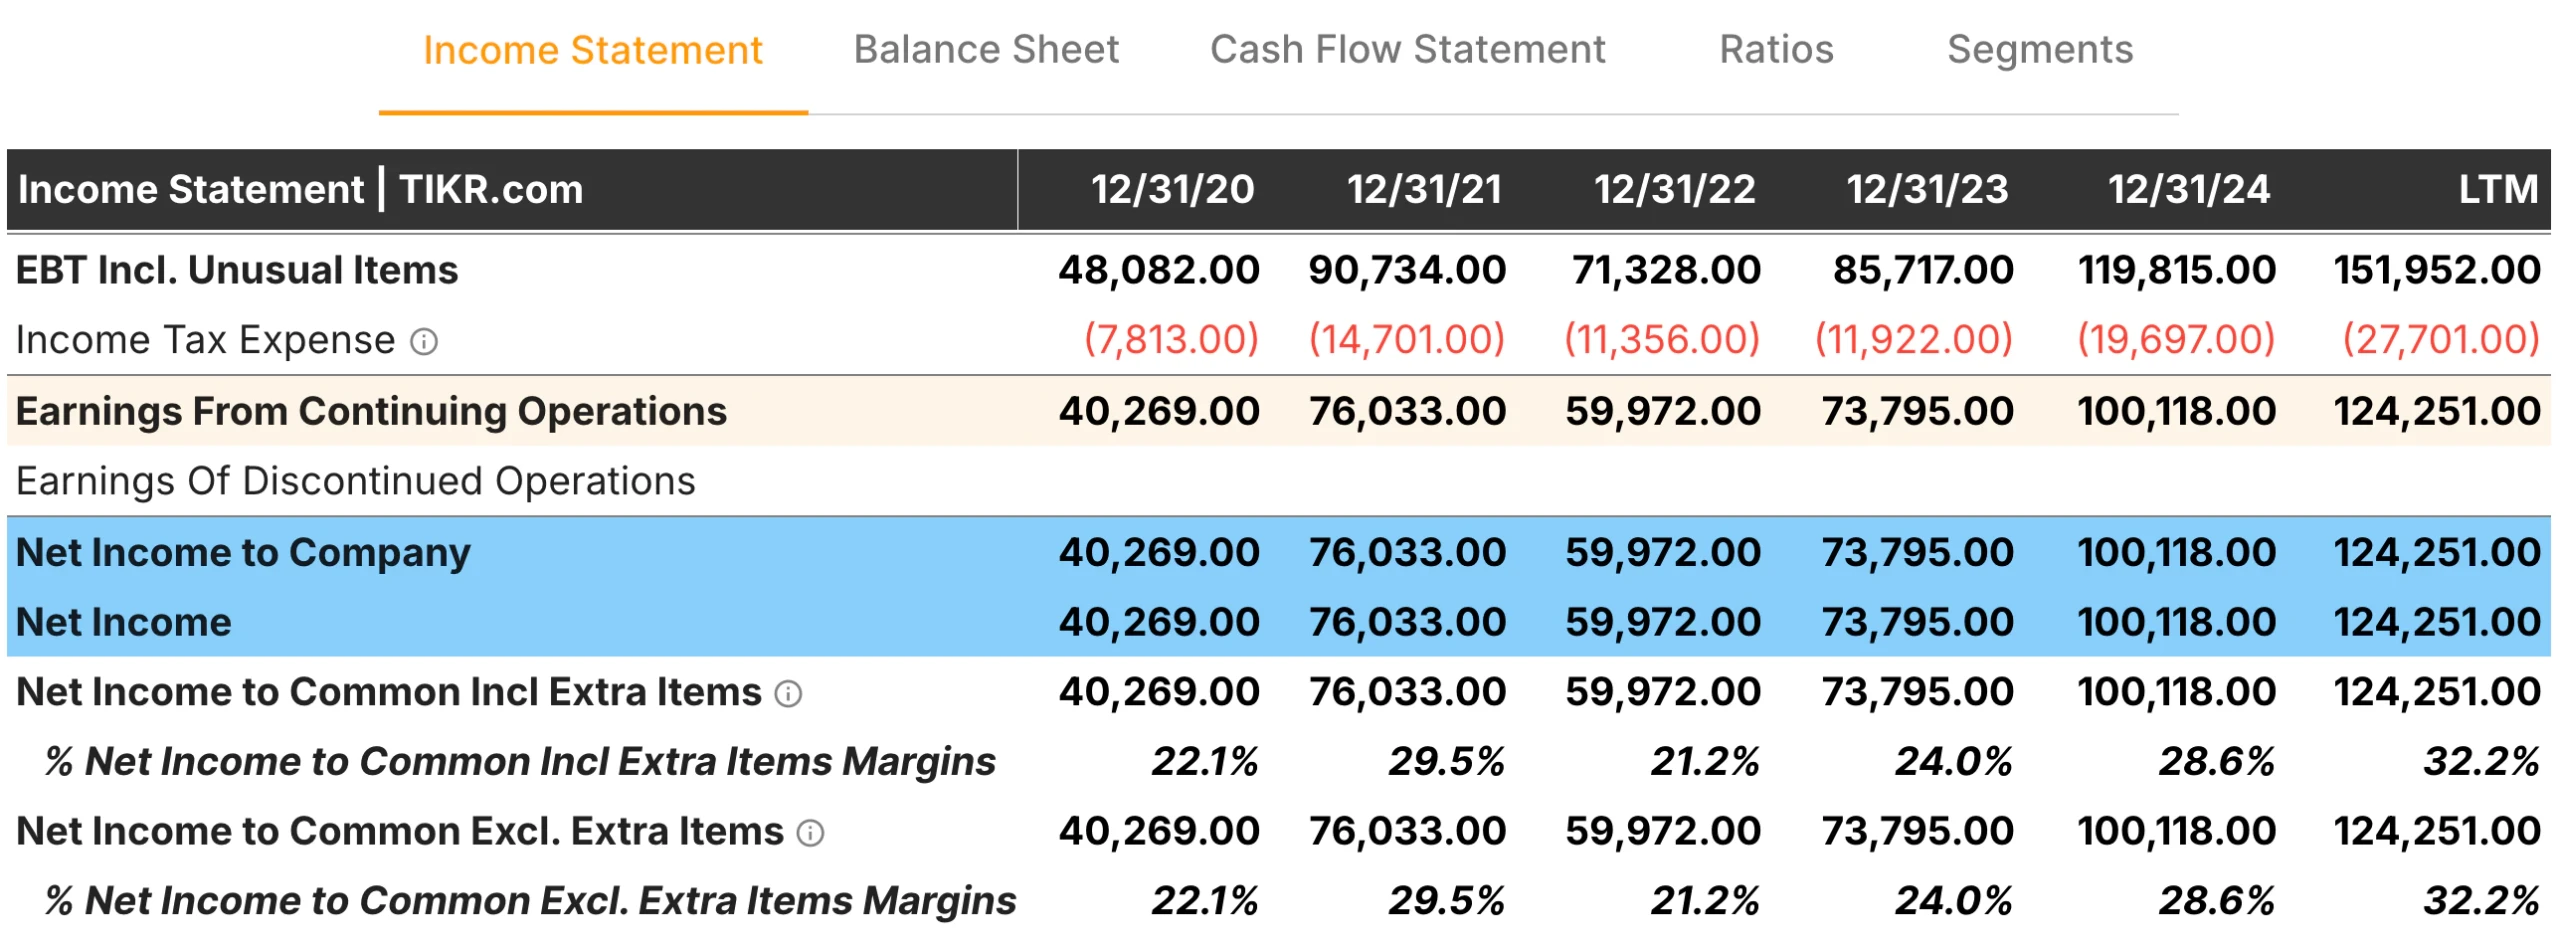
Further down in the Income Statement tab, you can also see net income, which is the profit after interest and taxes. TIKR shows net income and net margin for each year, plus how they changed. For beginners, you can ask yourself three simple questions here. Is net income positive most years? Does it move in the same general direction as revenue? Are big losses rare or frequent? A company that earns steady profits, with occasional dips during tough years, often has a sound base.
Track company financials, stock value, and competitor information with TIKR (It’s free) >>>
Balance Sheet: What the Company Owns and Owes
Next, click the Balance Sheet tab. This shows a snapshot of what the company owns, what it owes, and the value left for shareholders. On the top half, you see assets. On the lower half, you see liabilities and equity.
For beginners, start by looking at cash and short-term investments. A company with a solid cash position has more flexibility to handle downturns, invest, and pay down debt. Then look at total debt. In TIKR, you can see short-term debt, long-term debt, and total liabilities. A financially healthy company usually has a balance between debt and equity. You do not need exact target numbers, just check that debt is not exploding over time and that the company is not adding huge amounts every year without a clear reason.
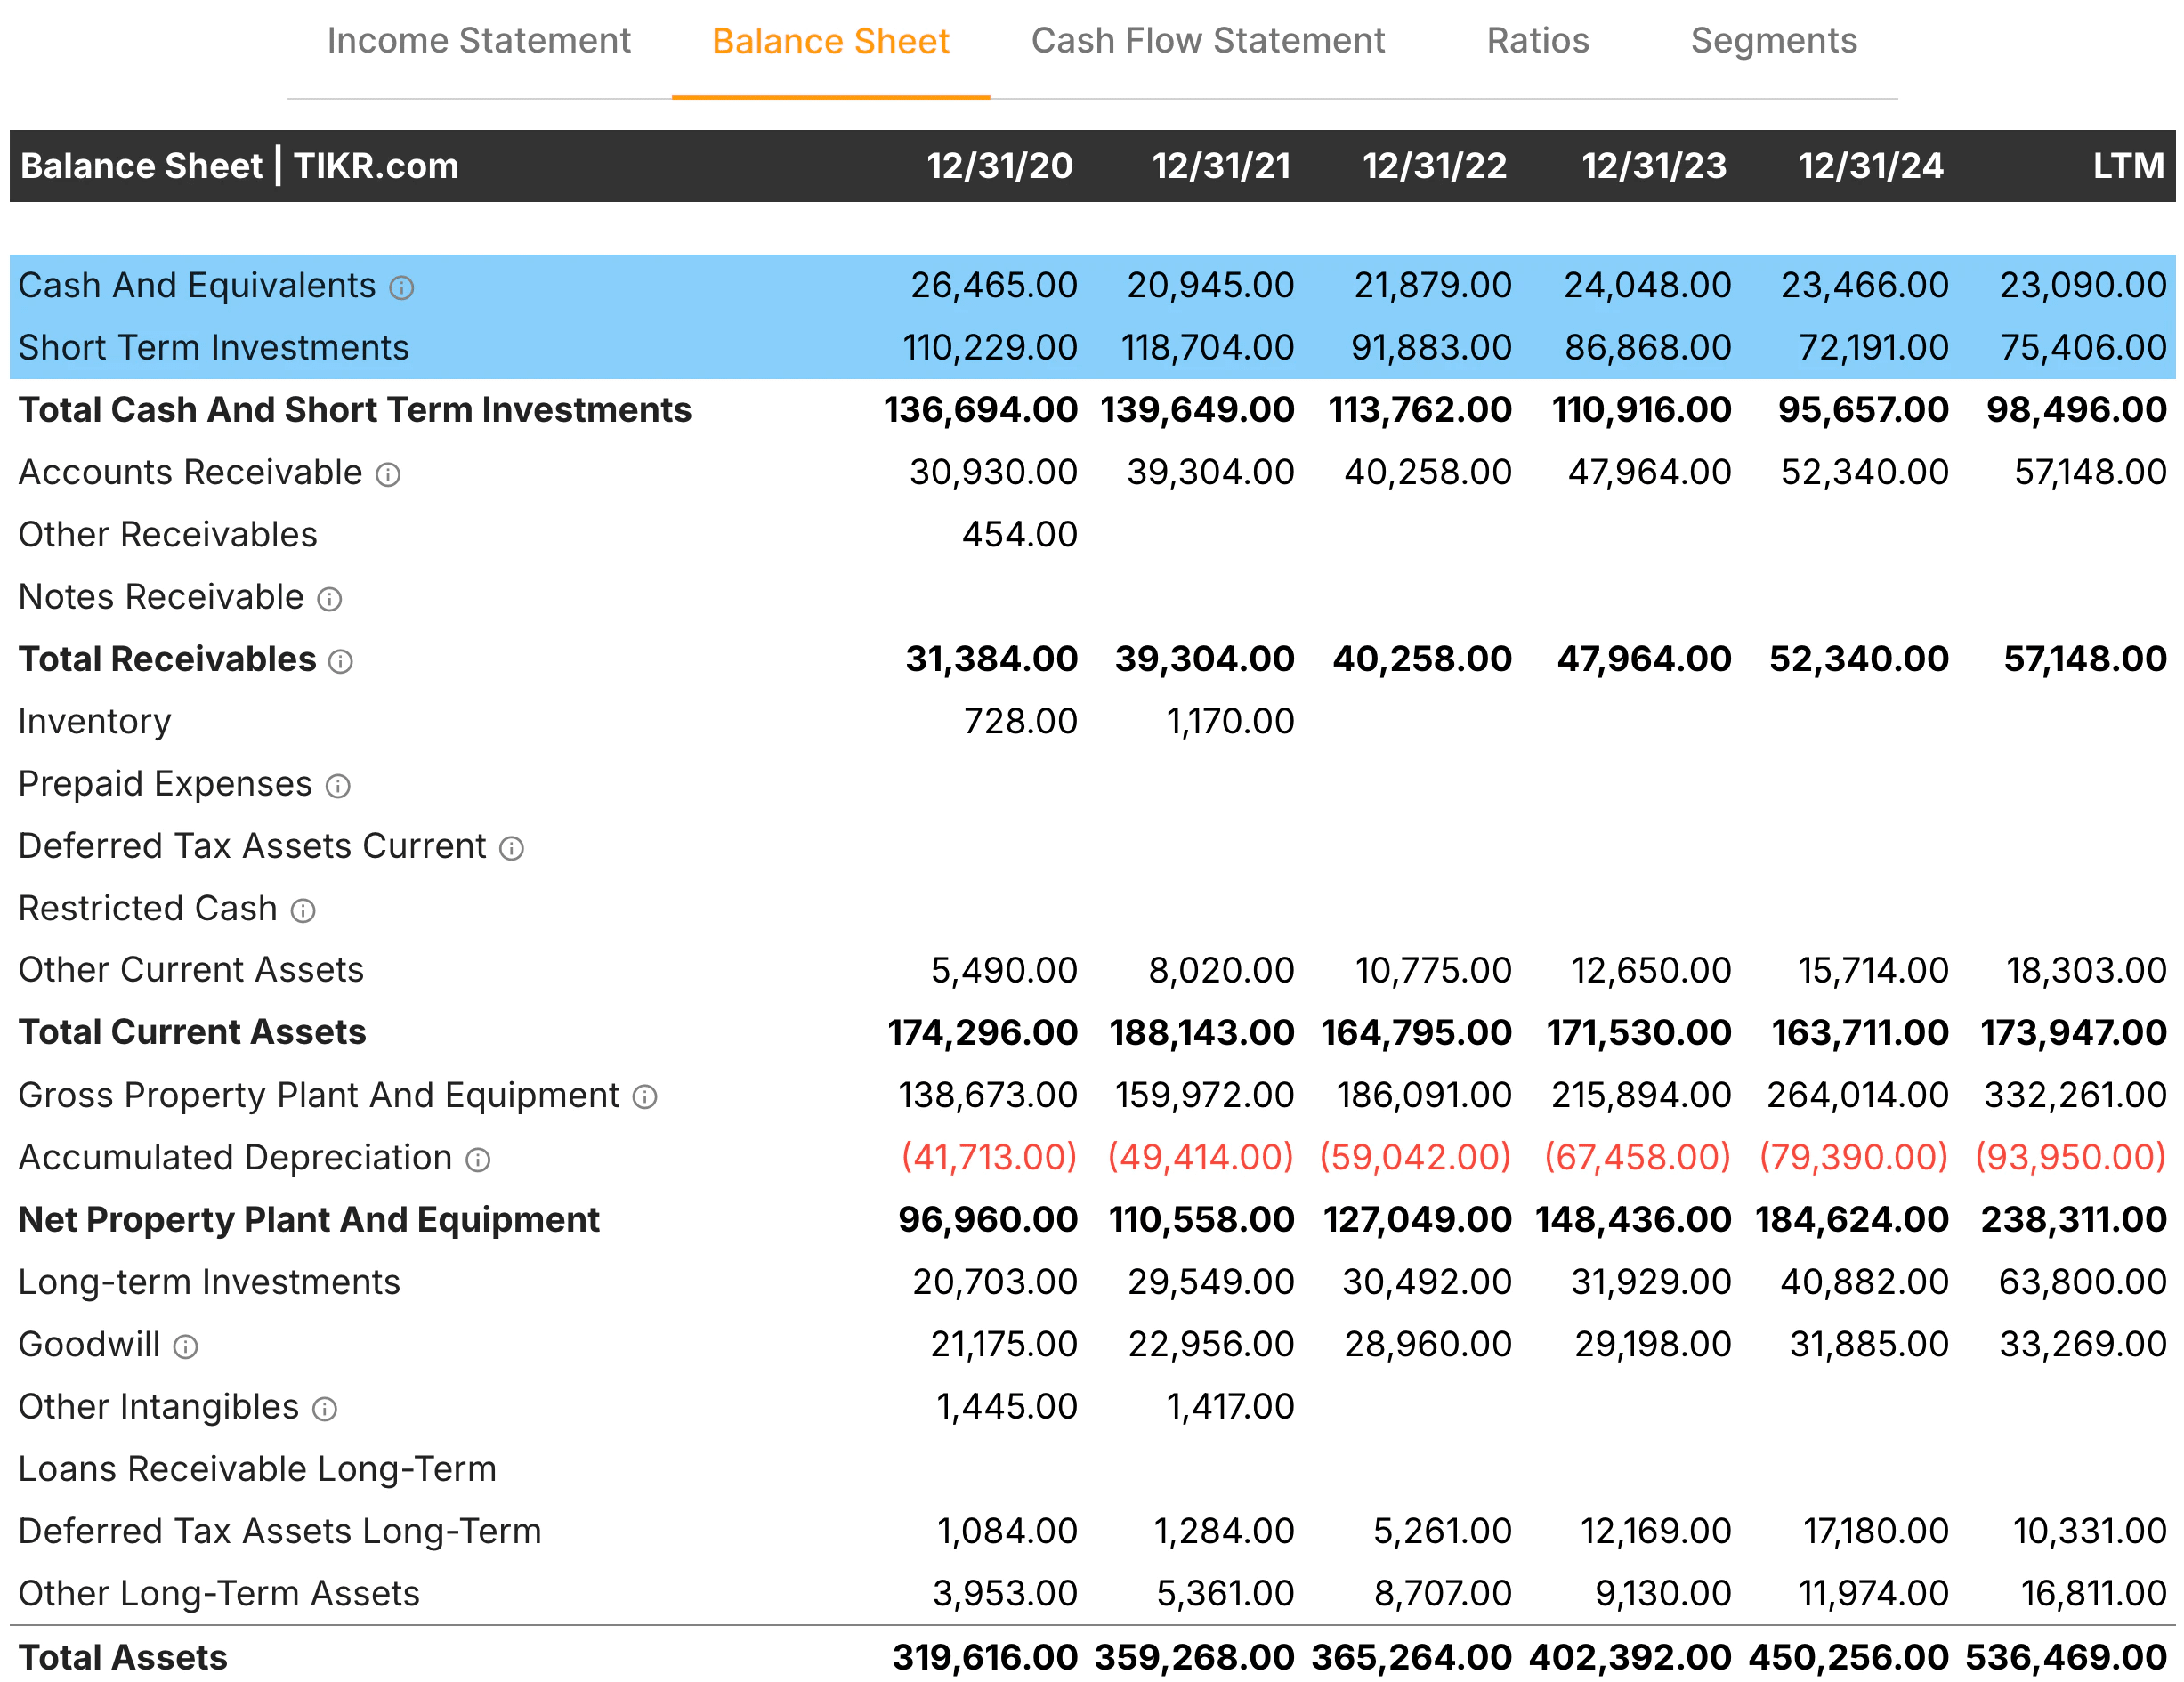
You can also look at total current assets versus total current liabilities. This tells you whether the company likely has enough near-term resources to cover near-term bills. Many investors analyze this relationship using ratios, but even a quick visual comparison across years can be helpful. If current liabilities are racing ahead of current assets, that is a caution sign.
At the bottom of the balance sheet is total equity. This is the value that belongs to shareholders after subtracting liabilities from assets. Over long periods, a growing equity base can signal that the company is building value rather than constantly eroding it.
Cash Flow Statement: Are Profits Backed by Cash?
The Cash Flow Statement tab answers a simple question. Does this company turn its accounting profits into real cash? Many beginners focus only on net income, but a company can report profits while still burning cash due to heavy investments, rising receivables, or other working capital needs.
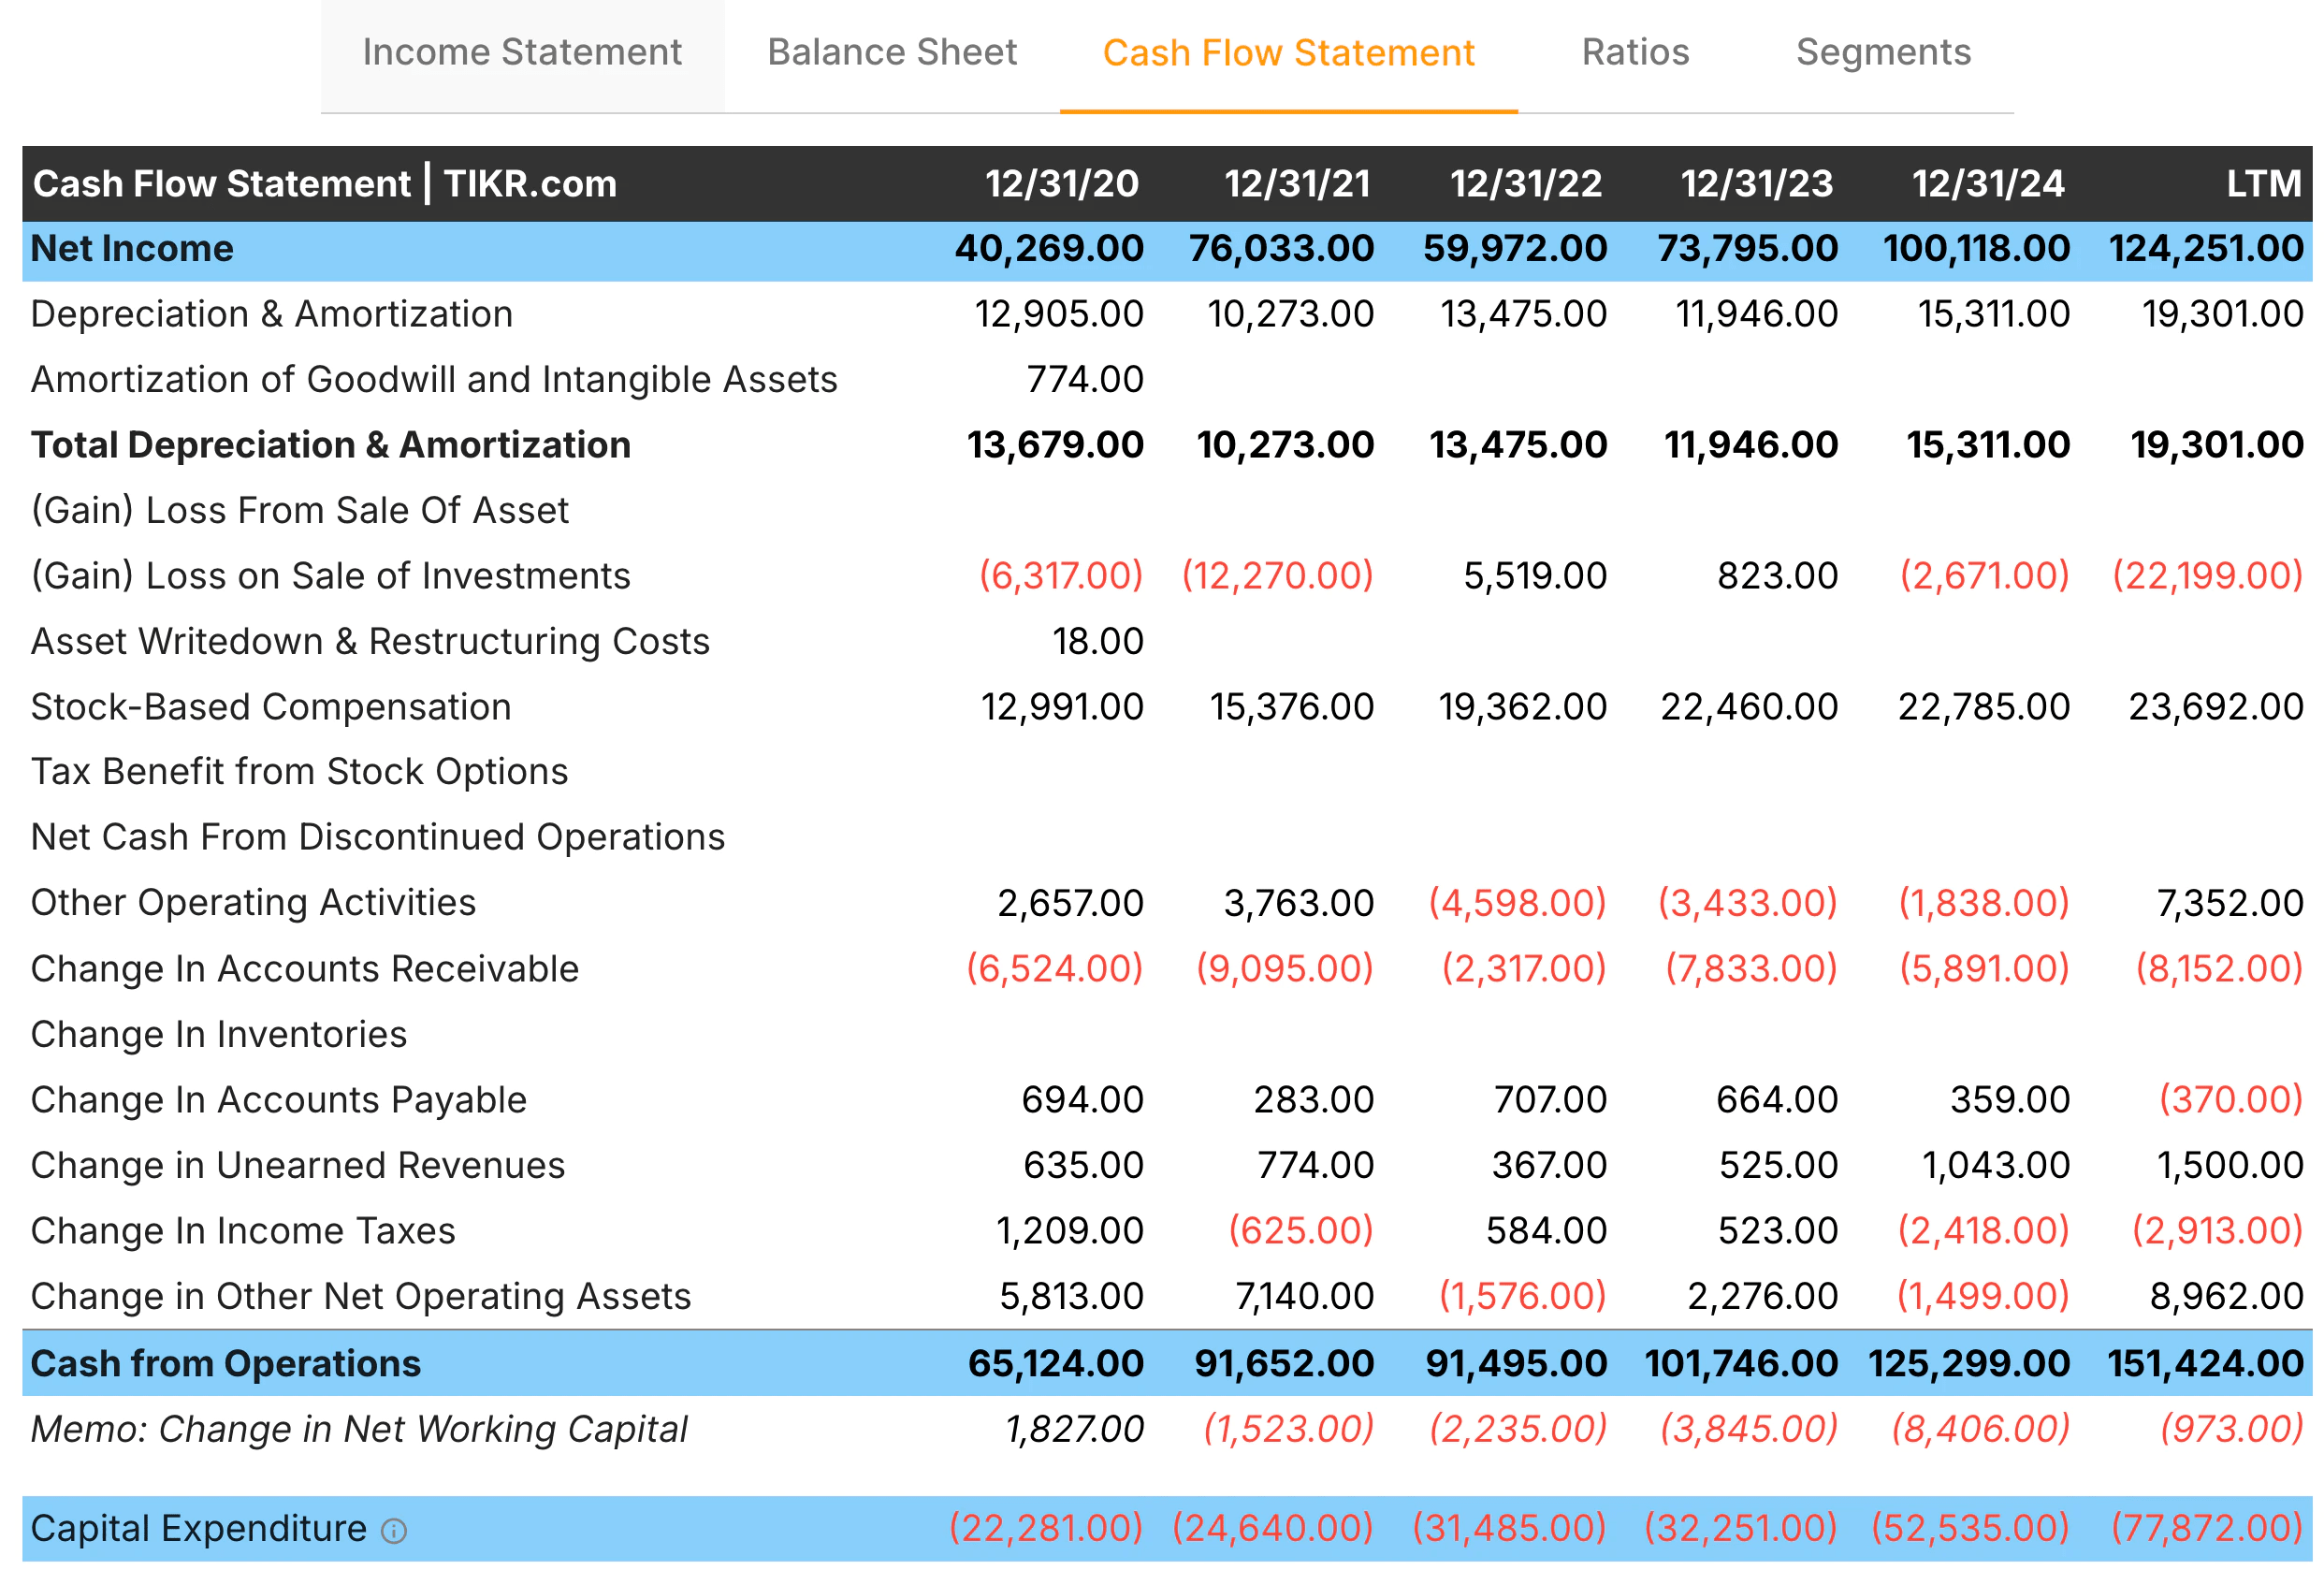
Look first at cash from operations. In TIKR, this line appears near the middle of the cash flow table. A healthy company tends to show positive cash from operations in most years, ideally trending upward over time. If cash from operations is negative again and again, the business may be struggling to support itself.
Next, look at capital expenditures, often labeled capital expenditures or the purchase of property, plant, and equipment. This is the money the company spends to maintain or grow its asset base. When you subtract capital expenditures from cash from operations, you get a rough idea of free cash flow. TIKR often shows a free cash flow line in the supplementary data section, which makes this even easier. Positive and rising free cash flow over time is one of the strongest signs of financial health.
Further down the cash flow statement, you can see whether the company is paying down debt, issuing new debt, buying back shares, or paying dividends. A business that consistently needs to borrow or issue shares just to stay afloat looks weaker than one that can fund itself from its own operations.
Review stock fundamentals in less than 60 seconds with TIKR (It’s free) >>>
Ratios: Quick Signals In One Place
Weight changes reveal a lot about conviction. A manager may start small, but steady increases across the Ratios tab in TIKR pulls key statistics from all three statements and lays them out in one grid. For a beginner, this tab is like a dashboard. You can see return measures, margins, leverage ratios, and liquidity measures without doing any math yourself.
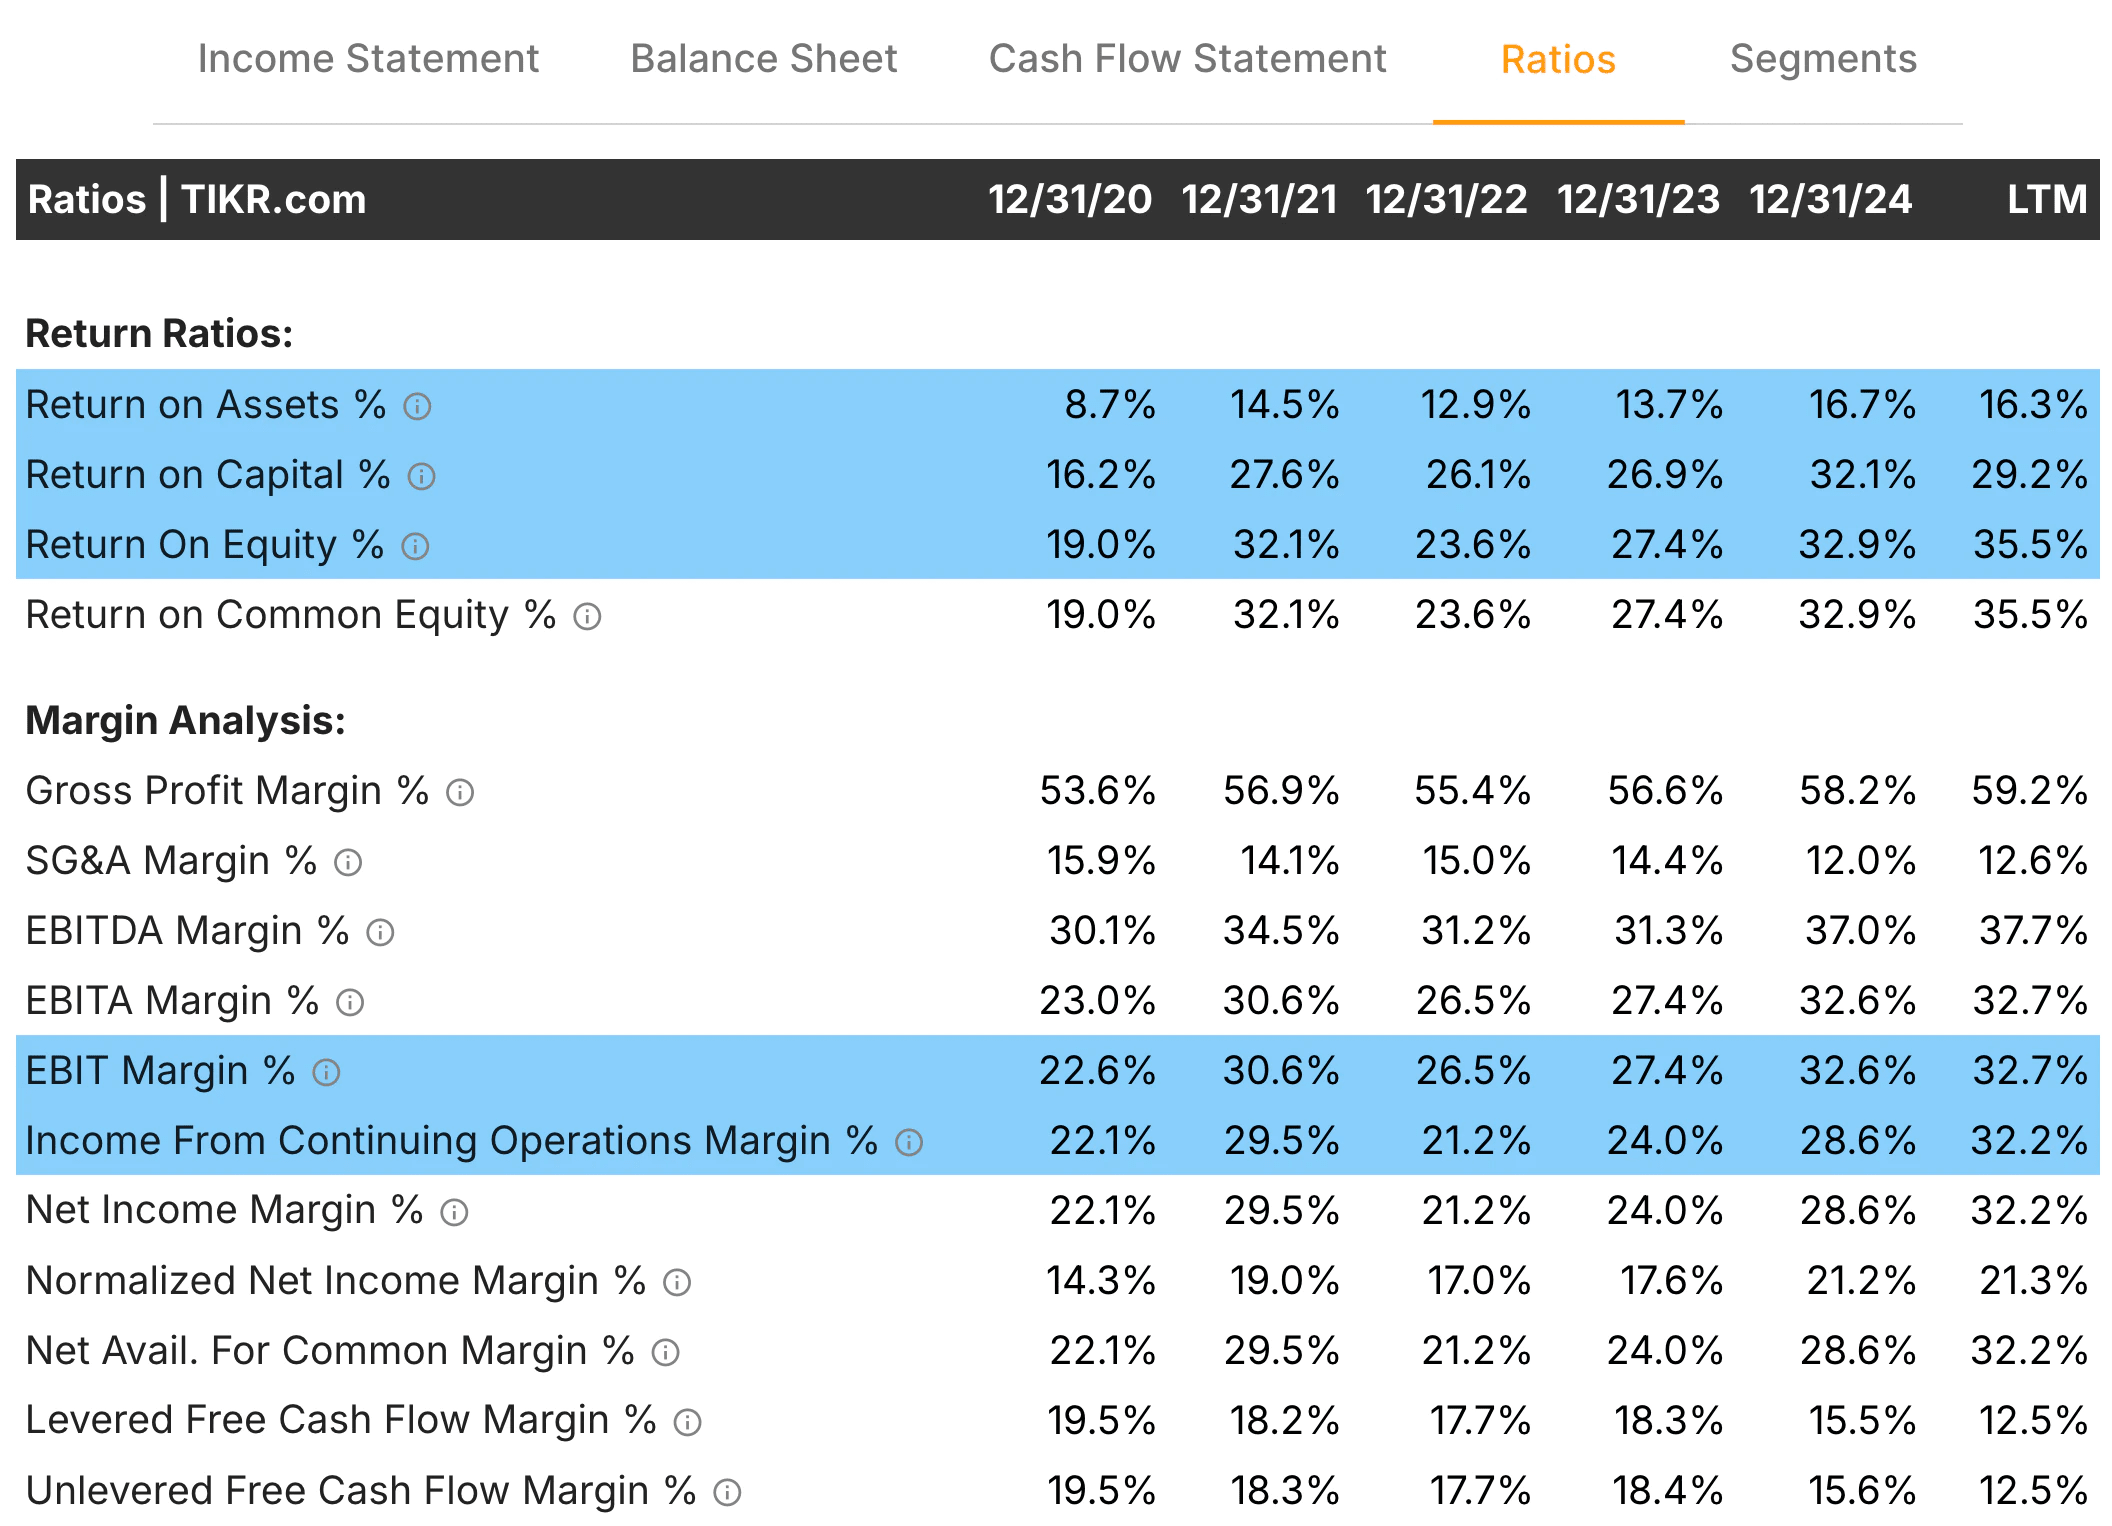
On the top part of the table, you will see return on assets, return on capital, and return on equity. These show how efficiently the company uses the money invested in it. Higher and stable returns often point to a stronger business model. A sharp drop in these returns can signal pressure on profitability or an increase in debt use.
You also see margin analysis. Gross margin, EBITDA margin, and EBIT or operating margin are listed here. These match the lines you saw on the income statement, and the ratios tab makes it easier to compare them across years. Healthy companies tend to maintain positive, reasonably steady margins. If margins shrink year after year with no sign of recovery, that can signal a competitive or cost problem.
Lower on the page, you will find leverage and liquidity ratios. Debt-to-equity, total debt-to-assets, and interest coverage indicate how much the company relies on borrowing and how easily it can pay interest. The current ratio and quick ratio indicate short-term stability. You don’t need to memorize exact target levels, unfortunately. Just look for trends. Rising leverage and falling coverage, combined with weak margins, should prompt more caution.
Segments: Where the Money Really Comes From
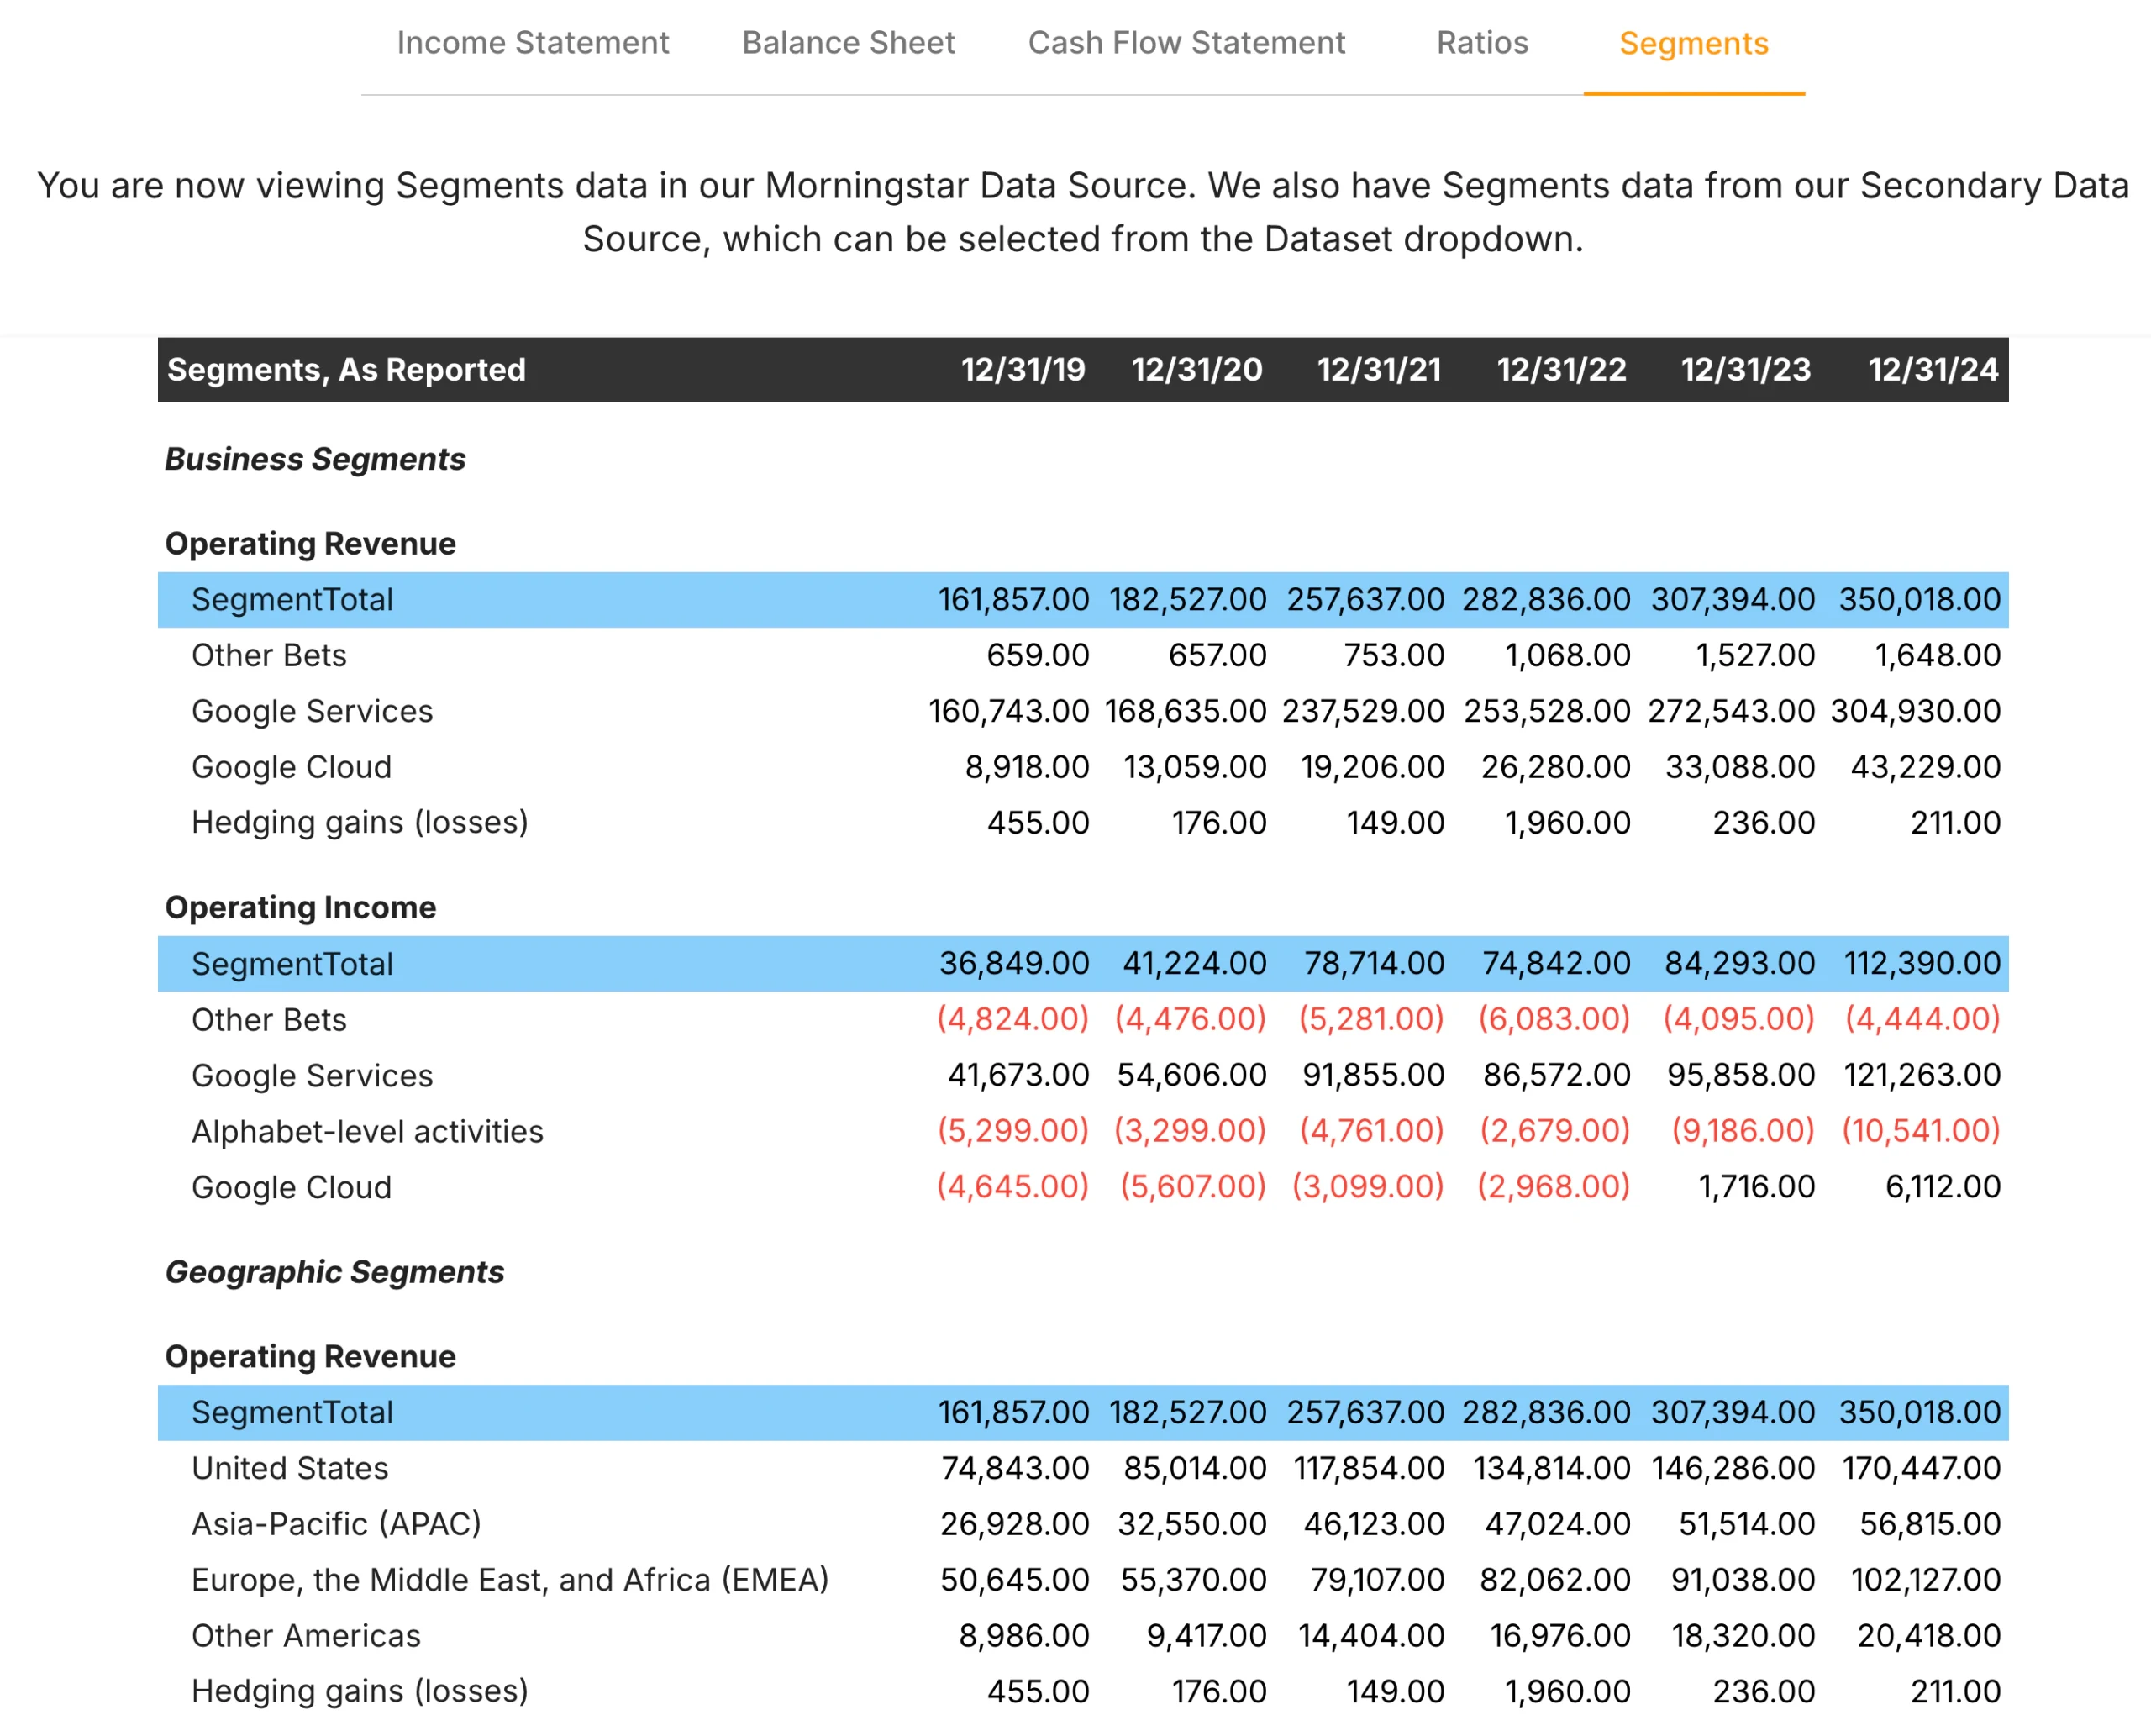
The Segments tab breaks financials into pieces such as business lines or regions. This helps you understand what is driving revenue and profit. One division might be growing quickly, while another is shrinking. One area or region might account for most of the profit, while others barely break even.
For financial health, segments matter because they reveal concentration and diversification. A company that depends on a single product or region is more vulnerable to shocks than one with several healthy segments. In TIKR, you can see segment revenue and sometimes segment profit across years. If one core segment is weakening every year and there is nothing strong to replace it, the long-term picture is less attractive.
The segment view is also helpful when you see strong overall results but want to know whether growth is broad-based or driven by one hot area. Broad, steady growth across several segments usually feels more stable than growth driven entirely by one new product or geography.
Putting It All Together
Once you have spent time in each tab, you can form a simple mental checklist. Are revenues generally rising? Are margins positive and reasonably steady? Does the company have a sensible level of debt and enough cash and current assets to cover near-term obligations? Is cash from operations positive and growing, with healthy free cash flow? Do key ratios point toward decent returns and manageable leverage? Are the main segments healthy, or is one part of the business carrying all the weight?
You will not always get perfect answers, and that is fine. No company is flawless. The goal is to build a clear picture of financial strength or weakness rather than guessing based on price alone. TIKR’s Financials tab gives you that structure by putting everything in one place, organized in a way that makes sense even if you are just getting started.
Here is a shorter version of the checklist that covers the essentials:
- Revenue rising or stable over several years
- Positive operating and net margins most of the time
- Consistently positive cash from operations
- Free cash flow that is not shrinking year after year
- Debt levels that trend stable rather than rising sharply
- Segments that show steady or broad-based strength
You do not need perfection across each line. You are looking for stability, sensible trends, and signs that the business can support itself without outside help. If most of these items check out, the company is usually considered financially healthy for a beginner investor.
Track all of your favorite stocks on TIKR (It’s free) >>>
TIKR Takeaway
For new investors, financial statements often feel like a foreign language. TIKR turns them into a readable story. The Financials tab pulls every major statement into the same format and time horizon, so you do not have to jump between reports or guess what changed from one year to the next. That consistency matters because it lets you see the company the way professionals do, with long-term trends sitting clearly in front of you.
The advantage of TIKR is that everything you need to judge financial health lives in one place. You can check revenue growth on the income statement, debt levels on the balance sheet, cash generation on the cash flow statement, and returns or margins on the ratios tab without switching tools. Then you can confirm where the money really comes from in the segments view. This seamless flow saves beginners hours of manual work and helps you avoid common mistakes, such as focusing only on earnings or only on debt.
A TIKR subscription gives you something most free platforms cannot match: clarity. You spend less time searching for numbers and more time understanding what they mean. For anyone learning how to evaluate companies, the simplicity and structure make TIKR one of the most valuable tools you can have.
Value Any Stock in Under 60 Seconds with TIKR
With TIKR’s new Valuation Model tool, you can estimate a stock’s potential share price in under a minute.
All it takes is three simple inputs:
- Revenue Growth
- Operating Margins
- Exit P/E Multiple
If you’re not sure what to enter, TIKR automatically fills in each input using analysts’ consensus estimates, giving you a quick, reliable starting point.
From there, TIKR calculates the potential share price and total returns under Bull, Base, and Bear scenarios so you can quickly see whether a stock looks undervalued or overvalued.
Value any stock in under 60 seconds (Free with TIKR) >>>
Looking for New Opportunities?
- Discover which stocks billionaire investors are purchasing, so you can follow the smart money.
- Analyze stocks in as little as 5 minutes with TIKR’s all-in-one, easy-to-use platform.
- The more rocks you overturn… the more opportunities you’ll uncover. Search 100K+ global stocks, global top investor holdings, and more with TIKR.
Disclaimer:
Please note that the articles on TIKR are not intended to serve as investment or financial advice from TIKR or our content team, nor are they recommendations to buy or sell any stocks. We create our content based on TIKR Terminal’s investment data and analysts’ estimates. Our analysis might not include recent company news or important updates. TIKR has no position in any stocks mentioned. Thank you for reading, and happy investing!


