The cash flow statement is one of the primary financial statements that provides a detailed breakdown of how cash is generated and used by a company over a period of time.
The cash flow statement is often regarded as the most important financial statement for understanding a business’s true profitability because it shows how much cash the business brought in, and it’s very difficult to manipulate.
Here’s how you can analyze a company’s cash flow statement in under 5 minutes.
The 3 Parts of the Cash Flow Statement
The three types of cash flows detailed in a cash flow statement are:
- Cash Flow from Operations (CFO): Cash generated or used in the company’s core business activities. This section analyzes a business’s core cash flows and adjusts for non-cash items.
- Cash Flow from Investing (CFI): Cash used for or generated from investments in assets such as property, plant, and equipment. Investors can see if these investments align with the company’s long-term strategic goals.
- Cash Flow from Financing (CFF): Cash flows between the company and its investors or creditors. Investors can use this section to understand how the company finances its investments and operations and returns capital to shareholders.

Analyze stocks quicker with TIKR >>>
What the Cash Flow Statement Can Tell You About a Company
By analyzing the cash flow statement, investors can assess how well a company generates cash to fund its operations, pay debts, and make new investments. Unlike the income statement, where the bottom line can be influenced by accounting choices, the cash flow statement provides a clearer picture of a company’s actual cash generation.
The cash flow statement provides several key insights for long-term investors:
- Liquidity and Cash Generation: The cash flow statement helps investors evaluate a company’s ability to generate cash from its core operations. A company consistently generating positive free cash flow is generally more financially stable, capable of meeting its short-term obligations, and funding its growth.
- Capital Expenditures and Investment: By reviewing the cash flow from investing activities, investors can see how much a company is spending on capital expenditures (CapEx), such as new equipment or property. High CapEx could indicate that a company is investing heavily in its future growth, but it could also strain cash reserves if not managed properly.
- Debt Management and Financing Activities: The financing activities section of the cash flow statement provides insights into how a company manages its debt and finances its operations. Positive cash flow from financing activities may indicate that new debt was issued or that the company raised equity financing, while negative cash flow could signal debt repayment or dividend payouts. This can help investors assess a company’s financial strategy and risk level.
- Cash Reserves and Flexibility: The cash flow statement can reveal changes in a company’s cash reserves, which provides insights into its financial flexibility. Companies with substantial cash reserves are better positioned to handle economic downturns, invest in opportunities, and return value to shareholders.
What the Cash Flow Statement Won’t Tell You About a Company
While the cash flow statement offers valuable insights into a company’s liquidity and cash management, it has its limitations:
- Profitability: The cash flow statement does not directly show a company’s profitability. A company might have strong cash flow due to one-off circumstances, like favorable working capital changes or the sale of assets, but this does not necessarily mean the core business is profitable. Investors should examine the income statement for a comprehensive view of the company’s profitability.
- Revenue and Cost Structure: The cash flow statement does not provide detailed information on revenue trends or how effectively a company manages its costs. Investors need to look at the income statement for insights into a company’s sales performance and cost management.
- Balance Sheet Details: The cash flow statement does not provide a full picture of a company’s financial position, including its assets, liabilities, and equity. To fully assess a company’s financial health, investors need to review the balance sheet and income statements.
How to Analyze a Stock’s Cash Flow Statement in 5 Minutes
You can get a good understanding of a company’s cash flow statement in under 5 minutes by answering out these 4 questions:
- Cash from Operations: How much cash did the business generate?
- Cash from Investing: What is the business investing in?
- Cash from Financing: How is the business working with investors/creditors?
- Free Cash Flow: How much cash does the business earn?
Let’s dive in!
Cash Flow From Operations
Cash Flow from Operations (CFO) reflects the cash generated by a company’s core business operations. A positive CFO indicates that the company is generating sufficient cash from its regular business activities to sustain its operations because the business is generating cash.
The formula for calculating Cash Flow from Operations (CFO), or Operating Cash Flow (OCF), starts with net income and adjusts for non-cash expenses, changes in working capital, and other operating activities. This takes a company’s reported profit and adjusts it to the actual cash flow that the company received.
Here’s the formula:
CFO = Net Income + Non-Cash Expenses + Changes in Working Capital + Other Operating Activities
Step-by-Step Breakdown:
- Net Income: The starting point is the net income from the income statement.
- Non-Cash Expenses: Add back non-cash expenses such as:
- Depreciation: The decline in the value of tangible fixed assets.
- Amortization: The decline in the value of intangible assets.
- Stock-Based Compensation: Expense recognized for stock options and other stock awards given to employees.
- Changes in Working Capital: Adjust for changes in current assets and liabilities that affect cash flow:
- Accounts Receivable: Subtract increases and add decreases. (If accounts receivable increase, then sales have been made on credit, but the cash hasn’t been received yet.)
- Inventory: Subtract increases and add decreases. (If inventory increases, it suggests that more goods have been produced or purchased than sold.)
- Accounts Payable: Add increases and subtract decreases. (If accounts payable increases, it means expenses have been incurred but not yet paid in cash.)
- Accrued Expenses: Add increases and subtract decreases.
- Other Operating Activities: Include any other adjustments needed for activities related to core operations that affect cash flow but are not captured in net income.
Example:
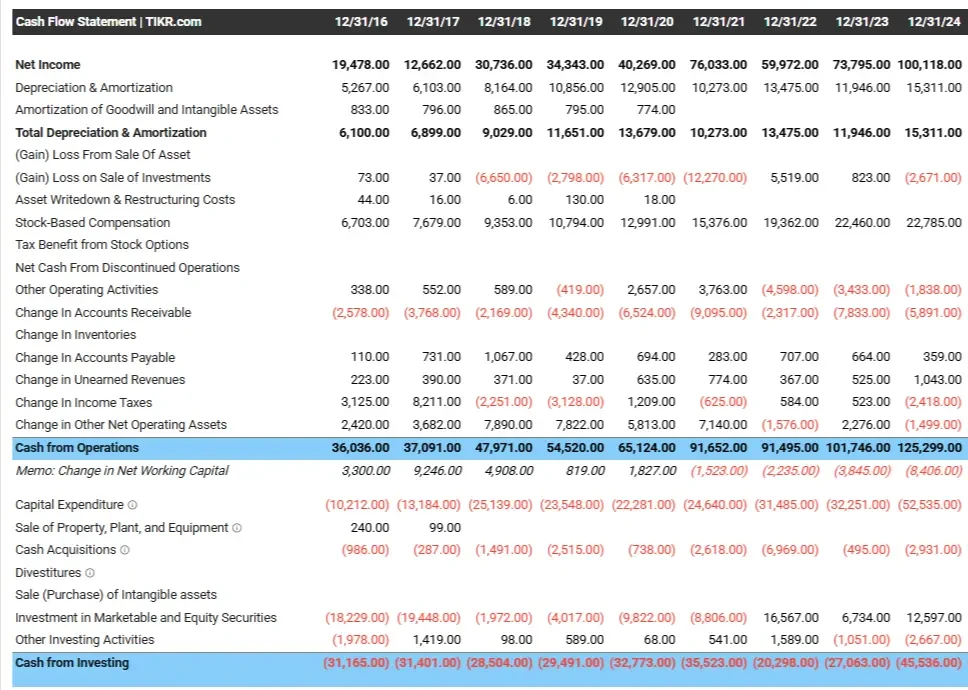
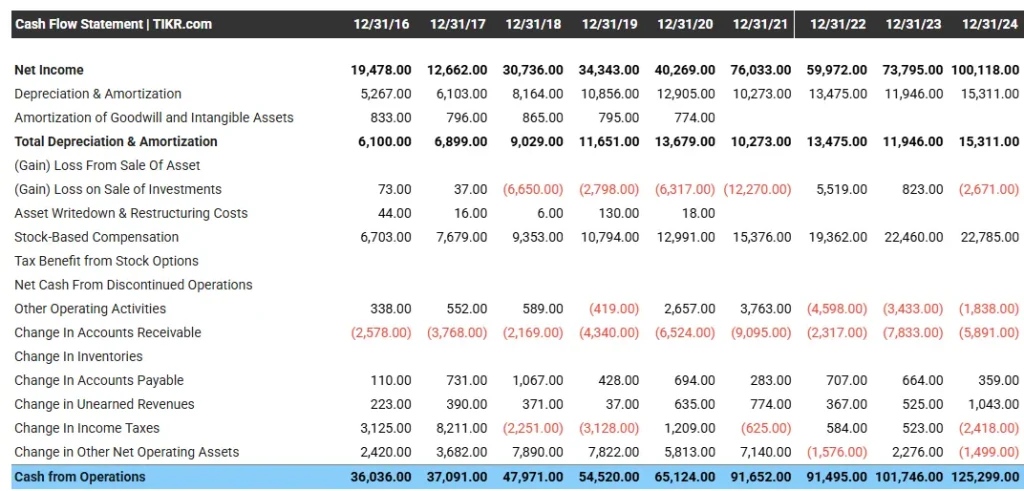
In 2024, Google made about $100 billion in net income. The cash from operations section will adjust net income to show how much cash the business made after cash expenses. Here are some of the key adjustments to net income:
- +$15.3 billion: Depreciation & Amortization measures the loss in value of tangible assets. These are non-cash expenses, so they get added back to net income.
- +$2.7 billion: The gain on the sale of investments was a non-operating cash item that was included in net income, so it gets subtracted out.
- +$22.8 billion: Stock-based compensation is a non-cash expense. Since it was already included as an expense to calculate net income, it gets added back to find Google’s operating cash flow.

Cash Flow From Investing
Cash Flow from Investing (CFI) represents the cash invested in the business or cash made from selling investments. This includes purchases or sales of long-term assets like property, plant, equipment (PP&E), and securities. Negative cash flow in this section often indicates that a company is investing in its future growth, which is generally beneficial for long-term investors.
One important line item to assess is the company’s capital expenditures. This is how much a company spends on maintaining or buying new property, plant, and equipment, and is generally a business’s biggest investment area.
Example:
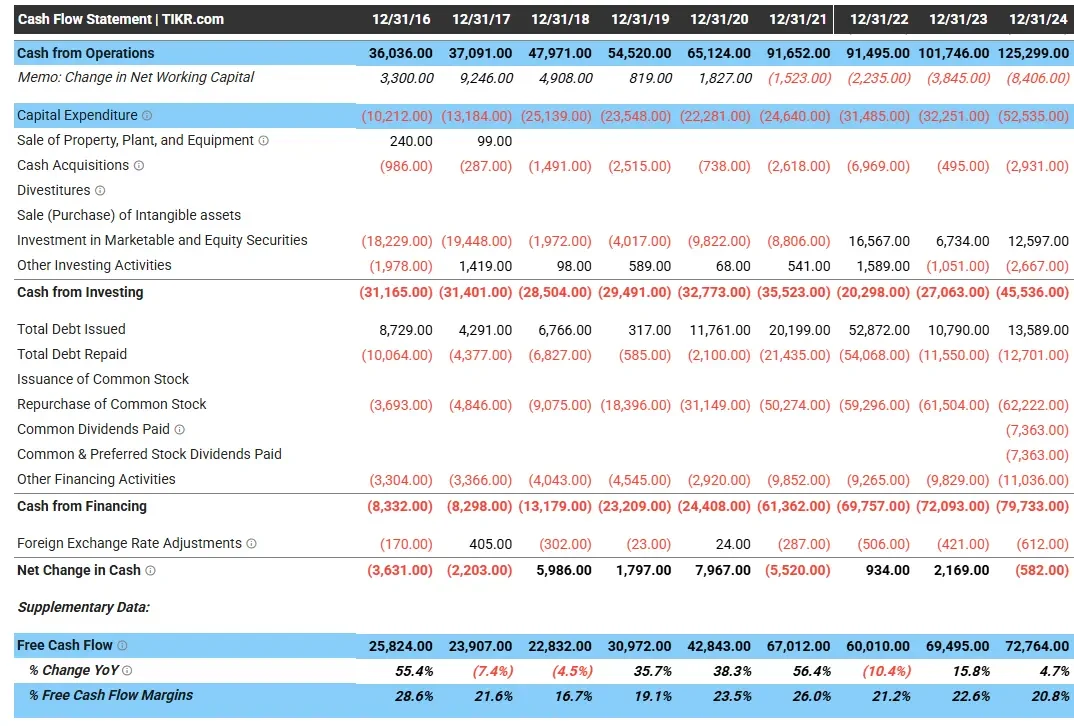
In 2024, Google spent $52.5 billion in capital expenditures, which were investments in new Property, Plant & Equipment, or replacing existing PP&E.
Google had a net spending of $2.9 billion in acquisitions and gained $12.6 billion from its investments in marketable securities.
Overall, Google had a net allocation of about $45.5 billion to investing activities, reflecting investments in Property, Plant, and Equipment, acquisitions, and other investing activities.

Cash Flow From Financing
Cash Flow from Financing (CFF) includes activities related to raising capital or returning capital to shareholders. This could involve issuing new debt or equity, repurchasing shares, or paying dividends. The financing activities section of the cash flow statement shows if the company is returning capital to shareholders.
Example:
In 2024, Google repaid a bit less debt than it borrowed. The company also bought back about $62.2 billion of its shares and spent $11.0 billion on other financing activities:

Google increased shareholder returns through share buybacks, which is generally good.
Find the best high-quality, undervalued stocks to buy today with TIKR >>>
Free Cash Flow
Free Cash Flow (FCF) is basically the company’s cash profit. FCF represents the cash a company generates after accounting for capital expenditures needed to maintain or expand its asset base.
FCF shows investors how much cash a company has available for dividends, share buybacks, debt repayment, or reinvestment into the business.
Free Cash Flow Formula
The basic formula for calculating free cash flow is:
Free Cash Flow = Cash from Operations – Capital Expenditures
Example:
In 2024, Google had $125.3 billion in cash from operations and $52.5 billion in capital expenditures, resulting in $72.8 billion in free cash flow and a 20.8% FCF margin, which is FCF as a percentage of total revenue:

Cash Flow Statement FAQs:
What is the cash flow statement?
The cash flow statement is a financial report that summarizes the cash entering and leaving a company during a specific period. It breaks the business’s cash flow into operating, investing, and financing activities.
How is cash flow different from revenue?
Cash flows differ from revenues in that they reflect actual cash moving in and out of the company rather than accounting profits. Revenue shows the total sales earned by a company, while cash flow measures liquidity. A company can report high revenue but still struggle with cash flow issues if customers delay payments or inventory levels rise unexpectedly.
What is the difference between cash flow and profit?
Profit is an accounting measure of a company’s earnings after all expenses, including non-cash items like depreciation and amortization, while cash flow measures the actual cash moving in and out of the business. A company might be profitable on paper but could struggle with liquidity if it doesn’t generate enough cash from operations.
For example, a tech company might report a profit due to high sales, but if a customer delays payments for sales, the company’s actual cash flow could be much lower, potentially causing cash shortages despite the business having strong profits on paper.
How do you read a cash flow statement?
To read a cash flow statement, you can analyze the company’s net cash flows from operating activities and look at different line items in the investing and financing activities sections. This will help you understand how the company generates and uses cash and give you a better sense of its liquidity, solvency, and overall financial health.
What does a cash flow statement show?
A cash flow statement shows the actual cash generated or used by a company from its core operations, investment activities, and financing decisions, providing insight into its cash position and financial flexibility.
TIKR Takeaway:
Analyzing a stock’s cash flow statement offers a clear view of a company’s ability to generate cash, sustain its operations, and fund its growth.
The cash flow statement also helps to show how much cash the business makes and where that cash goes.
The TIKR Terminal offers industry-leading financial information on over 100,000 stocks, helping you find the best stocks today.
TIKR offers institutional-quality research with a simple platform made for individual investors like you.
Disclaimer:
Please note that the articles on TIKR are not intended to serve as investment or financial advice from TIKR or our content team, nor are they recommendations to buy or sell any stocks. We create our content based on TIKR Terminal’s investment data and analysts’ estimates. We aim to provide informative and engaging analysis to help empower individuals to make their own investment decisions. Neither TIKR nor our authors hold positions in any of the stocks mentioned in this article. Thank you for reading, and happy investing!

