What is the Balance Sheet?
A balance sheet is a financial statement that provides a snapshot of a company’s financial position at a specific point in time. Understanding and analyzing a company’s balance sheet helps investors assess a company’s stability, growth potential, and overall financial health.
The Balance Sheet’s Key Formula
The balance sheet formula, also known as the accounting equation, is the fundamental principle behind the balance sheet:
Assets = Liabilities + Shareholders’ Equity
This formula must always balance, which means that everything that a company owns (assets) is financed either by borrowing (liabilities) or is owned by investors (equity).
Just like you can find your personal net worth by taking what you own, such as cash on hand, the value of your home, the value of your investment portfolio, etc., and subtracting what you owe, such as personal loans, student loans, car payments, mortgages, etc., a balance sheet helps to show a company’s “net worth” for investors, which is its shareholders’ equity.
It’s important to remember that a business’s shareholders’ equity differs from what the business trades for on the stock market. A business’s value on the stock market is called its market cap, and it’s calculated by multiplying the total shares outstanding by the stock’s current share price.
Analyze stocks quicker with TIKR >>>
Elements of a Balance Sheet
A balance sheet is divided into three primary sections:
Assets:
These are the resources a company owns that provide future economic benefits. Assets are classified into current and non-current assets.
- Current Assets: Include cash, accounts receivable, and inventory, which are expected to be converted into cash within a year.
- Non-Current Assets: Include long-term investments, property, plant, and equipment (PP&E), and intangible assets like patents, which support long-term business operations.
Liabilities:
These are the company’s obligations to creditors. Liabilities are divided into current and non-current liabilities.
- Current Liabilities: Include accounts payable, short-term debt, and other obligations due within a year.
- Non-Current Liabilities: Include long-term debt and other obligations that extend beyond a year, such as bonds payable.
Shareholders’ Equity:
Represents the owners’ stake in the company, which includes common stock, retained earnings, and additional paid-in capital. It reflects the net worth of the company from the shareholders’ perspective.
How to Analyze a Balance Sheet in 5 Minutes or Less
A good balance sheet alone doesn’t make a stock a good investment. However, a poor balance sheet might immediately disqualify a stock as a good investment.
These are 5 key ratios that you can use to analyze a stock’s Balance Sheet in under 5 minutes:
- Current Assets vs Current Liabilities (Can the company pay its upcoming bills?)
- Goodwill & Other Intangible Assets vs Total Assets (Is the company growing organically?)
- Total Debt vs Shareholders’ Equity (How much leverage is the company using?)
- Total Liabilities vs Shareholders’ Equity (How much leverage is the company using?)
- Retained Earnings (Is the company growing in value?)
Let’s dive in!
1. Current Assets vs. Current Liabilities

Analyze stocks quicker with TIKR >>>
The current ratio measures a company’s current assets vs current liabilities. Here’s the formula:
Current Ratio = Current Assets / Current Liabilities
It’s good to see that a company has a current ratio greater than 1, which means the business has higher current assets than current liabilities.
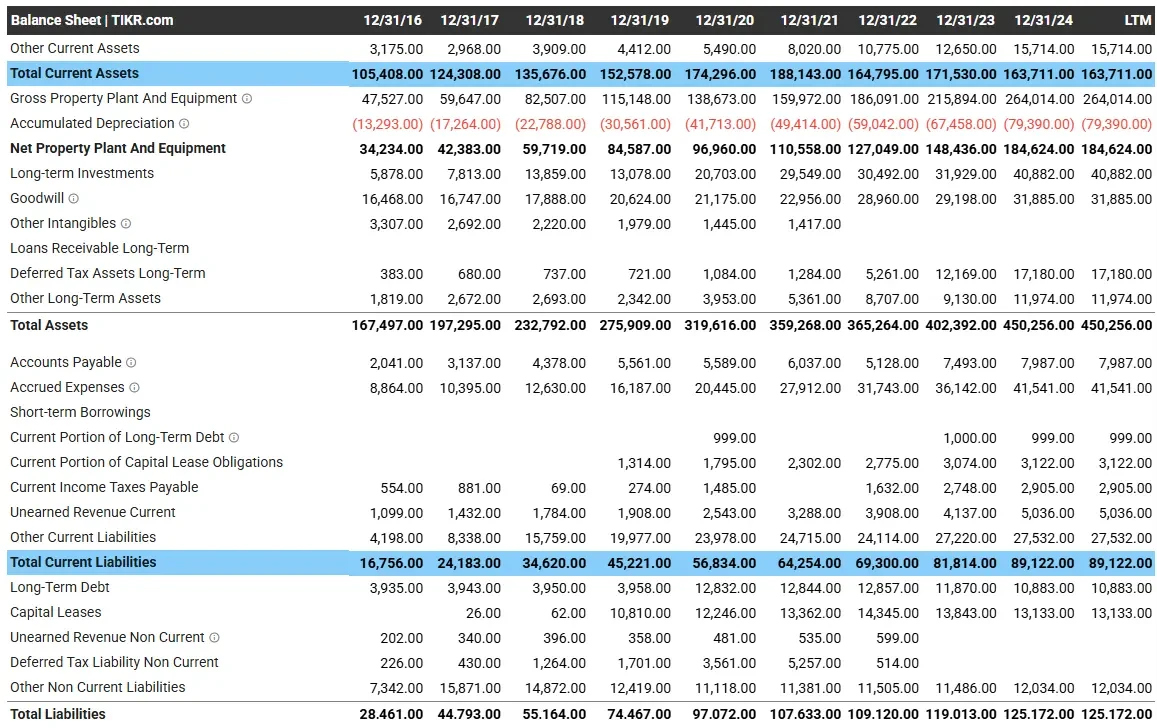
At the end of Google’s most recent fiscal year, current assets were ~$164B, while current liabilities were ~$89B.
That means that Google has a current ratio (current assets/current liabilities) of about 1.8x, which means the company has strong liquidity and can pay for all its short-term obligations.
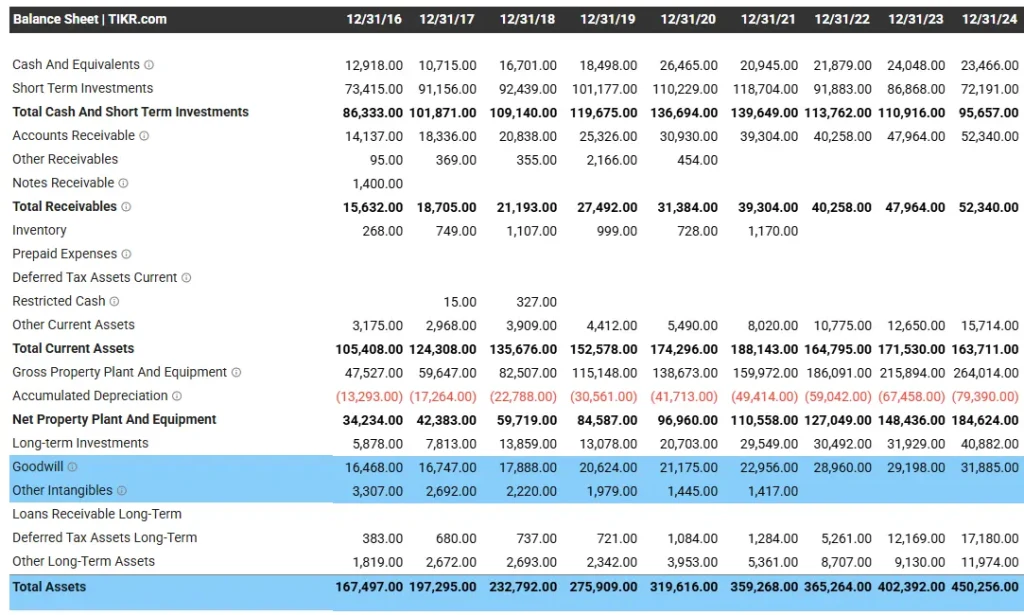
Current Assets are assets expected to be converted into cash or could be turned into cash within one year. Google’s main current assets include:
- Cash
- Marketable Securities (Short Term Investments)
- Receivables (Money owed to Google expected to be collected this year)
- Inventory
Current Liabilities are liabilities that Google will have to pay within a year. It’s important to understand that when companies owe money, it’s not inherently bad. To give you an example, Google owes a lot of money for:
- Accounts Payable: Google bought something from suppliers and will pay for it later.
- Accrued Expenses: Google must pay out salaries and other expenses.
- Unearned Revenues: Google got paid for products or services before actually fulfilling products/services.
These are all good things to owe money for because the company was able to get something valuable first and pay for it later.
TL;DR: It’s good for a business to have a current ratio greater than 1.
2. Goodwill & Intangible Assets vs Total Assets

Measuring a company’s goodwill and intangible assets vs. total assets assesses whether the business is growing organically, which means growing the core business, or inorganically, by acquiring other businesses.
What is Goodwill?
Goodwill is an intangible asset that arises when one company pays a premium to acquire another company. Goodwill is pretty common because factors such as brand reputation, customer relationships, intellectual property, and synergies tend not to show up within a company’s net assets, so it makes sense that most businesses are often acquired at a premium.
It’s usually better to see a business growing organically because acquisitions tend to carry bigger risks than organic growth. The Harvard Business Review estimates that 70-90% of acquisitions fail, so businesses making frequent, one-off acquisitions may pose a greater risk of destroying shareholder value.
At the end of the day, frequent acquisitions can be bad, and a company racking up goodwill might repeatedly be overpaying for acquisitions.
Recommended Ratio
It’s generally best to see that a business’s goodwill & other intangible assets divided by total assets are less than 0.5.
For the end of fiscal year 2024, Google had ~$32 billion in goodwill, no intangible assets, and ~$450 billion in total assets. This means that Google’s goodwill & intangibles vs total assets was under 0.1x, which is really good.
3. Debt vs Shareholders’ Equity

Next, you’ll want to compare a company’s total debt to its shareholders’ equity using the formula:
Total Debt / Equity
This ratio analyzes a company’s leverage to ensure the company has an appropriate level of debt.
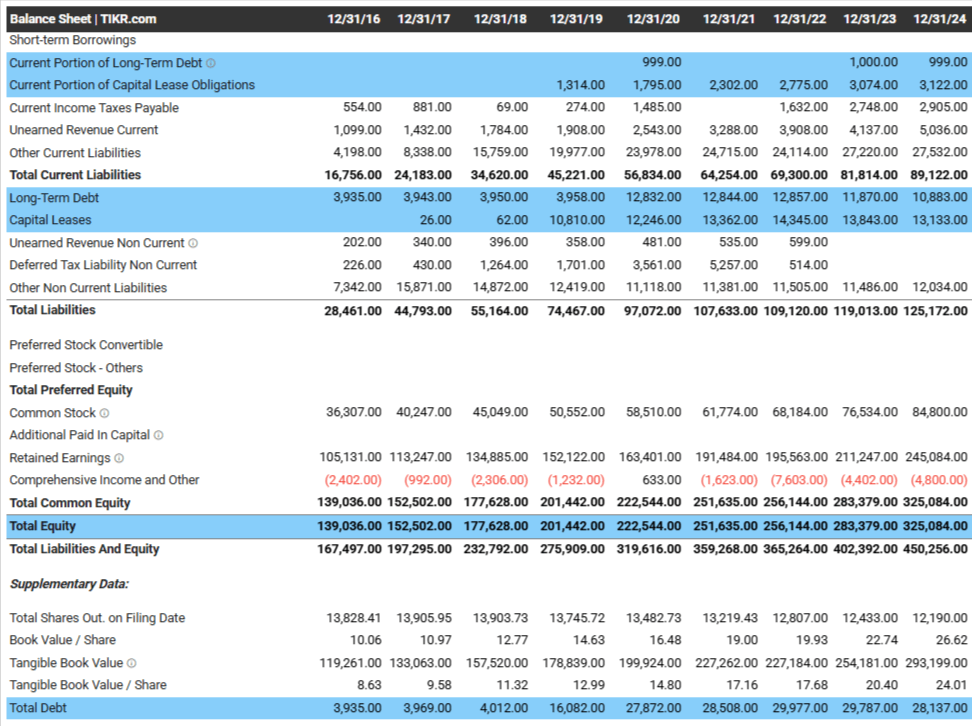
TIKR makes calculating this ratio easy because you can use the Total Debt line at the bottom of the balance sheet and compare it to the Total Equity line.
For Google, Total Debt is comprised of 4 things:
- Current Debt (Debt due in 1 year or less)
- Long-Term Debt (Debt due in over a year)
- Current Portion of Capital Lease Obligations (These are leases on office spaces, data centers, equipment, etc. Since they’re interest-bearing leases, they’re essentially debt.)
- Capital Leases (Capital leases due in over a year)
Total Equity is essentially a business’s net worth since it measures what the business owns (total assets) minus what it owes (total liabilities).
For the end of fiscal year 2024, Google had ~$28 billion in total debt and ~$325 billion in shareholders’ equity. This means that Google had a debt/equity ratio of about 0.1x, which is great.
As a general rule of thumb, you want to see companies with a debt/equity ratio of less than 0.5.
4. Total Liabilities vs Shareholders’ Equity

This ratio is similar to total debt to shareholders’ equity because it also analyzes a company’s leverage to ensure it has an appropriate debt level.
You generally want to see that a company’s total liabilities divided by total equity is less than 1.
At the end of fiscal year 2024, Google’s total liabilities were about $125 billion, while its total equity was about $325 billion.
This means that Google has a Liabilities/Equity ratio of about 0.4x, which is good because it’s below 1.
5. Retained Earnings

Last, you’ll want to see that a company’s retained earnings grow every year.
Retained earnings are profits the company retains after paying all expenses and dividends. The business can use these retained earnings to reinvest in the company, pay down debt, buy back shares, or keep on the sideline as cash.
You want to see that the business is growing retained earnings every year because that means the business makes a profit every year and grows.
Google’s retained earnings have been growing, which isn’t a surprise because the business is highly profitable.
FAQ Section:
Why is the balance sheet important for investors?
The balance sheet is important for investors because it provides a clear picture of a company’s financial position, helping them assess its stability and long-term viability.
What are the key components of a balance sheet?
The key components of a balance sheet are assets, liabilities, and shareholder equity. These provide a snapshot of what a company owns, owes, and the value of the business left to shareholders.
What does shareholder equity indicate on a balance sheet?
Shareholder equity represents the company’s net worth after liabilities are subtracted from assets. It shows the value that shareholders own in the company. This is different from the company’s market cap, which is what the company trades for on the market.
How do assets and liabilities work on a balance sheet?
Assets represent what a company owns, while liabilities reflect what the company owes. The balance sheet shows the relationship between these two, indicating the company’s financial standing.
What is the difference between current and long-term liabilities on a balance sheet?
Current liabilities are debts due within one year, while long-term liabilities are obligations that will take over a year to pay off. This distinction helps assess short-term and long-term financial obligations.
TIKR Takeaway:
Analyzing a stock’s balance sheet can help investors measure a company’s financial health and safety.
This can help investors avoid companies with crippling financial health or poor financial safety.
The TIKR Terminal offers industry-leading financial data on over 100,000 stocks, so if you’re looking to analyze stocks for your portfolio, you’ll want to use TIKR!
TIKR offers institutional-quality research for investors who think of buying stocks as buying a piece of a business.
Disclaimer:
Please note that the articles on TIKR are not intended to serve as investment or financial advice from TIKR or our content team, nor are they recommendations to buy or sell any stocks. We create our content based on TIKR Terminal’s investment data and analysts’ estimates. We aim to provide informative and engaging analysis to help empower individuals to make their own investment decisions. Neither TIKR nor our authors hold any positions in the stocks mentioned in this article. Thank you for reading, and happy investing!

