

Key Stats for The Home Depot Stock
- 52-Week Range: $289.10 – $426.75
- Current Price: $350.84
- Street Mean Target: ~$370
- TIKR Model Target: ~$535
- Annualized IRR: ~10%
- Q1 FY2026 Revenue: $41.8B (+4.8% YoY)
- Dividend Yield: 2.7%
Now Live: Discover how much upside your favorite stocks could have using TIKR’s new Valuation Model (It’s free) >>>
Comparable Sales Turned Positive for the First Time in 2 Years, But the Housing Market Remains the Constraint
Home Depot (HD) operates roughly 2,361 retail stores across the U.S., Canada, and Mexico, selling everything from lumber and plumbing to appliances and power tools. The business serves two distinct customer types: DIY homeowners tackling weekend projects and professional contractors managing larger renovation and construction jobs.
The Pro segment, which tends to drive bigger-ticket purchases and higher-margin sales, is the more important indicator of where the business is heading.
Q1 FY2026 delivered the first positive comparable sales growth in several quarters. Total comparable sales rose 0.6%, with U.S. comps up 0.4%, as the average ticket increased 2.2% even as customer transactions declined slightly.
CEO Ted Decker acknowledged the environment directly, noting that underlying demand was “relatively similar to what we saw throughout fiscal 2025, despite greater consumer uncertainty and housing affordability pressure.” CFO Richard McPhail added that the core homeowner customer “remains engaged up to a certain point,” with larger discretionary projects still being deferred.

The revenue chart clearly captures the stall. After compounding from $132B in FY2021 to $157B in FY2023, revenue dipped to $152.7B in FY2024 and is only now recovering to $159.5B. Street estimates project a more meaningful step-up beginning in FY2027 toward $171B, scaling to nearly $199B by FY2031.
That forward ramp is not modeling a Home Depot transformation. It is simply modeling what happens when existing home sales recover from their current multi-decade lows, and homeowners begin spending on renovations again at a normalized pace.
See historical and forward estimates for Home Depot stock (It’s free!) >>>
EPS Has Been Flat for 3 Years. The Forward Curve Says the Waiting Is Almost Over
The earnings chart is the most honest summary of what investors have been sitting through.
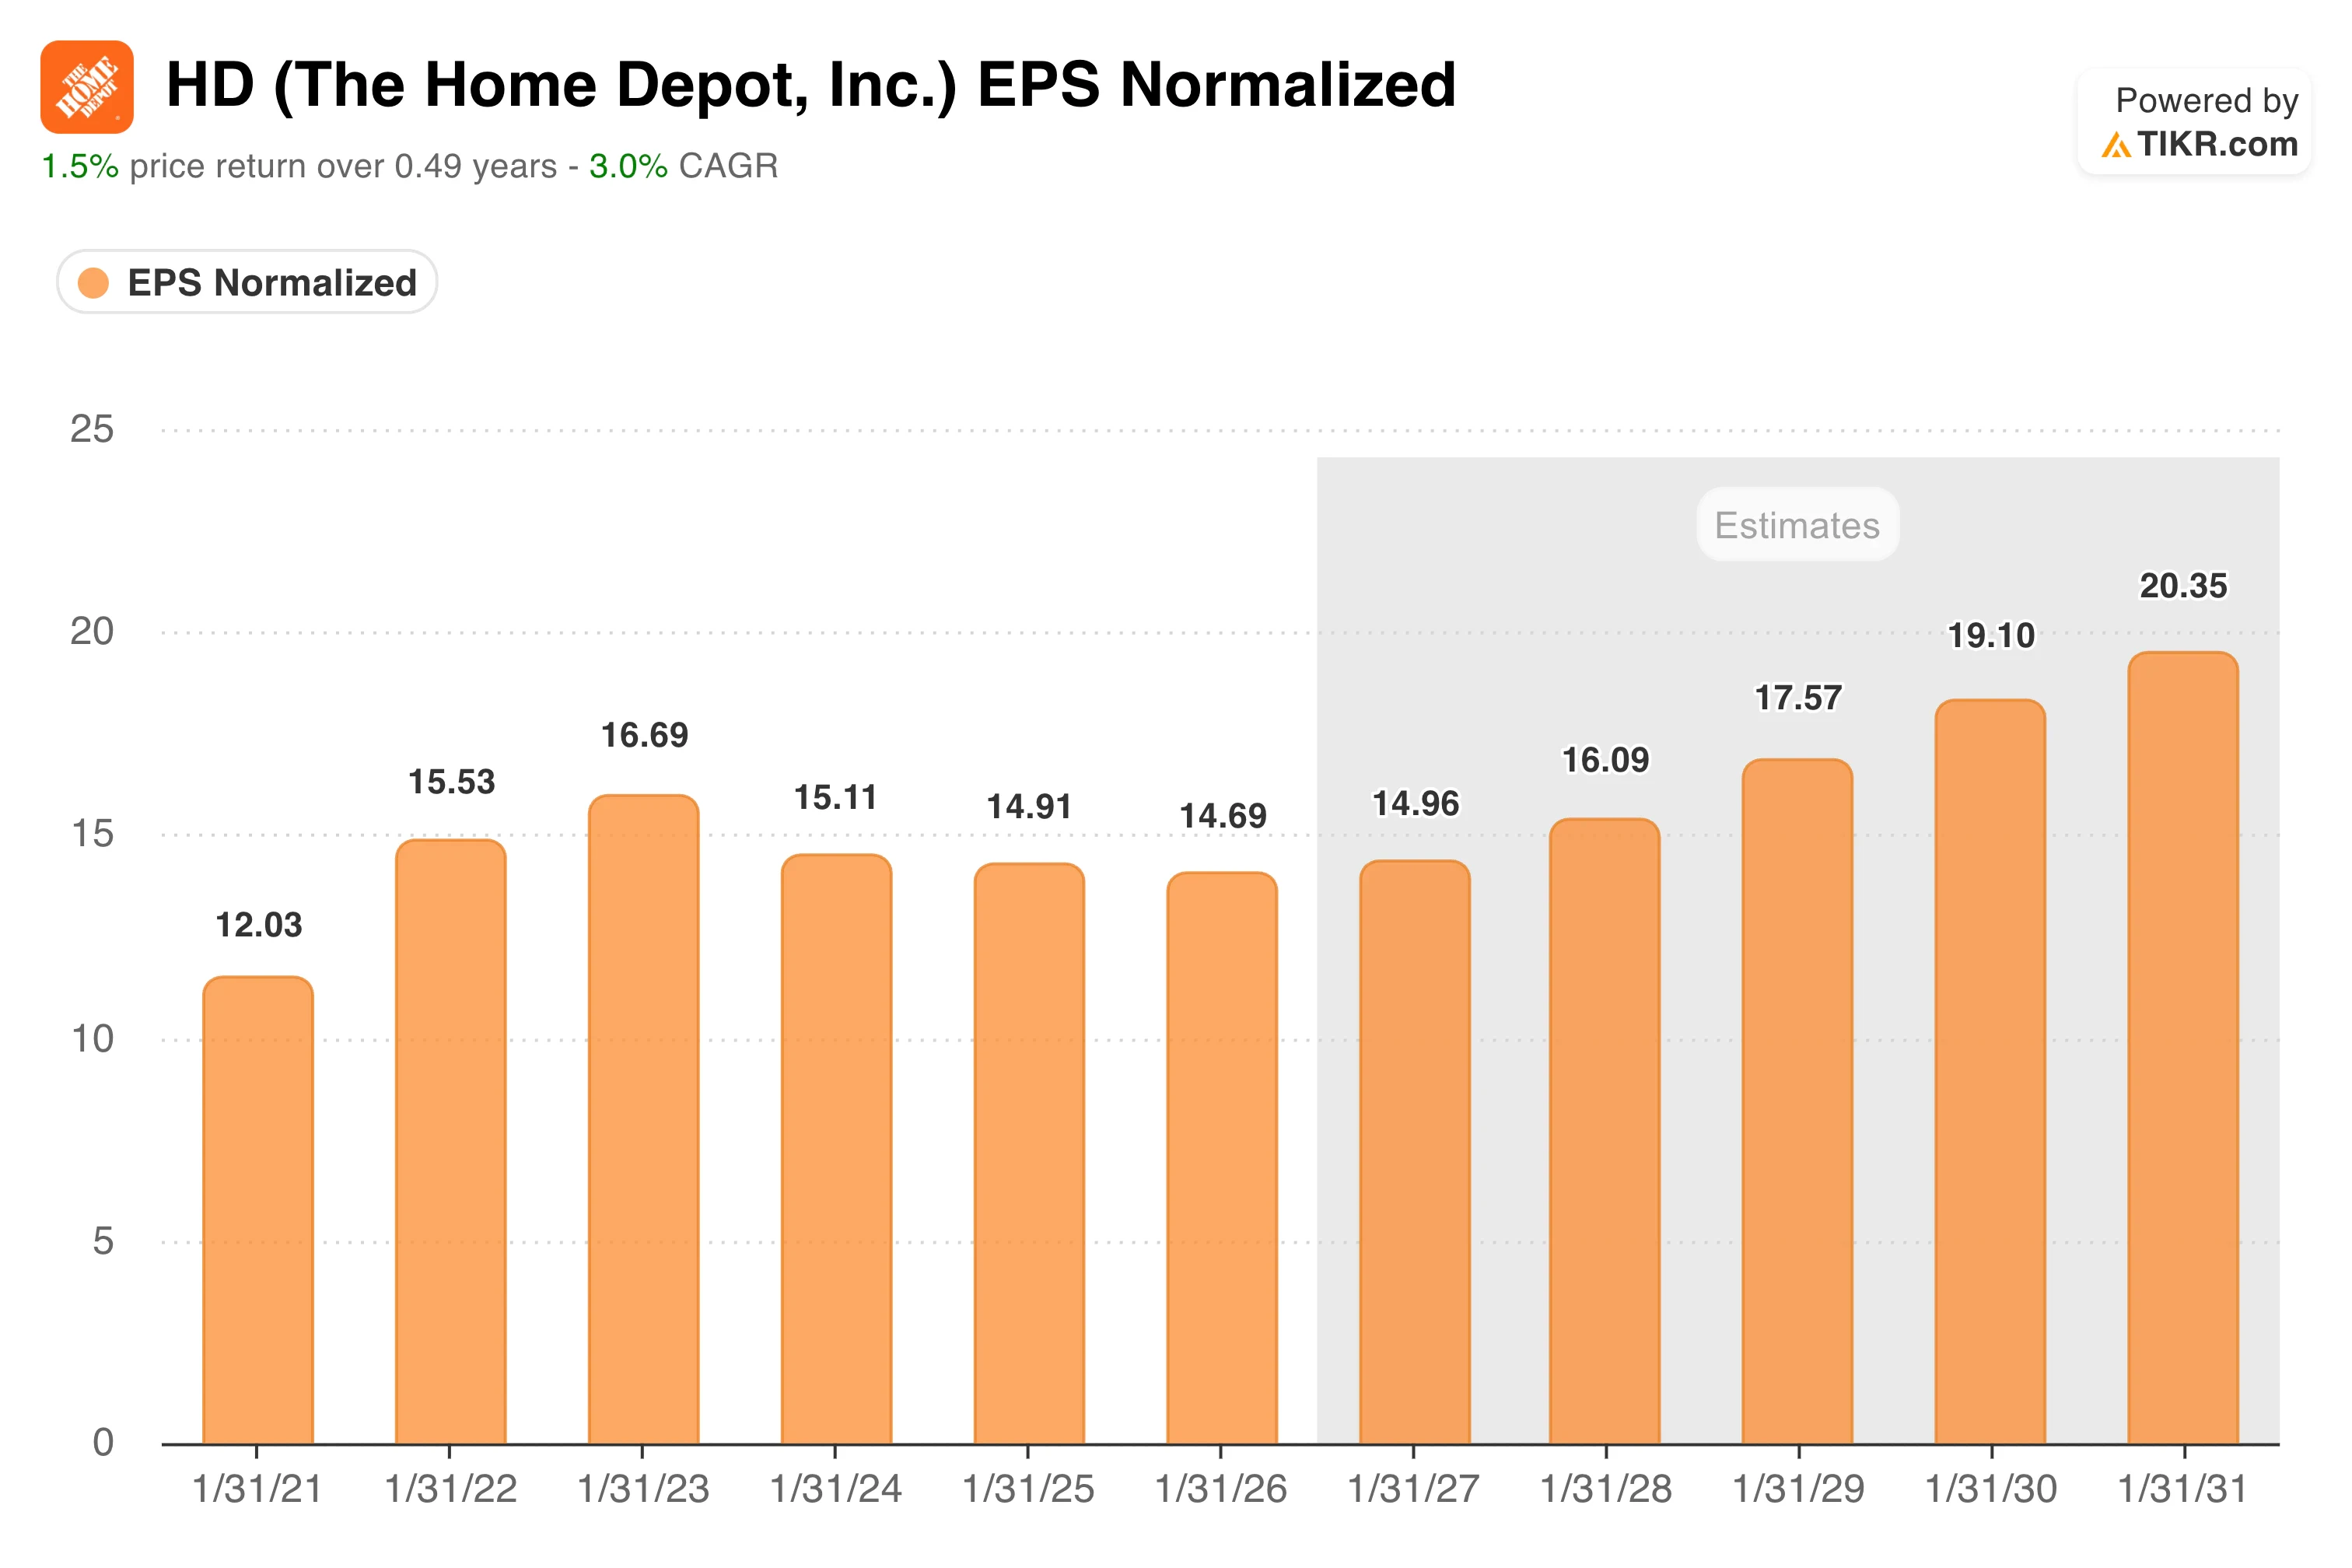
Normalized EPS peaked at $16.69 in FY2023, then compressed to $15.11 in FY2024, $14.91 in FY2025, and $14.69 in FY2026 as the housing slowdown weighed on demand and the SRS Distribution acquisition added debt and integration costs.
The Street models a modest inflection starting in FY2027 at around $14.96, building toward $16.09 in FY2028 and nearly $20 by FY2031. That is not an aggressive recovery assumption. It simply prices in a gradual normalization of housing turnover as mortgage rates ease and pent-up demand works through the system.
Lowe’s, Home Depot’s closest peer, has faced identical headwinds and reported comparable weakness, confirming that this is an industry-wide housing-cycle issue rather than a competitive share-loss story.
Home Depot’s Pro business continued to outperform DIY in Q1, which matters because Pro customers are generally less rate-sensitive and more tied to repair and remodel activity that happens regardless of whether homes are changing hands.
See how Home Depot performs against its peers in TIKR (It’s free!) >>>
TIKR’s Model Targets Around $535, Assuming Patient Capital and a Housing Recovery
The TIKR valuation model targets approximately $535 per share for Home Depot, implying a total return of around 53% over 4.6 years and an annualized IRR of roughly 10%.

The mid-case assumptions are deliberately conservative: around 3.4% annual revenue growth and net income margins near 10%, both of which are consistent with Home Depot’s historical performance in a normalized housing environment. The model reaches $679 by January 2035 in the mid case, with the high case at around $806.
Neither scenario requires the housing market to boom. They simply require it to stop being broken. At roughly 23x NTM earnings with a 2.7% dividend yield, Home Depot is not cheap in absolute terms, but it trades at a meaningful discount to its own historical multiple and well below its level when housing was last functioning normally.
The Street’s mean target of around $370 implies modest near-term upside, reflecting the same tension: the business is excellent, the setup is constructive, and the catalyst depends on forces outside management’s control.
Should You Invest in The Home Depot, Inc.?
Home Depot is one of the highest quality retailers in the world, operating with durable competitive advantages, consistent cash generation, and a balance sheet that can absorb the current cycle. The investment case is straightforward: you are buying a best-in-class business at a trough valuation and waiting for housing to recover.
How long that wait lasts is the only real question. TIKR gives you the tools to track the comparable sales trends and margin data that will signal when the turn arrives.
See analysts’ growth forecasts and price targets for Home Depot stock (It’s free!) >>>
Looking for New Opportunities?
- See what stocks billionaire investors are buying so you can follow the smart money.
- Analyze stocks in as little as 5 minutes with TIKR’s all-in-one, easy-to-use platform.
- The more rocks you overturn… the more opportunities you’ll uncover. Search 100K+ global stocks, global top investor holdings, and more with TIKR.
Disclaimer:
Please note that the articles on TIKR are not intended to serve as investment or financial advice from TIKR or our content team, nor are they recommendations to buy or sell any stocks. We create our content based on TIKR Terminal’s investment data and analysts’ estimates. Our analysis might not include recent company news or important updates. TIKR has no position in any stocks mentioned. Thank you for reading, and happy investing!


