
Key Stats for Amazon Stock
- This Week Performance: 6%
- 52-Week Range: $161 to $259
- Current Price: $210
What Happened to Amazon Stock?
Amazon (AMZN) shares climbed 2.6% to $210 yesterday, as the Supreme Court’s ruling against Trump tariffs lifted broad market sentiment while Moody’s simultaneously affirmed Amazon’s A1 credit rating, both landing within the same trading session.
Moody’s affirmed Amazon’s A1 rating but shifted the outlook to Stable, noting that Amazon’s planned capital spending acceleration of over 50% to approximately $200 billion will outpace what the company’s current cash flow generation can fully support.
The spending plan is anchored almost entirely in AWS, which posted 24% revenue growth in Q4 2025 on a $142 billion annualized run rate, the fastest growth in 13 quarters, driven by accelerating demand for both core cloud migration and AI workloads including Bedrock, Trainium, and agentic services.
Consequently, the market is beginning to re-rate Amazon less as a retail giant and more as an AI infrastructure company, given that AWS operating income hit $12.5 billion in Q4 and its backlog surged 40% year-over-year to $244 billion.
Amazon CEO Andrew Jassy stated on the Q4 2025 earnings call that “as fast as we install this AI capacity, we are monetizing it,” with Trainium2 already underpinning the majority of Bedrock usage and nearly all Trainium3 supply expected to be committed by mid-2026.
Additionally, institutional conviction is building, with Pershing Square raising its Amazon stake 65% to 9.6 million shares and Coatue raising its position 13.6% to 9.9 million shares, both as of December 31, 2025, even as Berkshire cut its stake by 77.2%.
The bigger picture shows Amazon building one of the most vertically integrated AI stacks in the industry, combining proprietary chips, cloud infrastructure, agentic tools, and a 300-million-user retail AI layer, positioning it to compound returns well beyond the current capex cycle.
Wall Street’s Take on AMZN Stock
Despite Moody’s flagging that Amazon’s $200 billion capex plan exceeds current cash flow generation, the market is treating the spend as a forward revenue signal rather than a balance sheet risk, given AWS backlog already sits at $244 billion and is growing 40% year-over-year.
The fundamental case centers on EBITDA margins expanding to a projected 26.1% in 2026, up from 23.7% in 2025, while revenue grows 12.5% to $806.77 billion, showing that Amazon stock is scaling profitability faster than it is scaling costs despite the aggressive infrastructure buildout.
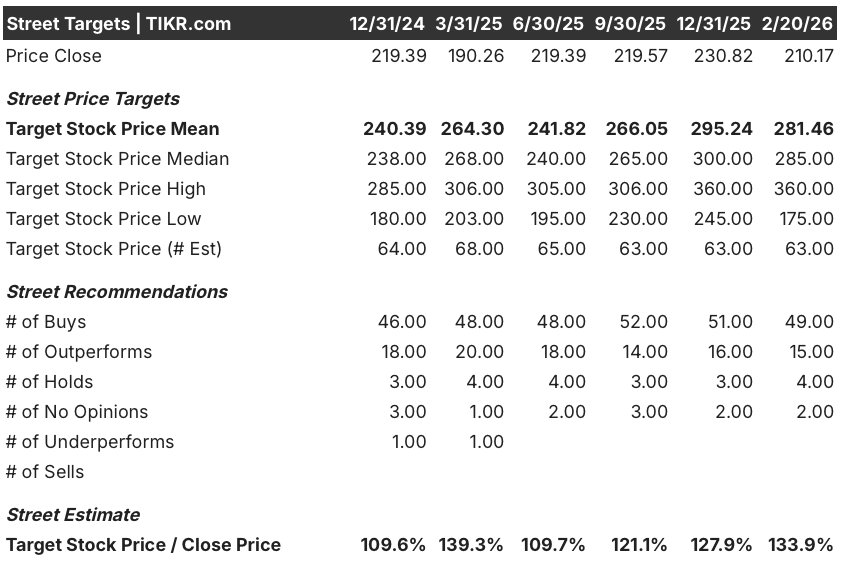
Wall Street stands firmly behind the stock, with 49 buy ratings and a mean price target of $281.46 as of February 20, representing approximately 34% upside from the current price of $210.17 across 63 estimates.
The target range spans $175 on the low end to $360 on the high end, meaning the bull case prices in a stock trading at nearly 71% above current levels while even the most cautious analysts see minimal downside from here.
What Does the Valuation Model Say?
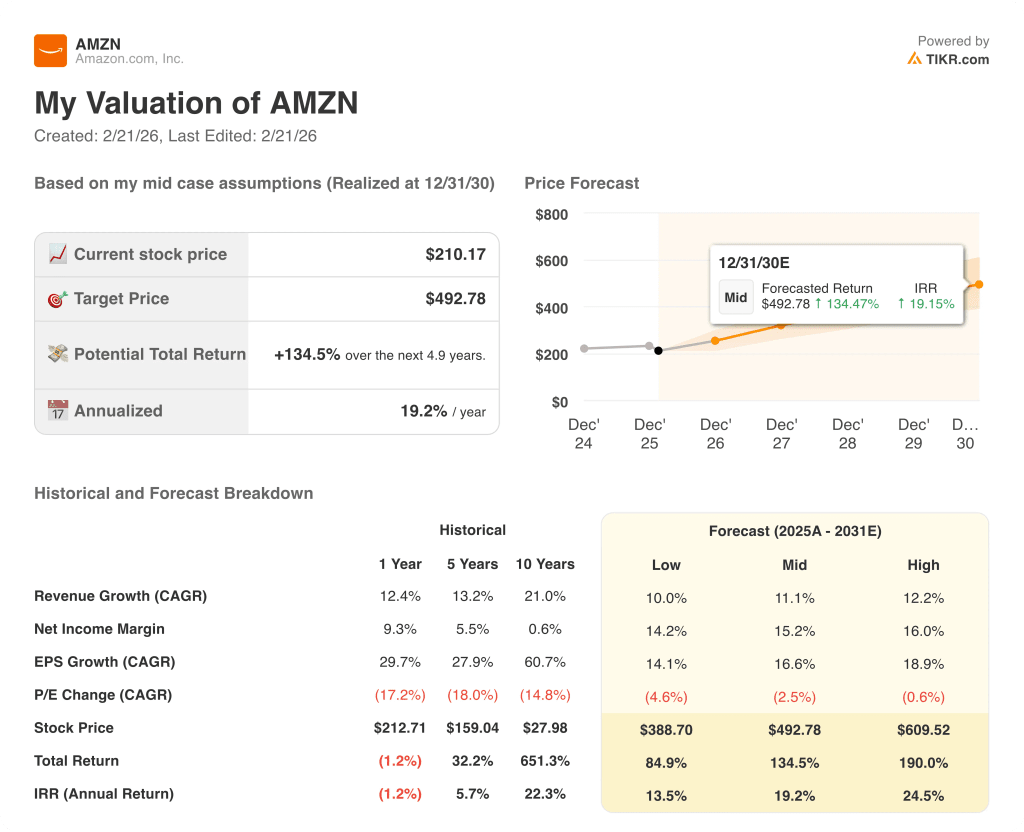
A mid-case valuation model, built against the backdrop of AWS’s accelerating AI monetization and Amazon’s $244 billion backlog, prices AMZN at $492.78 by December 2030, implying a 134.5% total return and a 19.2% annualized IRR from current levels.
The primary risk is P/E multiple compression, with the model projecting a negative 2.5% annual P/E CAGR through 2031, meaning Amazon’s earnings growth must outpace a shrinking multiple, a dynamic Moody’s essentially flagged by changing the outlook to Stable.
At $210 with a Street mean of $281 and a mid-case model pointing to $492.78, Amazon stock looks meaningfully undervalued relative to both near-term analyst consensus and long-term fundamentals, particularly given the accelerating AWS growth trajectory.
Value Any Stock in Under 60 Seconds (It’s Free)
With TIKR’s new Valuation Model tool, you can estimate a stock’s potential share price in under a minute.
All it takes is three simple inputs:
- Revenue Growth
- Operating Margins
- Exit P/E Multiple
From there, TIKR calculates the potential share price and total returns under Bull, Base, and Bear scenarios so you can quickly see whether a stock looks undervalued or overvalued.
If you’re not sure what to enter, TIKR automatically fills in each input using analysts’ consensus estimates, giving you a quick, reliable starting point.