
Key Stats for GWW Stock
- Past-6-Month Performance: 10%
- 52-Week Range: $894 to $1,219
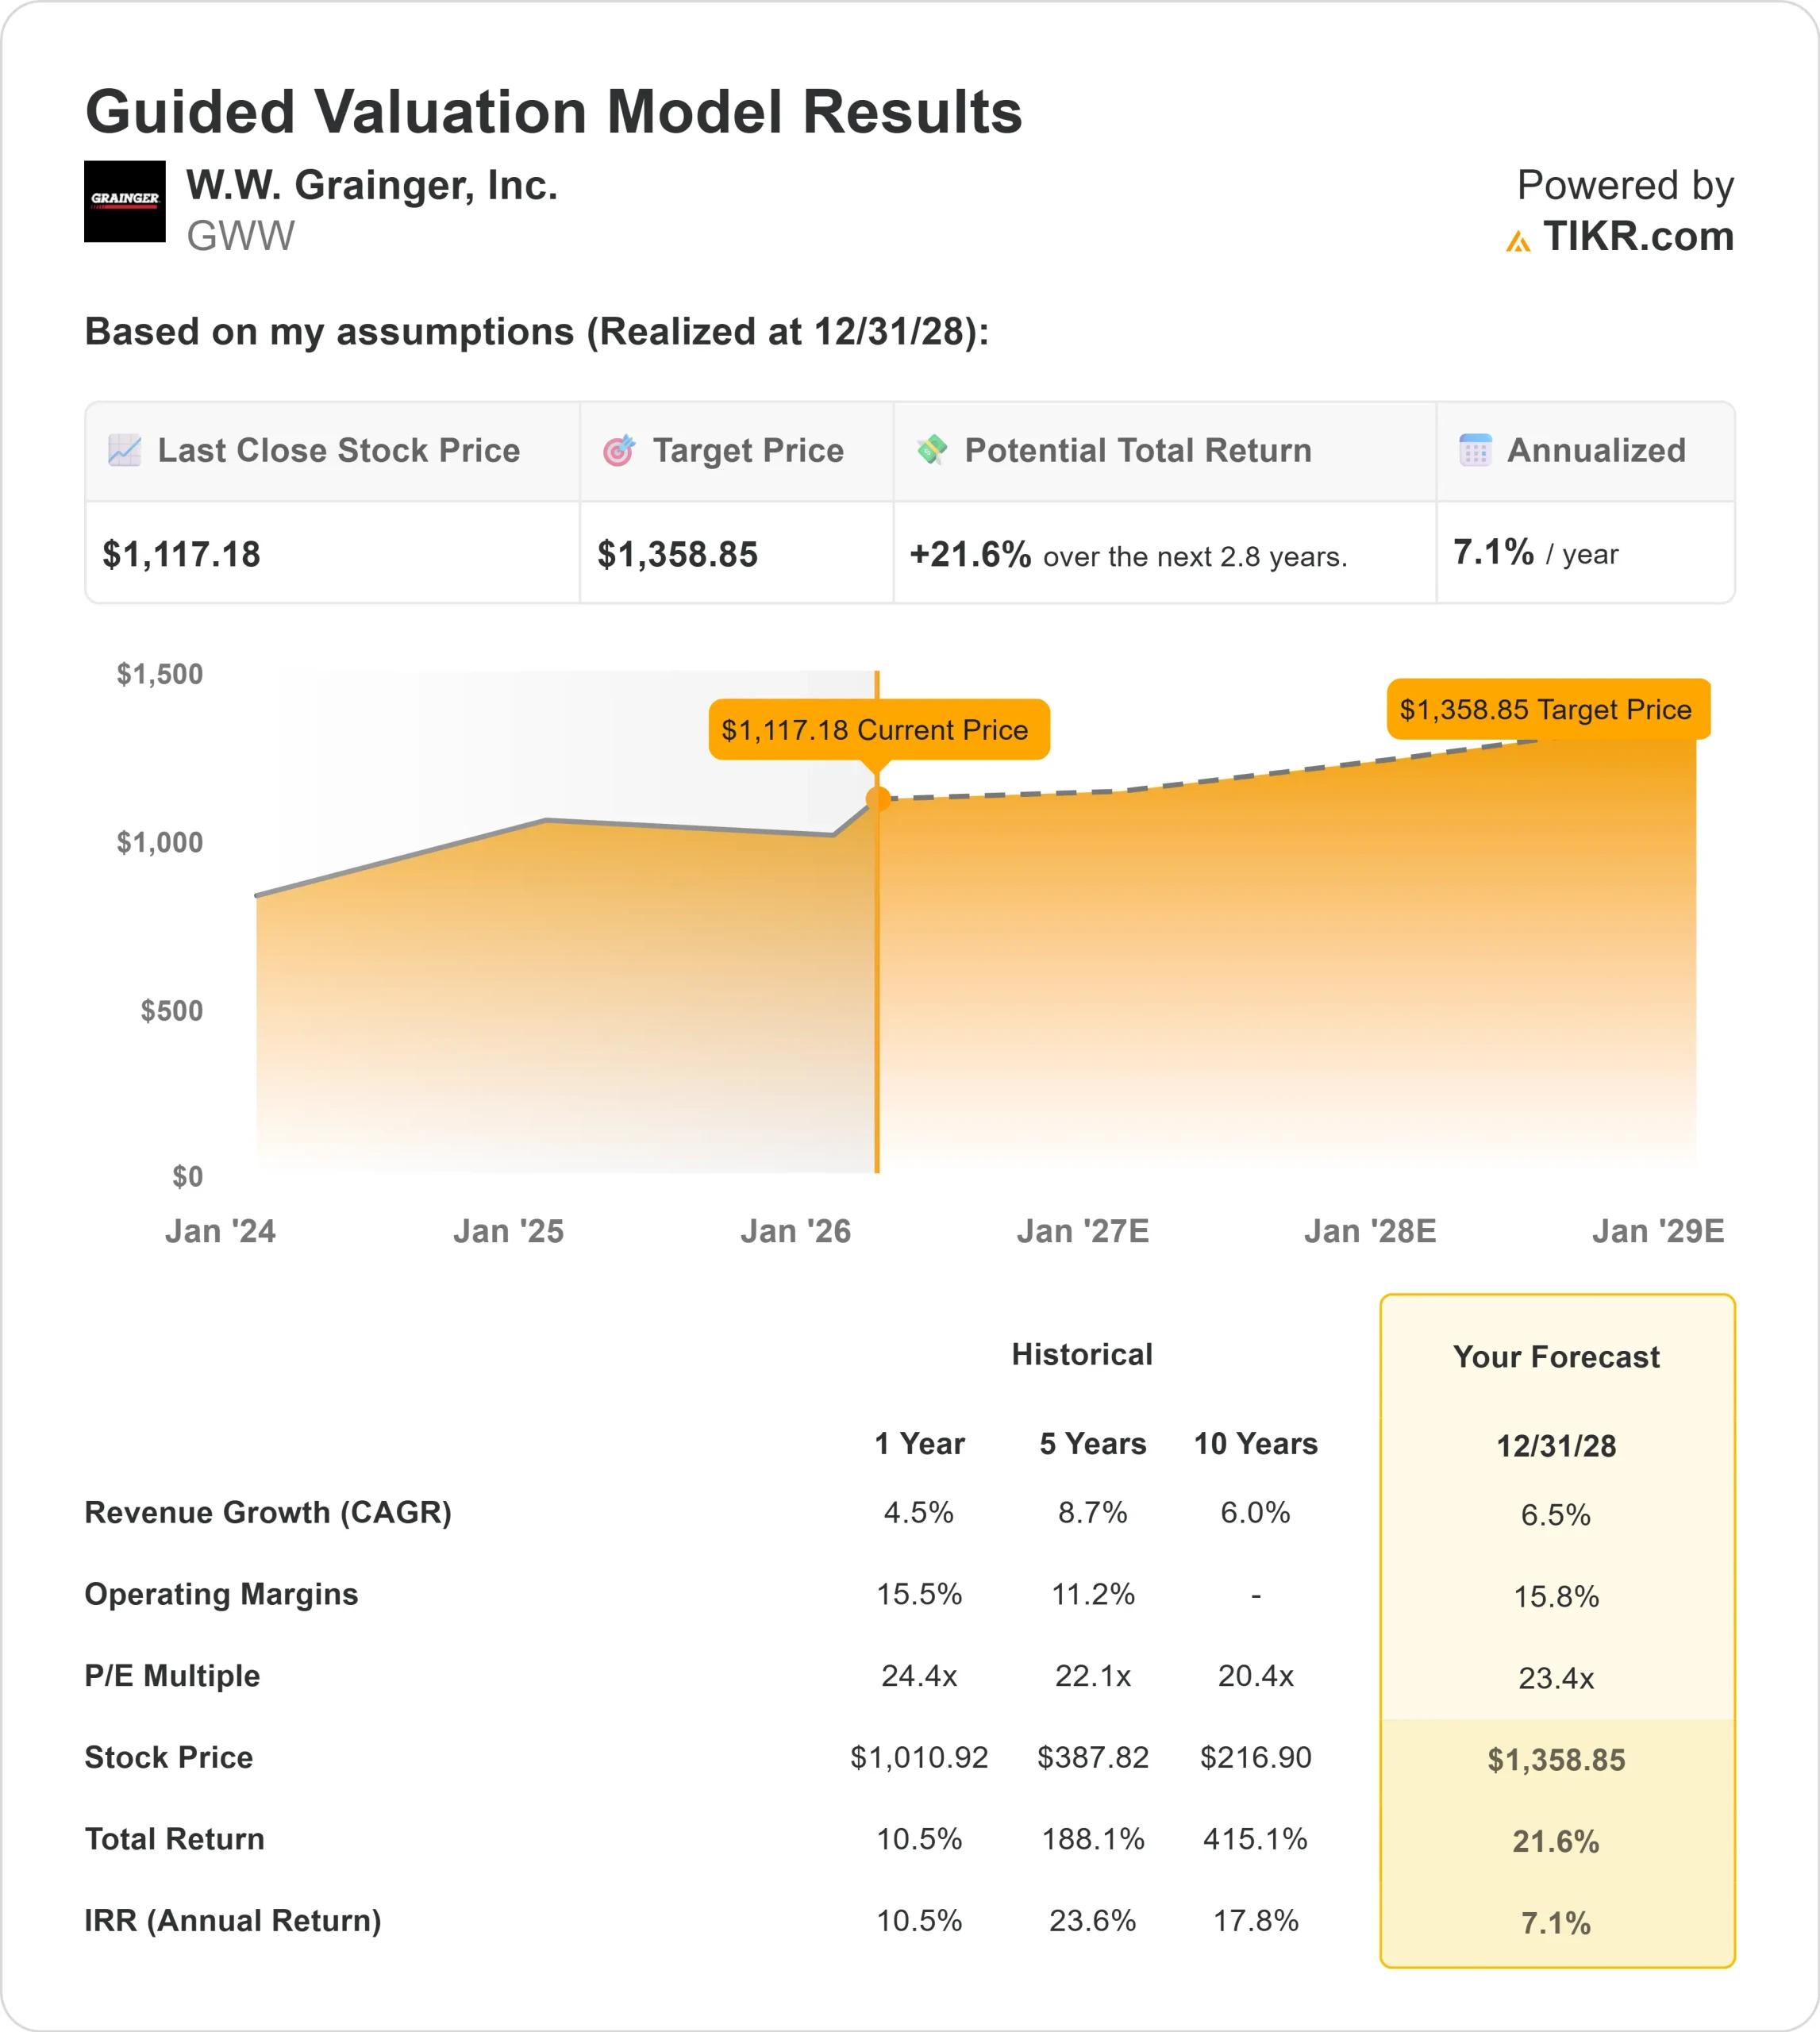
- Valuation Model Target Price: $1,359
- Implied Upside: 22%
Value your favorite stocks like W.W. Grainger with 5 years of analysts’ forecasts using TIKR’s new Valuation Model (It’s free) >>>
What Happened?
W.W. Grainger stock shares are up about 10% over the last six months, recently trading near $1,117 per share as investors responded to stronger earnings visibility, accelerating Endless Assortment growth, and constructive 2026 guidance.
The steady climb has pushed the stock toward the upper end of its $894 to $1,219 52-week range, reflecting sustained demand rather than a short-lived bounce.
The stock moved higher primarily because investors gained confidence in earnings durability after Grainger delivered solid 2025 results and guided to double-digit EPS growth in 2026.
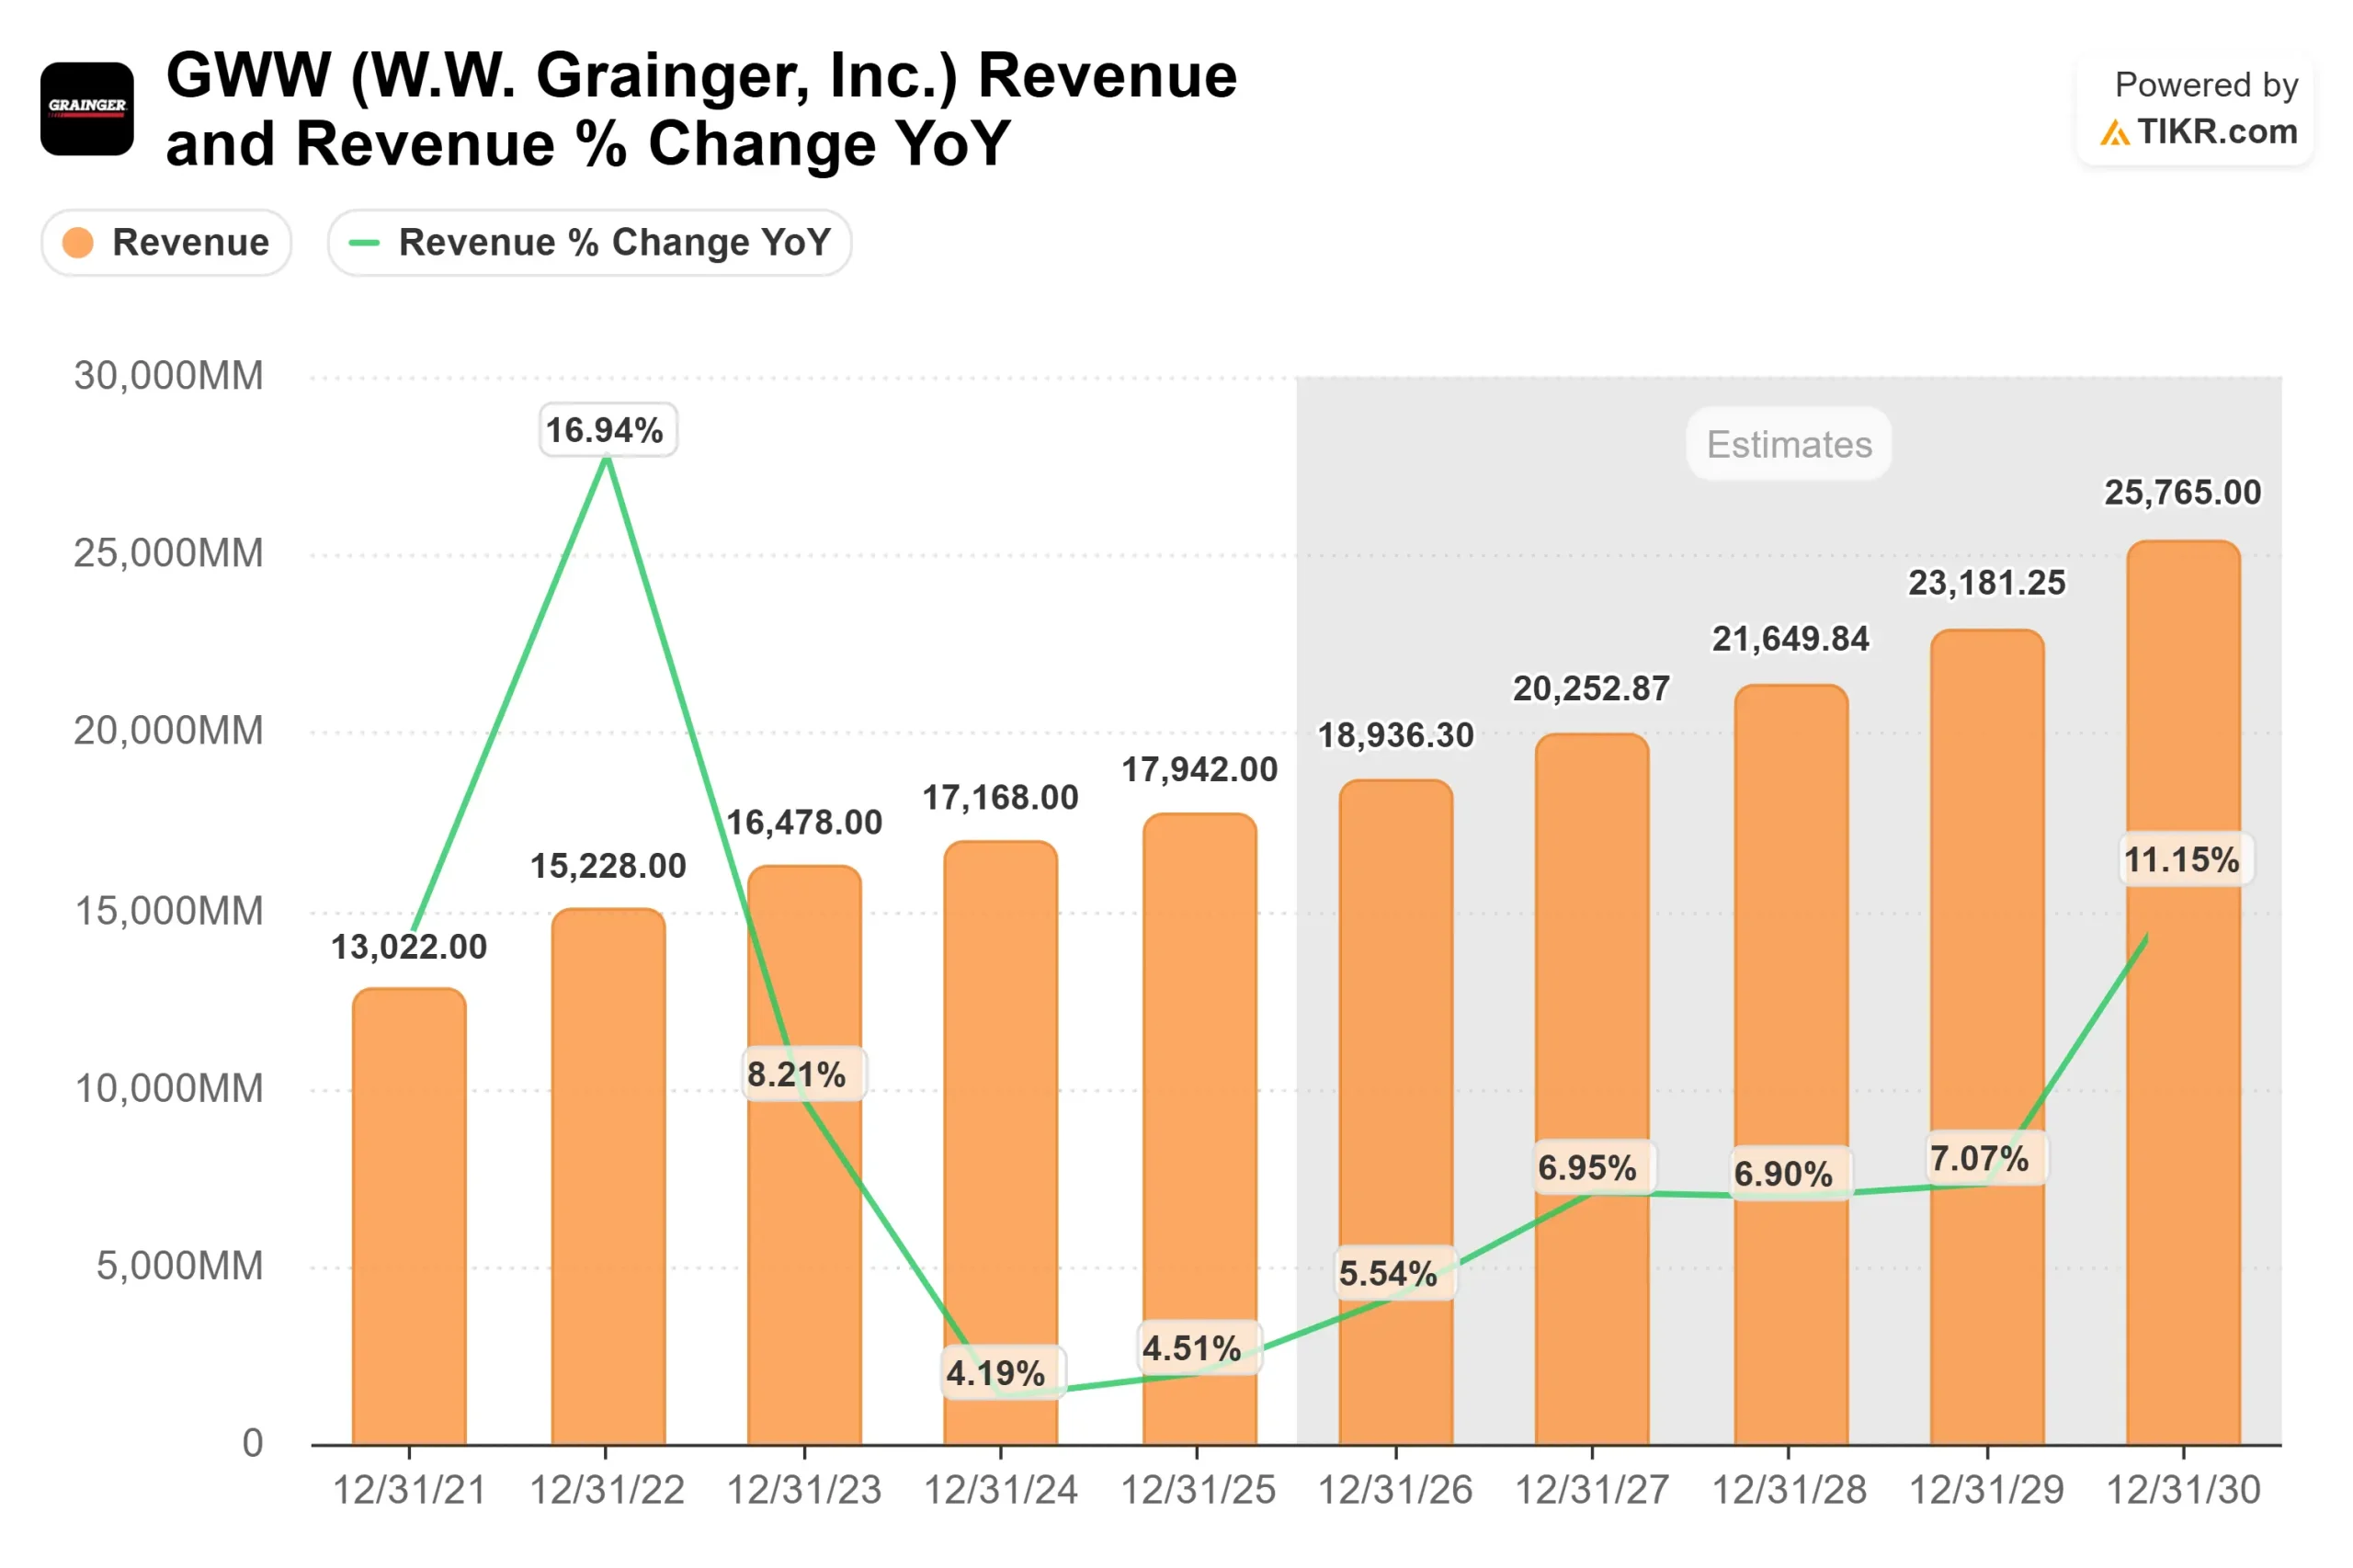
The company reported full-year 2025 sales of $17.9 billion, up 4.5%, operating margin of 15%, and adjusted EPS of $39.48, up 1.3%.
Management guided 2026 revenue to $18.7 billion to $19.1 billion and EPS to $42.25 to $44.75, implying over 10% growth at the midpoint.
Fourth quarter daily sales rose 4.5% with gross margin at 39.5%, and preliminary January daily organic constant currency sales increased over 10%, reinforcing momentum entering 2026.
CEO D.G. Macpherson said the company is “poised to deliver continued growth, share gain and strong returns for our stakeholders.”
Institutional positioning added support to the move. ABN Amro Investment Solutions boosted its stake by 974.3%, purchasing 50,030 shares to hold 55,165 shares valued at about $52.57 million. NEOS Investment Management increased its stake by 339.9%, adding 2,077 shares.
Vanguard raised its position by 1.9% to 5,731,880 shares, representing about 12.05% of the company. At the same time, Skandinaviska Enskilda Banken cut its stake by 68.3% and Shell Asset Management reduced its position by 55.7%, reflecting selective trimming but continued engagement from large holders.
Overall, the stock’s six-month advance reflects improving growth in Endless Assortment, steady High-Touch share gains, and clearer 2026 margin recovery rather than speculative multiple expansion alone.
See analysts’ growth forecasts and price targets for W.W. Grainger (It’s free) >>>
Is GWW Undervalued?
Under valuation assumptions, the stock is modeled using:
- Revenue Growth (CAGR): 6.5%
- Operating Margins: 15.8%
- Exit P/E Multiple: 23.4x
Grainger’s long-term outlook is supported by continued share gains in High-Touch Solutions and sustained double-digit growth in Endless Assortment.
In 2025, Endless Assortment daily organic constant currency sales rose 15.6%, with segment operating margin improving 200 basis points to 10.6%. Zoro and MonotaRO both delivered high-teens growth, supported by improved repeat rates, enterprise customer expansion, and supply chain efficiency.
In High-Touch, management estimates roughly 250 basis points of volume outgrowth versus its multifactor MRO model in 2025, signaling continued market share gains despite muted industry conditions.
Pricing actions to offset tariff costs have largely been implemented, and LIFO headwinds are expected to subside in the second half of 2026, supporting gross margin recovery.
Total company operating margin is guided to 15.4% to 15.9% in 2026, up 40 to 90 basis points from 2025.
Based on these assumptions, the valuation framework implies a target price of $1,359, representing about 22% total upside from current levels near $1,117.
At current levels, Grainger appears modestly undervalued, with 2026 performance likely driven by digital penetration, supply chain leverage, pricing normalization, and sustained share gains rather than rapid top-line acceleration alone.
Estimate a company’s fair value instantly (Free with TIKR) >>>
Value Any Stock in Under 60 Seconds (It’s Free)
With TIKR’s new Valuation Model tool, you can estimate a stock’s potential share price in under a minute.
All it takes is three simple inputs:
- Revenue Growth
- Operating Margins
- Exit P/E Multiple
From there, TIKR calculates the potential share price and total returns under Bull, Base, and Bear scenarios so you can quickly see whether a stock looks undervalued or overvalued.
If you’re not sure what to enter, TIKR automatically fills in each input using analysts’ consensus estimates, giving you a quick, reliable starting point.
See a stock’s true value in under 60 seconds (Free with TIKR) >>>