


Key Stats for DAL Stock
- Past week performance: -2.9%
- 52-week range: $55.03 to $95.68
- Valuation model target price: $85.34
- Implied upside: 6.6% over 2.3 years
See where Delta could trade next with TIKR’s Guided Valuation Model (It’s free) >>>
Beating Guidance With Fuel Working Against It
Delta Air Lines (DAL) posted Q2 results that beat its own prior guidance, even as fuel costs jumped nearly $2 billion from a year earlier. Revenue reached $17.7 billion, up 14%, while earnings per share of $1.56 came in above the top end of Delta’s $1.00 to $1.50 guidance range.

Delta is one of the largest U.S. airlines, and it has spent recent years pushing further into premium seating and loyalty programs to diversify away from ticket sales alone. That strategy showed up clearly this quarter, with an 8.8% adjusted operating margin that outperformed the company’s own outlook, driven largely by pricing power rather than passenger volume growth.
Premium ticket revenue reached $6.92 billion, actually surpassing main cabin revenue of $6.85 billion for the quarter. Premium and loyalty revenue combined grew nearly 20% from a year earlier, while Delta’s co-branded credit card partnership with American Express is expected to generate around $9 billion in 2026, up 10%.
CEO Ed Bastian tied the results directly to that diversification. “We delivered $1.4 billion in pre-tax profit while absorbing the highest quarterly fuel expense in our history,” Bastian said, pointing to broad demand strength and growing brand preference as the offsetting forces.
Management reaffirmed full-year adjusted earnings per share guidance of $6.50 to $7.50 and free cash flow of $3 billion to $4 billion, betting that fare increases can keep pace with elevated fuel prices through the rest of the year.
If fuel costs stabilize from here, Delta’s premium-heavy revenue mix could translate into faster margin expansion than the broader industry sees.
Compare your own fuel cost assumptions against Delta’s guidance (It’s free) >>>
Is DAL Stock Undervalued?
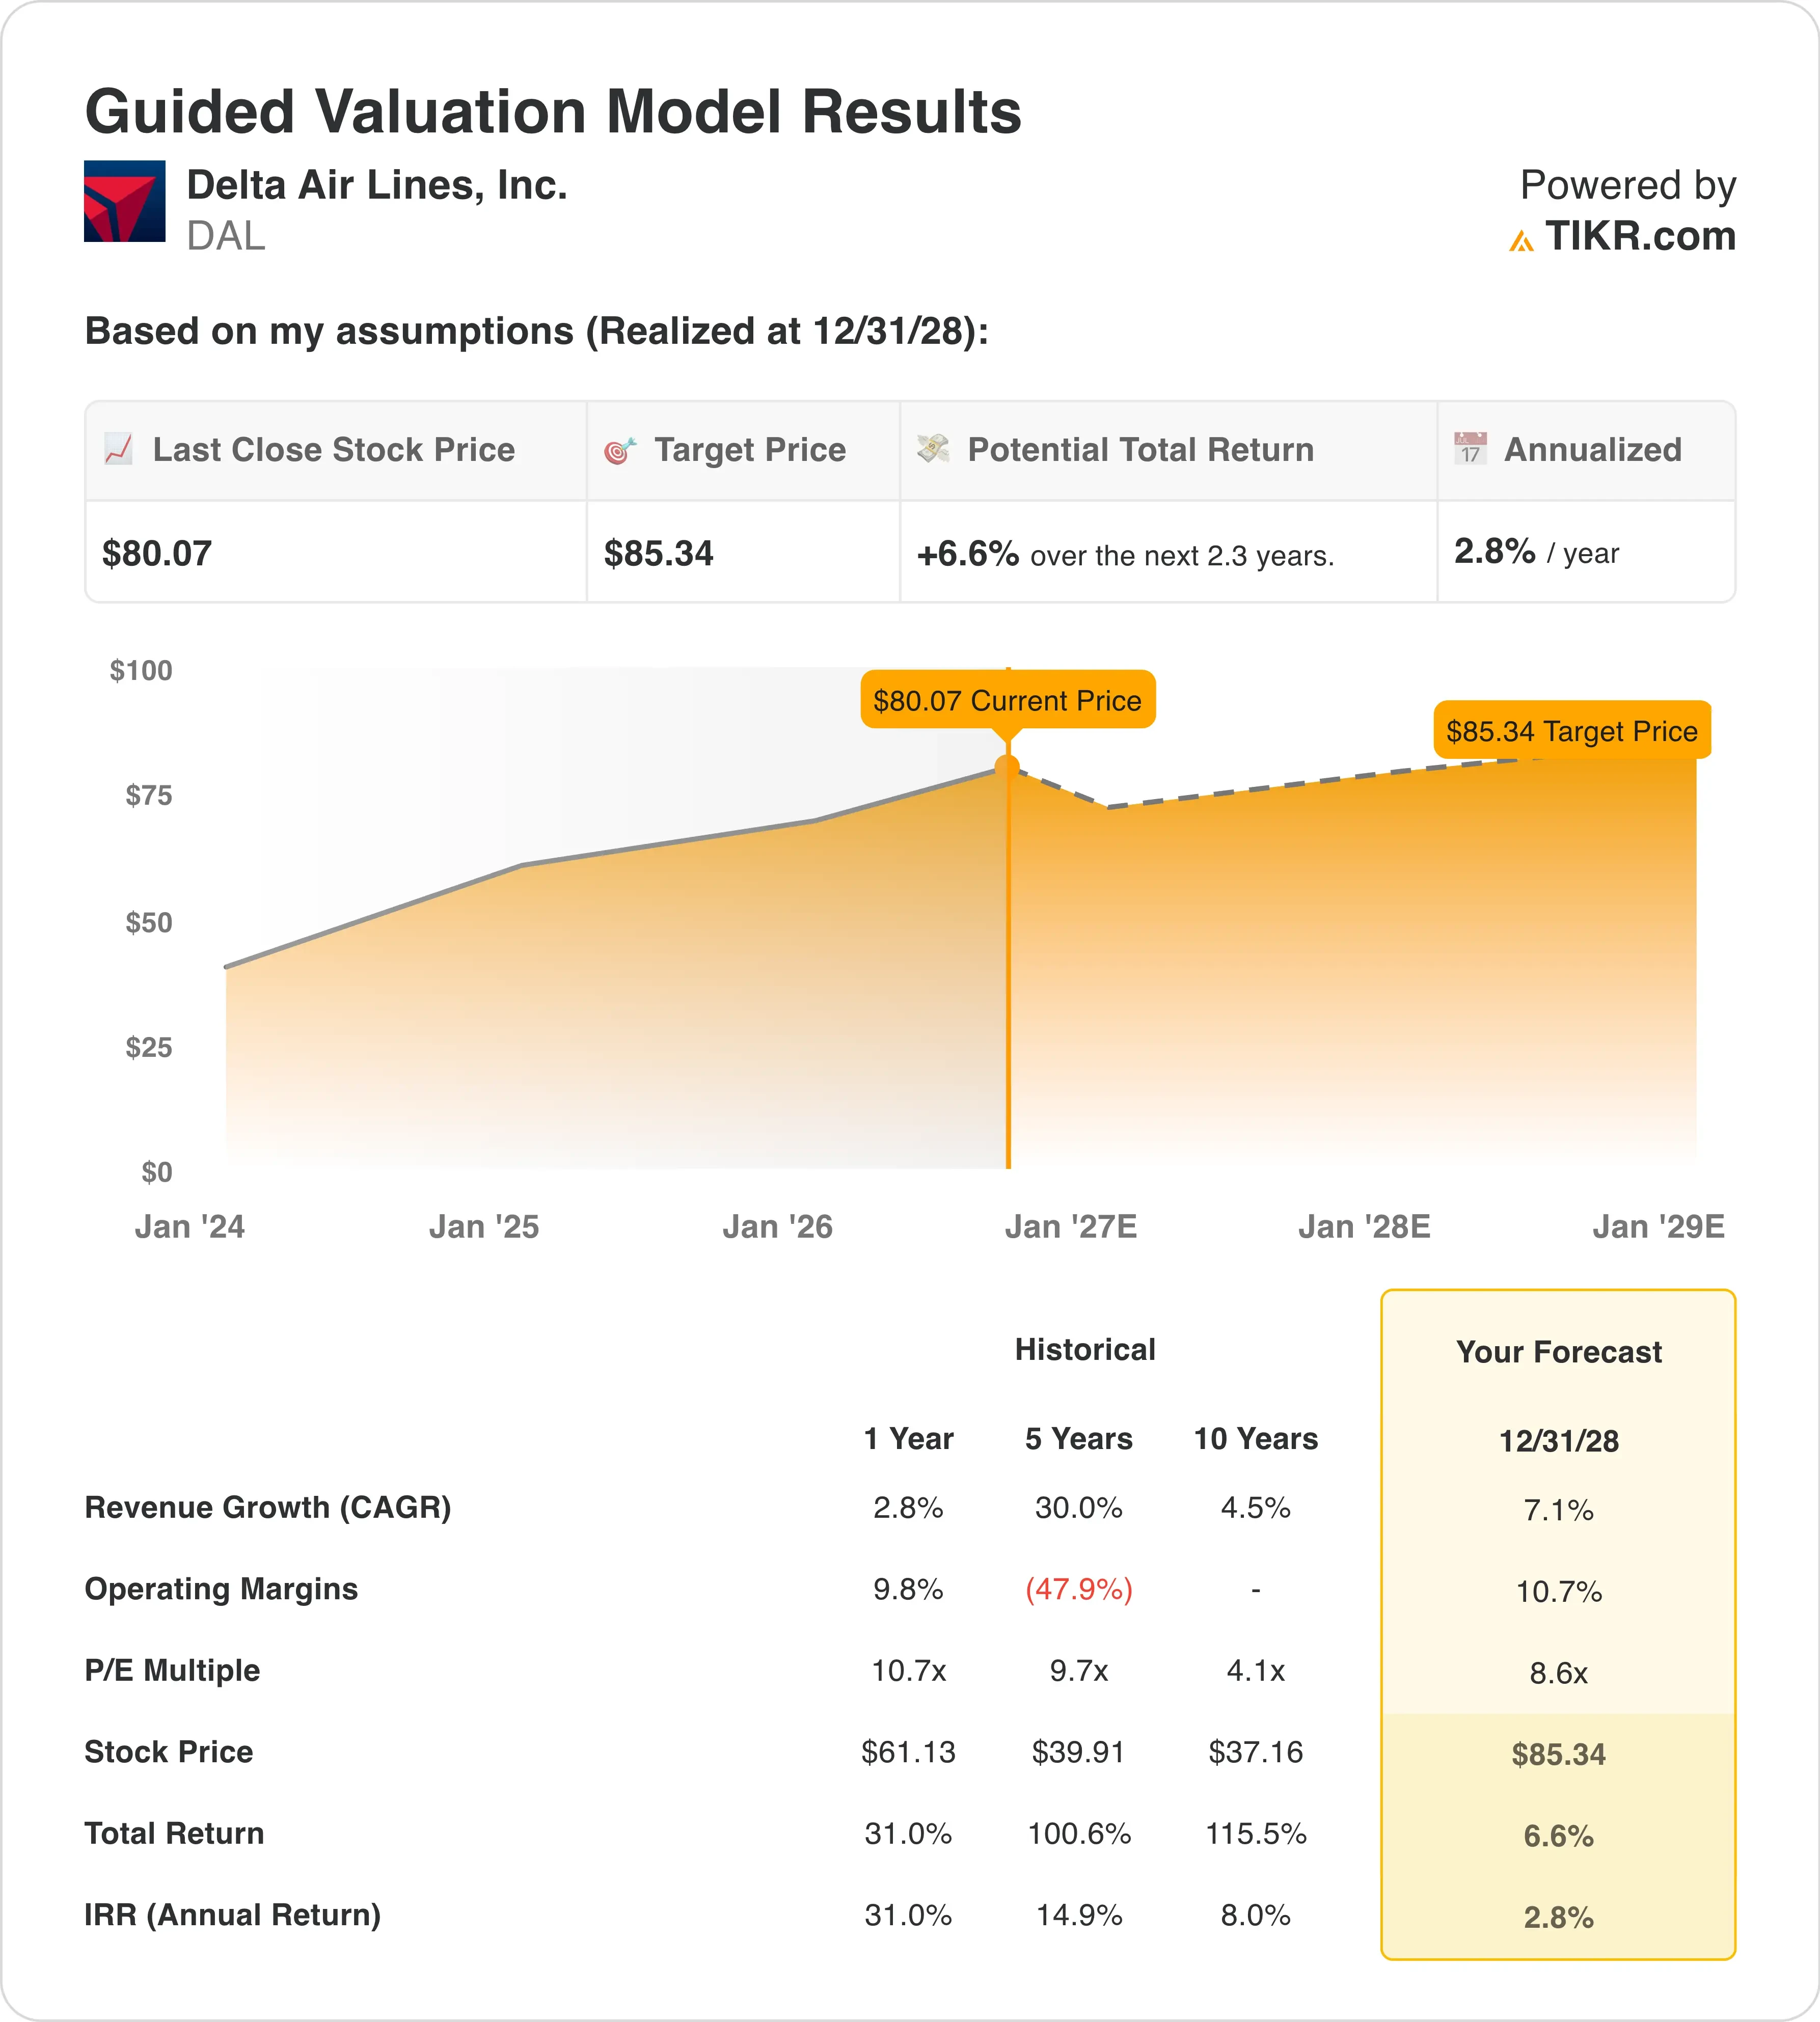
Under valuation model assumptions realized through 12/31/28, the stock is modeled using:
- Revenue Growth (CAGR): 7.1%
- Operating Margins: 10.7%
- Exit P/E Multiple: 8.6x
Based on these inputs, the model estimates a target price of $85.34, implying 6.6% total upside from the current share price and a 2.8% annualized return over the next 2.3 years.
That annualized return sits well below the range most growth-focused investors look for, even after a quarter that beat guidance on nearly every measure. The gap between Delta’s strong operational story and its modest projected return comes down to the multiple. Airlines have historically traded at low earnings multiples because of their capital intensity and sensitivity to fuel prices, and the model’s 8.6x exit assumption reflects that history rather than any near-term concern.
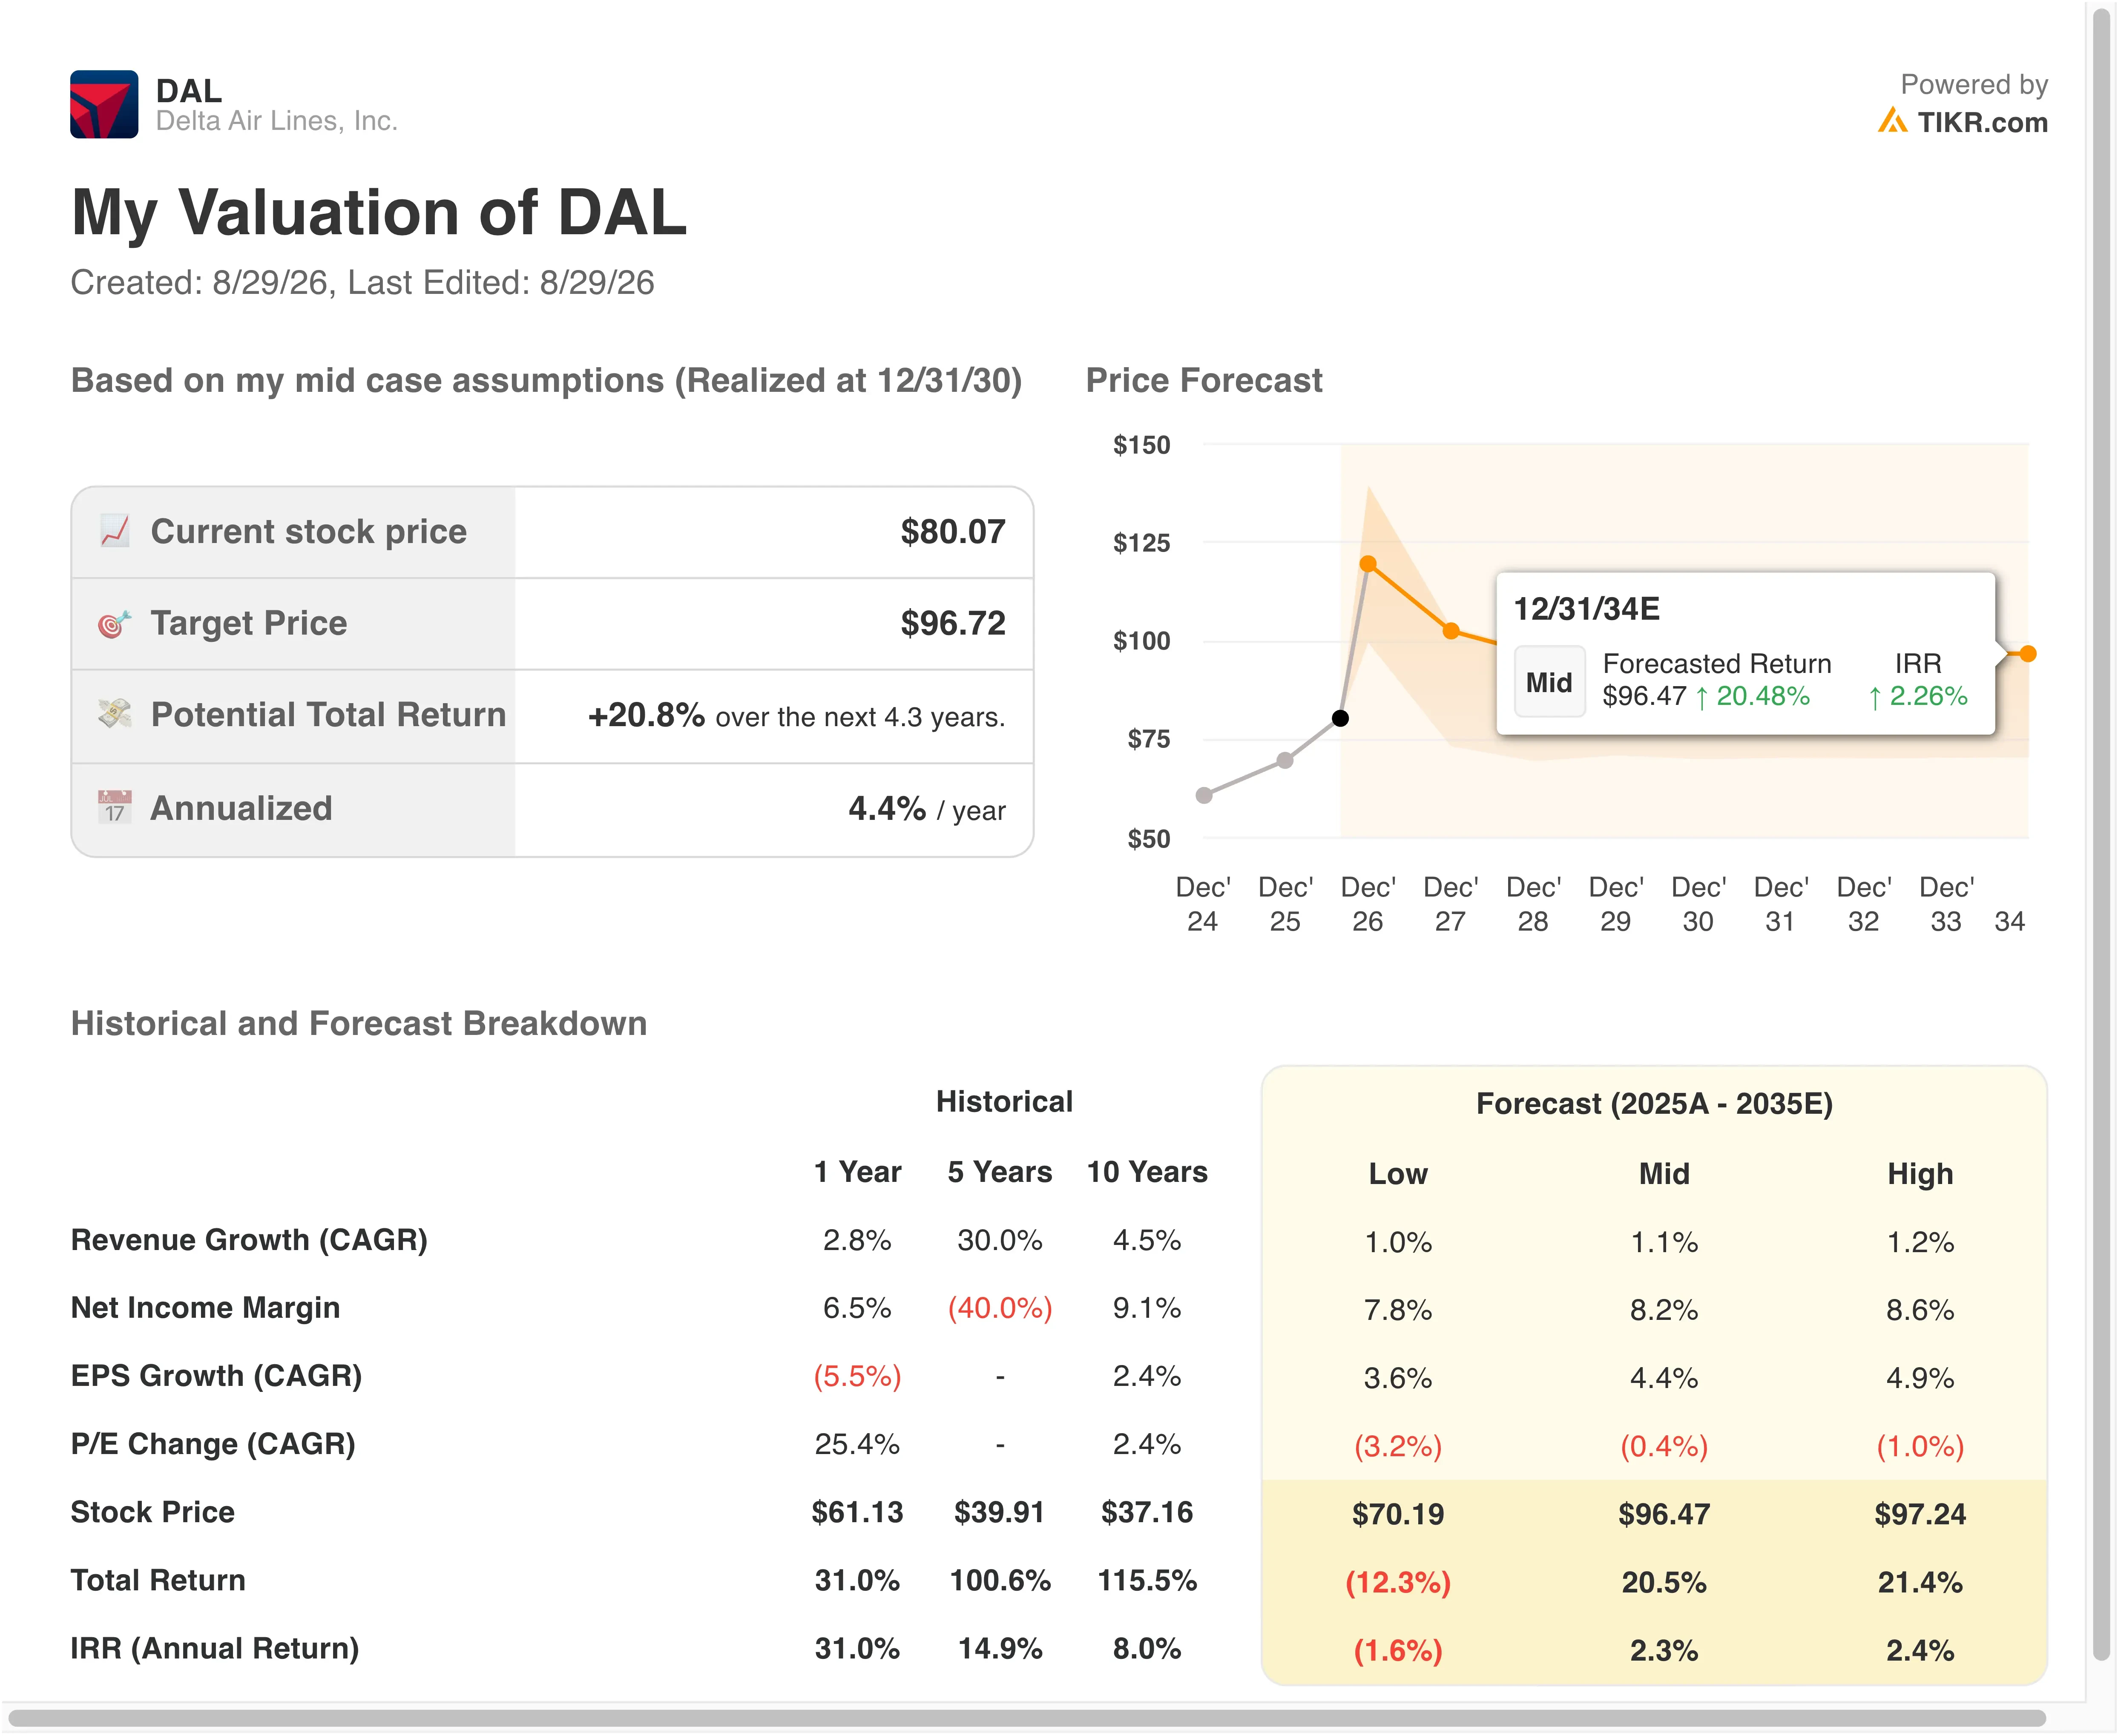
The bull case rests on Delta’s structural advantages holding up. Bastian has argued that the low-cost airline model has lost its edge as fuel hedges disappeared and labor costs reset higher industry-wide, leaving premium carriers like Delta with a durable pricing advantage. If that thesis proves right, Delta’s actual earnings could outrun the model’s conservative growth assumptions.
The bear case is straightforward: airlines are cyclical, and Delta’s return math depends heavily on fuel prices staying manageable. A sustained spike in oil prices could pressure margins faster than fare increases can offset, which is exactly the tension the current quarter already showed.
Delta looks financially sound, but the valuation model suggests the stock is priced closer to fair value than to a clear bargain.
See how Delta’s premium revenue mix could shift its fair value (Free with TIKR) >>>
Delta Against United and American Airlines
United Airlines (UAL) posted second quarter revenue growth of 8.5%, slower than Delta’s 14%. Its operating margin sat around 7.8%, below Delta’s 8.8% margin. United has leaned on international and premium expansion of its own. Its margin has been more volatile quarter to quarter as fuel costs swing.
American Airlines (AAL) trails both rivals on profitability, with an operating margin of just 1.7% last quarter. That result came despite revenue growth of 7.5% for the period. American has struggled to match Delta and United’s pivot toward premium and loyalty revenue. It remains more exposed to fare pressure in the price-sensitive main cabin.
Delta’s advantage over both competitors comes down to revenue diversification. Its premium and loyalty businesses now make up 61% of total revenue. That mix gives it more pricing power when fuel costs rise than either United or American currently have. That is the core argument behind Bastian’s view that the low-cost model has lost its structural edge. Delta’s higher-margin revenue streams are growing faster than its competitors’ comparable segments.
What’s Driving DAL Stock Going Forward?
Q3 guidance sets a high bar. Delta expects an 11% to 13% operating margin on mid-teens revenue growth, with earnings per share between $2.00 and $2.50. Hitting that range would mark a clear sequential improvement from the second quarter’s 8.8% margin.
The Aeroméxico joint venture ruling removes a real overhang. A federal appeals court overturned a Department of Transportation order that had sought to unwind Delta’s nearly decade-old partnership with the Mexican carrier, finding the agency’s analysis flawed. The ruling preserves antitrust immunity that lets the two airlines coordinate scheduling and pricing on U.S.-Mexico routes.
Aircraft supply constraints are, unusually, working in Delta’s favor. Limited jet availability from Boeing and Airbus is preventing the industry from returning to overcapacity, which supports fare discipline across the sector even as individual airlines want to grow.
Engine maintenance costs remain a lingering risk. Industry-wide spending on engine repairs has risen sharply as grounded jets return to service, and elevated bills could offset some of the pricing gains Delta is counting on to hit its full-year targets.
Estimate a company’s fair value instantly (Free with TIKR) >>>
Should You Invest in Delta Airlines?
The only way to really know is to look at the numbers yourself. TIKR gives you free access to the same institutional-quality financial data that professional analysts use to answer exactly that question.
Pull up DAL, and you’ll see years of historical financials, what Wall Street analysts expect for revenue and earnings in the quarters ahead, how valuation multiples have moved over time, and whether price targets are trending up or down.
You can build a free watchlist to track DAL alongside every other stock on your radar. No credit card required. Just the data you need to decide for yourself.
Analyze DAL stock on TIKR Free→
Disclaimer:
Please note that the articles on TIKR are not intended to serve as investment or financial advice from TIKR or our content team, nor are they recommendations to buy or sell any stocks. We create our content based on TIKR Terminal’s investment data and analysts’ estimates. Our analysis might not include recent company news or important updates. TIKR has no position in any stocks mentioned. Thank you for reading, and happy investing!


