Key Takeaways
- UnitedHealth raised its dividend to $9.28 a share a year in the second quarter of 2026, while CVS still pays $2.66, the same as its fiscal 2025 dividend.
- CVS paid out 29% of its free cash flow as dividends over the twelve months to June 30, 2026, against 34% for UnitedHealth.
- CVS carries net debt of 3.2x EBITDA, twice UnitedHealth’s 1.6x, and its 2026 outlook assumes no share buybacks.
- UnitedHealth’s dividend grew 13% a year from fiscal 2020 to fiscal 2025, against 6% for CVS.
UnitedHealth Group (UNH) and CVS Health (CVS) just showed their insurance arms getting healthier – which is great news for every retiree using these stocks to snag some dividend income. In the second quarter of 2026, CVS’s medical benefit ratio fell to 87.4% from 89.9% a year earlier, and UnitedHealth’s medical care ratio fell to 86.7% from 89.4%.
For dividend investors, though, the two have gone different ways. UnitedHealth’s board raised its dividend to $9.28 a share a year during the quarter, whereas CVS still pays $2.66, the same as its fiscal 2025 dividend per share. Even so, CVS’s 3.1% yield tops UnitedHealth’s 2.4%.
So which is the better dividend stock?
| Metric | CVS Health (CVS) | UnitedHealth Group (UNH) |
|---|---|---|
| Dividend yield | 3.1% | 2.4% |
| Annual dividend | $2.66 | $9.28 |
| Dividend growth, fiscal 2020–2025 | 5.9% a year | 12.6% a year |
| Cash dividend payout ratio (TTM to June 30, 2026) | 29% | 34% |
| Net debt / EBITDA (LTM) | 3.17x | 1.58x |
| Interest coverage (EBIT / interest, LTM) | 3.92x | 6.19x |
| Forward P/E (NTM) | 10.7x | 17.8x |
Source: TIKR, Oct. 6, 2026; annual dividends from StockAnalysis.
CVS is fixing Aetna first
CVS’s turnaround is showing up fast. Second-quarter revenue rose 7.3% year over year to $106.1 billion, and adjusted operating income jumped 35.4% to $5.16 billion on Aetna’s margin recovery. Management raised its 2026 guidance for cash flow from operations to at least $11.5 billion, from at least $9.5 billion.
The dividend is well-covered today: it takes $3.42 billion, or 29%, of the $11.76 billion of free cash flow CVS generated over the twelve months to June 30, 2026. The longer record is choppier. Free cash flow fell from $15.8 billion in fiscal 2021 to $7.81 billion in fiscal 2025, while dividends paid rose from $2.63 billion to $3.40 billion, lifting the payout ratio from 16.7% to 43.5%…

The main risk is the debt. CVS’s net debt runs 3.17x EBITDA, and EBIT covers its interest 3.92x. As Chief Financial Officer Brian Newman put it on the first-quarter call in May: “We remain focused, however, on strengthening our balance sheet, and that’s by reducing leverage.”
UnitedHealth’s Optum is carrying the load
UnitedHealth is running the same margin repair as CVS, with far less debt behind it. Second-quarter revenue was $112.0 billion, against $111.6 billion a year earlier, but earnings from operations rose to $8.0 billion from $5.2 billion. Optum brought in $65.7 billion of revenue, with margins up 160 basis points year over year. The insurance book is shrinking: UnitedHealthcare served 48.5 million people, down 525,000 from the first quarter.
Dividends paid rose every year on the chart, from $2.26 billion in fiscal 2016 to $7.92 billion in fiscal 2025. Free cash flow peaked at $25.7 billion in fiscal 2023, then dropped to $16.1 billion in fiscal 2025, tightening the payout ratio from 26.3% to a much thinner 49.2%…

Free cash flow has since recovered to $23.62 billion over the twelve months to June 30, 2026, and the $8.10 billion of dividends took 34% of it. Meanwhile, management targets a debt-to-capital ratio of about 40% by year-end 2026, from 41.2% at June 30.
So which dividend wins?
UnitedHealth is the better dividend stock. It’s growing its payout more than twice as fast, 12.6% a year from fiscal 2020 to fiscal 2025 against 5.9% for CVS, and it has the balance sheet to keep going.
$10,000 in UnitedHealth pays $240 a year today; growing at its five-year rate, that’s about $697 in year 10. So, call it a 7% yield on your cash. The same $10,000 in CVS pays $310 today and about $518 in year 10 at its own five-year rate, and UnitedHealth’s income passes it in about 4.2 years, around 2031. CVS’s raises look set to wait on its debt, which climbed from 2.4x EBITDA in fiscal 2022 to 4.6x in fiscal 2024 and stood at 3.9x in fiscal 2025…
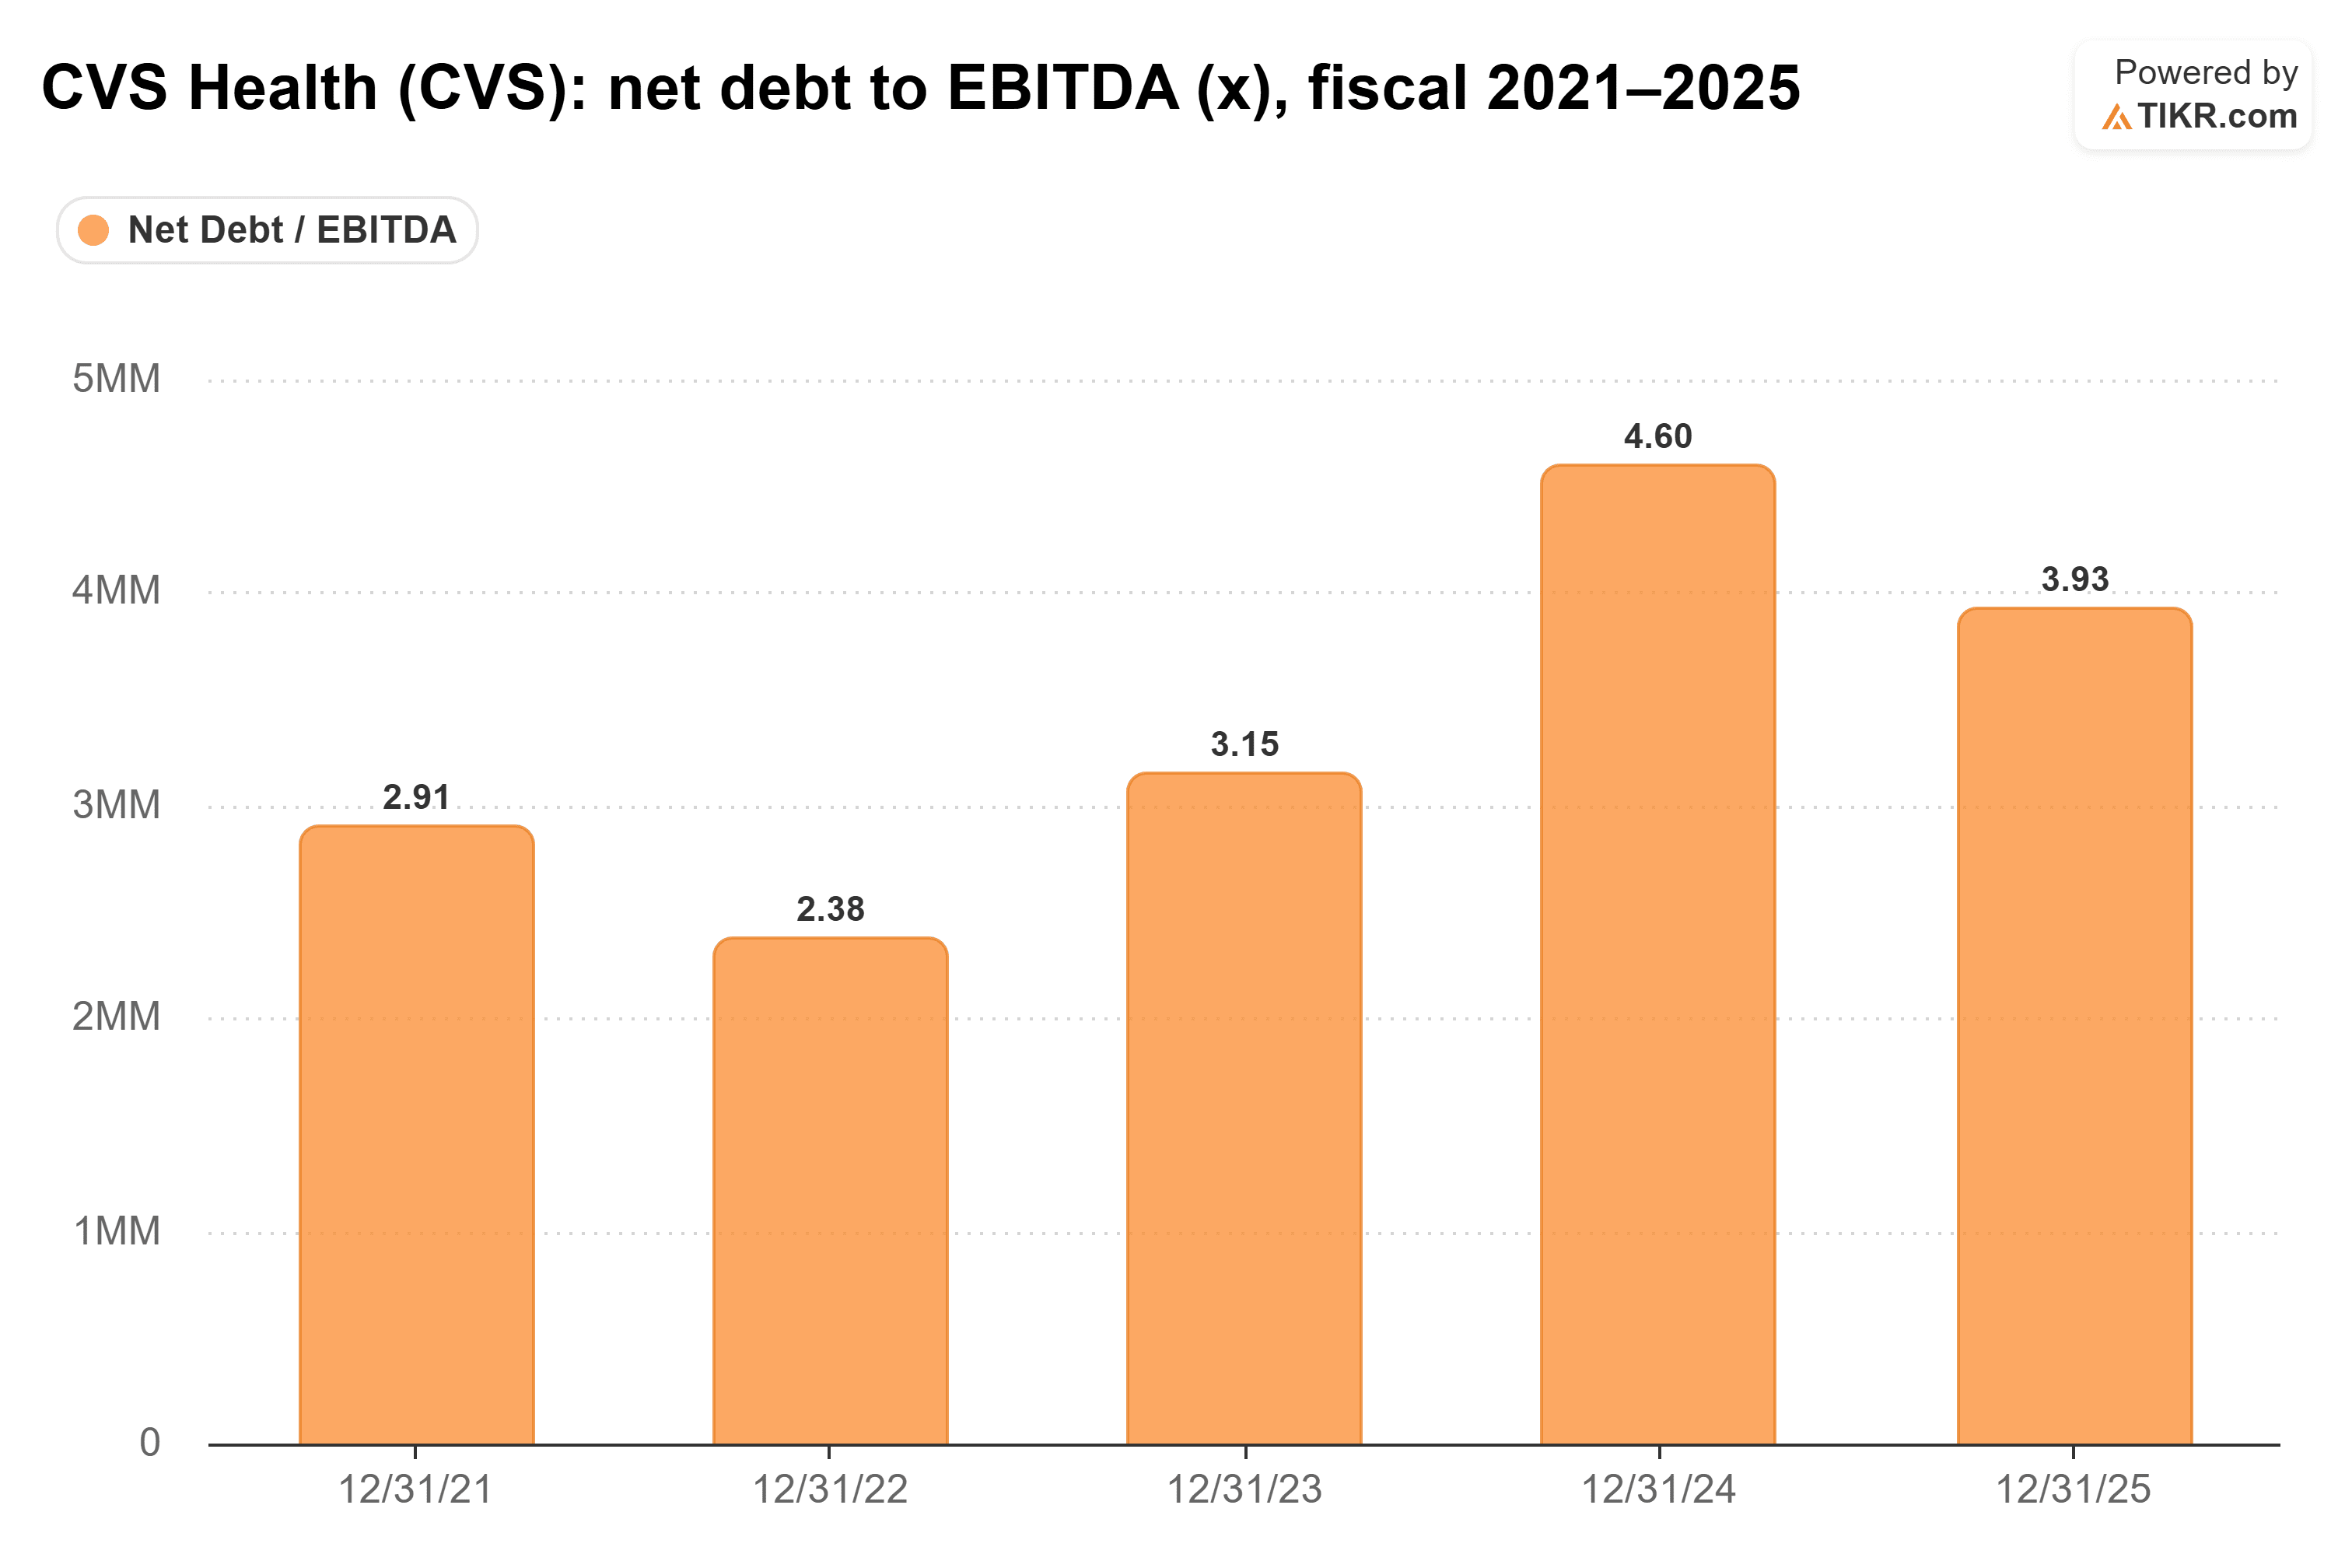
It’s down to 3.17x over the last twelve months, still twice UnitedHealth’s 1.58x.
This isn’t to say CVS’s dividend is in trouble. It pays the higher yield, its 29% payout ratio is the lower of the two, the business is clearly recovering, and at 10.7x forward earnings against UnitedHealth’s 17.8x, it’s the far cheaper stock. UnitedHealth’s dividend simply has more growth and less debt behind it.
Of course, CVS says it will keep evaluating how to deploy capital as its leverage improves. If that cash goes to shareholders, things could change fast.
So what is UnitedHealth stock actually worth?
TIKR lets you forecast the future price of any stock in less than a minute. Just enter a few assumptions into TIKR’s valuation model and see what UnitedHealth could be worth. Start from Wall Street consensus estimates, or adjust the inputs to reflect your own view of the business. It’s free to use.
Disclaimer:
Please note that the articles on TIKR are not intended to serve as investment or financial advice from TIKR or our content team, nor are they recommendations to buy or sell any stocks. We create our content based on TIKR Terminal’s investment data and analysts’ estimates. Our analysis might not include recent company news or important updates. TIKR has no position in any of the stocks mentioned. Thank you for reading, and happy investing!