Key Stats for AppLovin Stock
- Current Price: $424.54
- Target Price (Mid): ~$890
- Street Target: ~$655
- Potential Total Return: ~110%
- Annualized IRR: ~18% / year
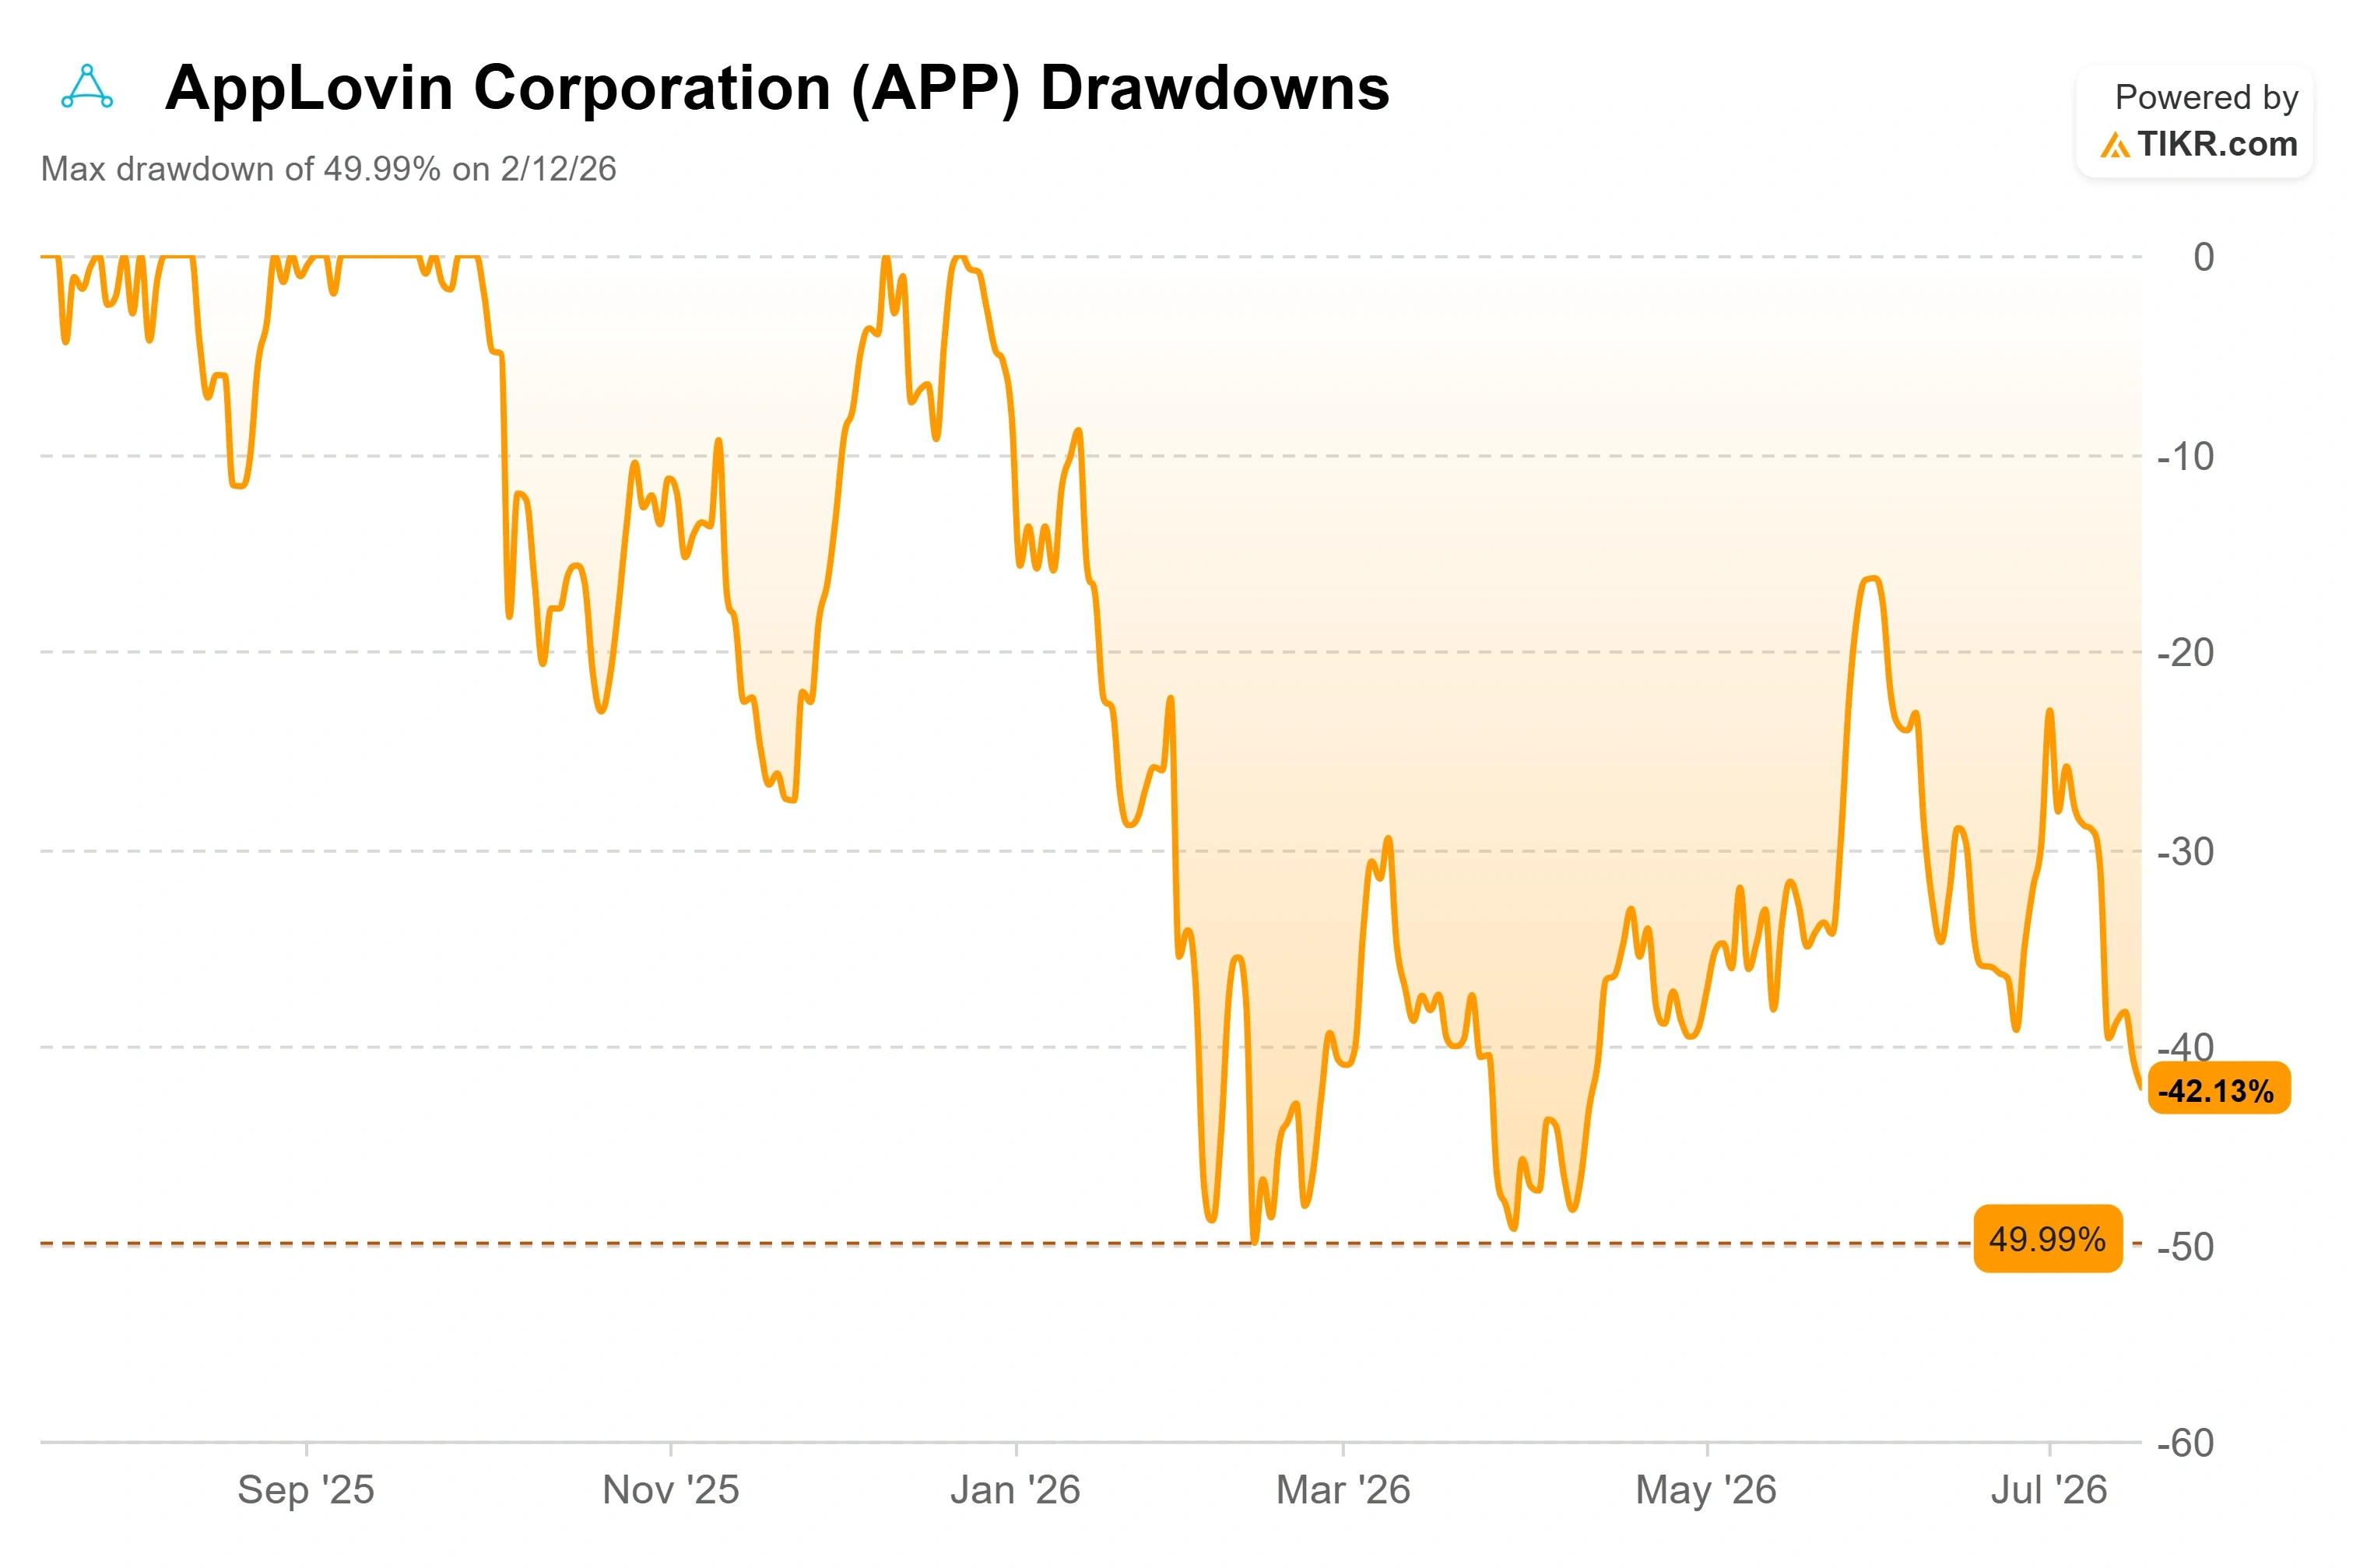
- Max Drawdown: 49.99% on 2/12/26
Now Live: Discover how much upside your favorite stocks could have using TIKR’s new Valuation Model (It’s free) >>>
What Happened?
AppLovin (APP) has become a stock the market cannot price with a straight face. The shares closed at $424.54 on July 17, down 43% from the $745.61 high they set last December, and most of the recent damage traces to a single research note about two weeks of data. On July 13, the stock dropped 13% in a day, its worst session in the S&P 500, after Bank of America flagged that new e-commerce sign-ups had cooled in June. That one reading started a losing streak that ran for most of a week.
Here is the strange part. The analyst who triggered the selloff kept his Buy rating and his price target. The business the note described is the same one that just reported an 85% margin quarter with no growth slowdown in 12 straight quarters. So the question investors are actually asking is not whether AppLovin is a good business. It is whether a soft two-week signal justifies treating the stock like the story broke.
The Data Point Behind a 13% Drop Was Two Weeks Old
The trigger was specific and narrow. BofA analyst Omar Dessouky, using third-party tracking data, noted that AppLovin added roughly 750 new e-commerce pixels in June, down from about 950 in May. A pixel is the tracking tag a merchant installs to run and measure ads, so pixel adds are a rough proxy for how fast new advertisers are joining. Fewer adds in June looked, on the surface, like the open platform was already losing steam.
The context matters more than the headline. AppLovin only opened Axon, its AI ad engine, to all advertisers worldwide on June 22, after 14 years as a closed system. That means the June data Dessouky flagged covered only the first two weeks of general availability, a point he made himself while keeping his $705 target intact. Citi, looking at the same window, counted more than 10,000 e-commerce clients as of July 10. As a result, the read is early enough that it tells very little about the trajectory, yet the stock traded as if it told everything.
See historical and forward estimates for AppLovin stock (It’s free!) >>>
A Business That Has Not Actually Slowed Down
Strip away the pixel noise and look at what the company reported. First-quarter revenue was $1,842.45 million, which management put at up 59% year over year, and a beat against the $1,775.36 million consensus. That growth rate looks smaller on a raw screen because AppLovin sold its legacy Apps business in mid-2025, so the year-ago base is not apples to apples. Adjusted EBITDA reached $1,556.92 million at an 85% margin, and free cash flow was $1.29 billion in the quarter alone. Those are software economics running underneath an advertising business, and the gross margin of 88% shows how little it costs AppLovin to deliver each incremental dollar.
CEO Adam Foroughi addressed the growth durability question head-on. “We have yet since we launched AXON 2.0, seen a slowdown,” he said on the May earnings call, noting the company has never come close to slowing below its own long-term 20% to 30% gaming growth range. That gaming core, not e-commerce, still drives the bulk of the growth, which is the piece the pixel panic ignores. Management also flagged that the newer consumer vertical exited the quarter, accelerating, with March spend running roughly 25% ahead of January and April setting a record month. The concern the market is trading on, and the trend management described, are pointing in opposite directions.
What Has to Go Right, and What Could Still Go Wrong
The bear case is not empty, and it deserves a fair hearing. AppLovin has been under an SEC investigation into its data-collection practices, an overhang that has sat on the stock since short-seller reports surfaced last year, and the company has not signaled a resolution. Insider selling has not helped sentiment either: Foroughi sold about $14.6 million of stock on June 10 and another $11.2 million on June 12, part of a steady stream of Form 4 sales that gives skeptics an easy narrative. And the deeper risk is real. E-commerce is a far more fragmented, competitive arena than mobile gaming, where AppLovin already dominates. Replicating that dominance against Meta and Google is the whole bet.
Against that, the stock now trades at around 19 times NTM EV/EBITDA, meaning enterprise value against next-twelve-month earnings before interest, taxes, depreciation, and amortization. That is well below where it sat late last year, and it prices in a meaningful stumble. Foroughi has argued that the platform economics support far more than the market gives credit for, telling investors AppLovin projects “well over $70,000 a year from every new customer” once they clear their first 30 days, with churn that is close to zero after that point. If the open platform onboards even a fraction of the customers management expects, the June pixel wobble becomes a rounding error. The tension is between a genuine execution risk and a valuation that already assumes the risk plays out badly.
Peer comparison offers little help here, and forcing it would mislead. AppLovin trades at roughly 19 times NTM EV/EBITDA against a peer group (Unity around 6 times NTM enterprise value to revenue, Digital Turbine near 2 times) that AppLovin dwarfs on both margin and growth, so the multiples describe different businesses rather than comparable ones. The more useful benchmark is AppLovin against its own history and its own model.

See how AppLovin performs against its peers in TIKR (It’s free!) >>>
TIKR Advanced Model Analysis
- Current Price: $424.54
- Target Price (Mid): ~$890
- Potential Total Return: ~110%
- Annualized IRR: ~18% / year

See analysts’ growth forecasts and price targets for AppLovin stock (It’s free!) >>>
TIKR’s mid-case model values AppLovin at around $890 by the end of 2034, implying roughly 110% total upside from today and an annualized return near 18% per year over that stretch. Even the model’s low case points higher than today’s price on that same multi-year horizon, which tells how much near-term pessimism is currently priced in, though a nine-year forecast is a scenario, not a floor.
The two revenue drivers behind the case are the mature gaming vertical, still compounding above 20% as hybrid-monetization games expand the ad-supported market, and the consumer vertical opened to the world in June, which management sizes as the larger long-term opportunity. The margin driver is Axon’s operating leverage: the model holds net income margins expanding into the high-50s to low-60s as scale builds on an already-88% gross margin base. The primary risk is the one the market is trading right now, that e-commerce fails to scale efficiently against Meta and Google, which would compress both growth and the multiple at once. The upside is a platform opening that compounds new-advertiser cohorts at $70,000-plus each into a second engine as large as gaming. The downside is that the SEC overhang or a genuine e-commerce stall validates the bears and the valuation multiple contracts further.
Conclusion
August 5 settles this. That is when AppLovin reports second-quarter results, the first print that captures real revenue from the June platform opening rather than a two-week proxy of pixel adds. Management is already guided to revenue of $1.915 to $1.945 billion with EBITDA margins around 84% to 85%. A clean beat on that guide, paired with any hard number showing e-commerce spend accelerating, tells that the July selloff was a gift. A miss, or soft e-commerce commentary that echoes the BofA note, tells that the market saw something first. Either way, the pixel debate ends, and the revenue line speaks. Watch the guide, and watch what management says about advertiser count on the open platform.
See what stocks billionaire investors are buying so you can follow the smart money with TIKR.
Should You Invest in AppLovin?
The only way to really know is to look at the numbers yourself. TIKR gives you free access to the same institutional-quality financial data that professional analysts use to answer exactly that question.
Pull up AppLovin, and you’ll see years of historical financials, what Wall Street analysts expect for revenue and earnings in the quarters ahead, how valuation multiples have moved over time, and whether price targets are trending up or down.
You can build a free watchlist to track AppLovin alongside every other stock on your radar. No credit card required. Just the data you need to decide for yourself.
Analyze AppLovin on TIKR Free →
Looking for New Opportunities?
- See what stocks billionaire investors are buying so you can follow the smart money.
- Analyze stocks in as little as 5 minutes with TIKR’s all-in-one, easy-to-use platform.
- The more rocks you overturn… the more opportunities you’ll uncover. Search 100K+ global stocks, global top investor holdings, and more with TIKR.
Disclaimer:
Please note that the articles on TIKR are not intended to serve as investment or financial advice from TIKR or our content team, nor are they recommendations to buy or sell any stocks. We create our content based on TIKR Terminal’s investment data and analysts’ estimates. Our analysis might not include recent company news or important updates. TIKR has no position in any stocks mentioned. Thank you for reading, and happy investing!