Key Stats for GD Stock
- Past-6-Month Performance: 7%
- 52-Week Range: $239 to $370
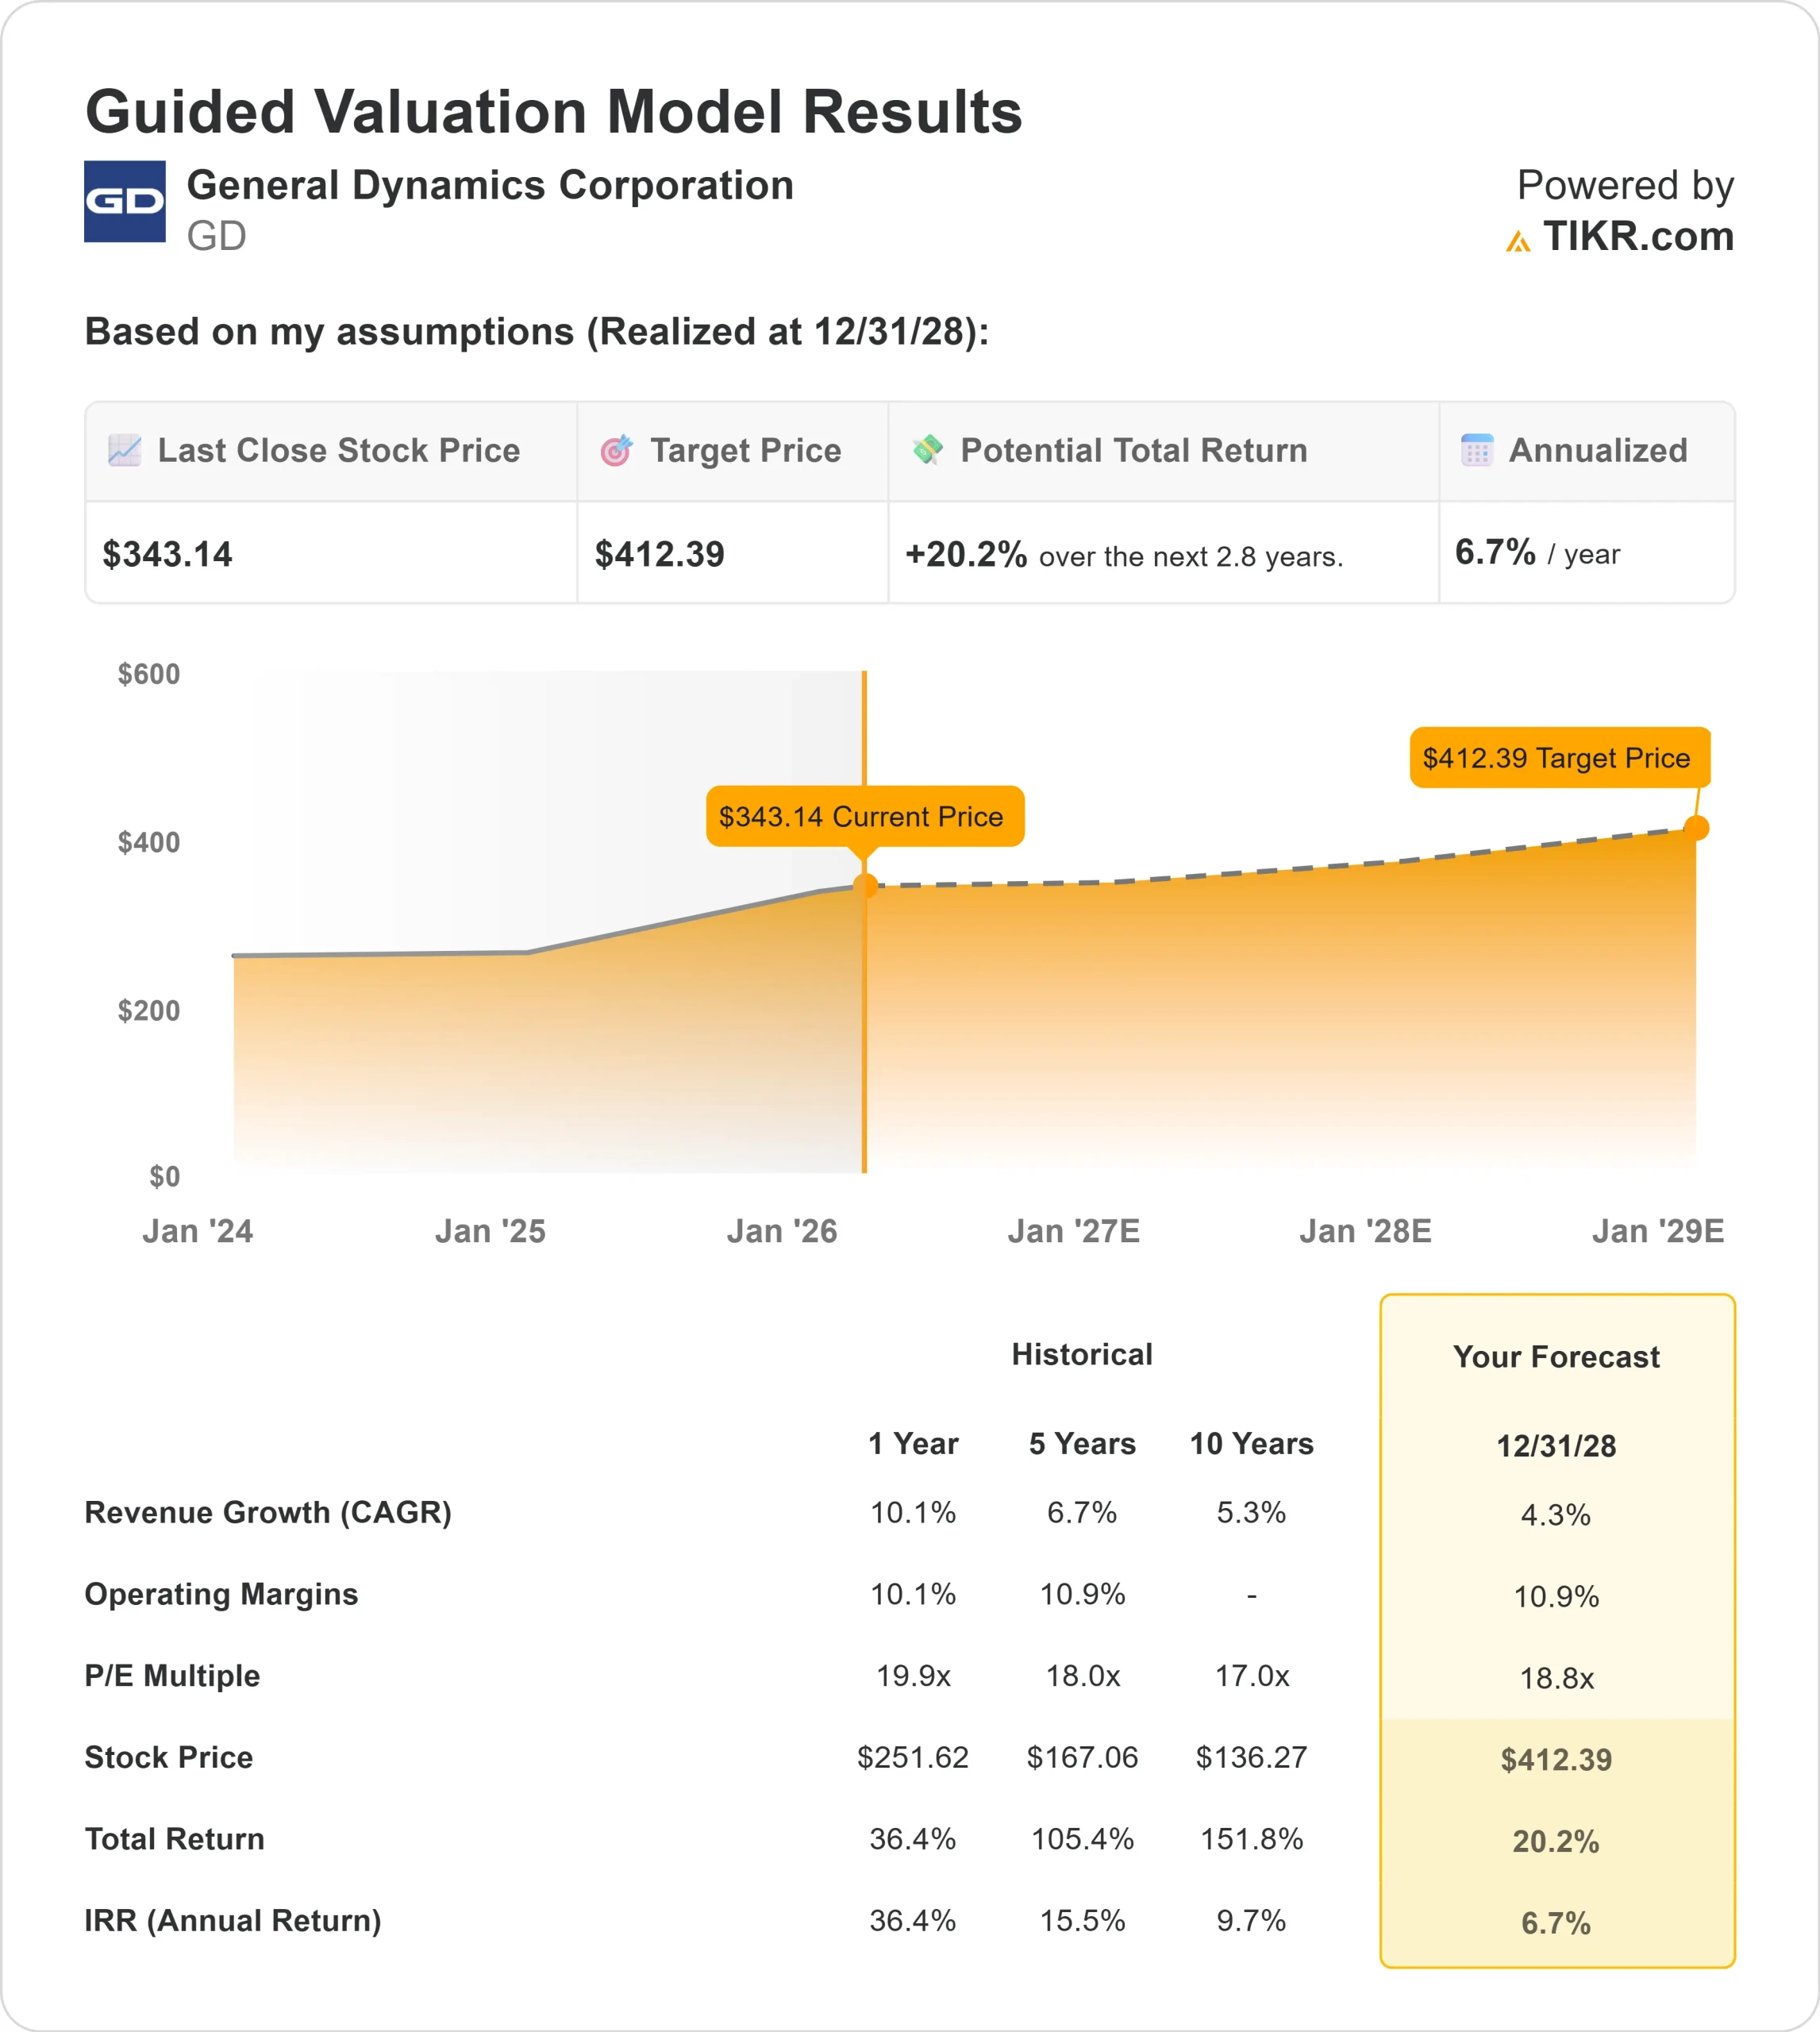
- Valuation Model Target Price: $412
- Implied Upside: 20%
Value your favorite stocks like General Dynamics with 5 years of analysts’ forecasts using TIKR’s new Valuation Model (It’s free) >>>
What Happened?
General Dynamics stock rose about 7% over the last six months, recently trading near $343 per share as investors responded to strong earnings growth, record backlog expansion, and improving 2026 visibility. Shares advanced steadily as defense demand and aerospace execution reinforced confidence in forward earnings power.
The stock moved higher primarily because the company delivered strong fourth quarter results and issued clear 2026 guidance, giving investors more certainty around near term growth.
This week, General Dynamics reported Q4 earnings of $4.17 per share on revenue of $14.379 billion, with full year revenue up 10.1% and EPS up 13.4%.
The company ended 2025 with a record $118 billion backlog, up 30% year over year, and achieved a 1.5x full year book to bill ratio.
CEO Phebe Novakovic said, “we feel very good about our business and the prospects for the year,” while guiding 2026 revenue to $54.3 billion to $54.8 billion and EPS to $16.10 to $16.20.
Institutional positioning added support to the advance. Vanguard increased its stake by 2.9% to 24,238,561 shares worth about $8.27 billion.
NEOS Investment Management raised its position by 50.9% to 25,987 shares valued at $8.86 million, while Skandinaviska Enskilda Banken initiated a new 91,000 share stake worth about $31.03 million.
Alberta Investment Management opened a 9,212 share position valued at $3.14 million, and Public Sector Pension Investment Board increased its holdings by 13.1%.
Although Vice President Mark Rayha sold 4,370 shares at $348.79 for $1.524 million, overall ownership remains concentrated, with institutions holding roughly 86% of the company.
The stock’s six month climb reflects growing confidence in backlog conversion, accelerating Marine Systems production, improving Aerospace margins as Gulfstream scales new models, and durable defense demand heading into 2026.
See analysts’ growth forecasts and price targets for General Dynamics (It’s free) >>>
Is GD Undervalued?
Under valuation assumptions, the stock is modeled using:
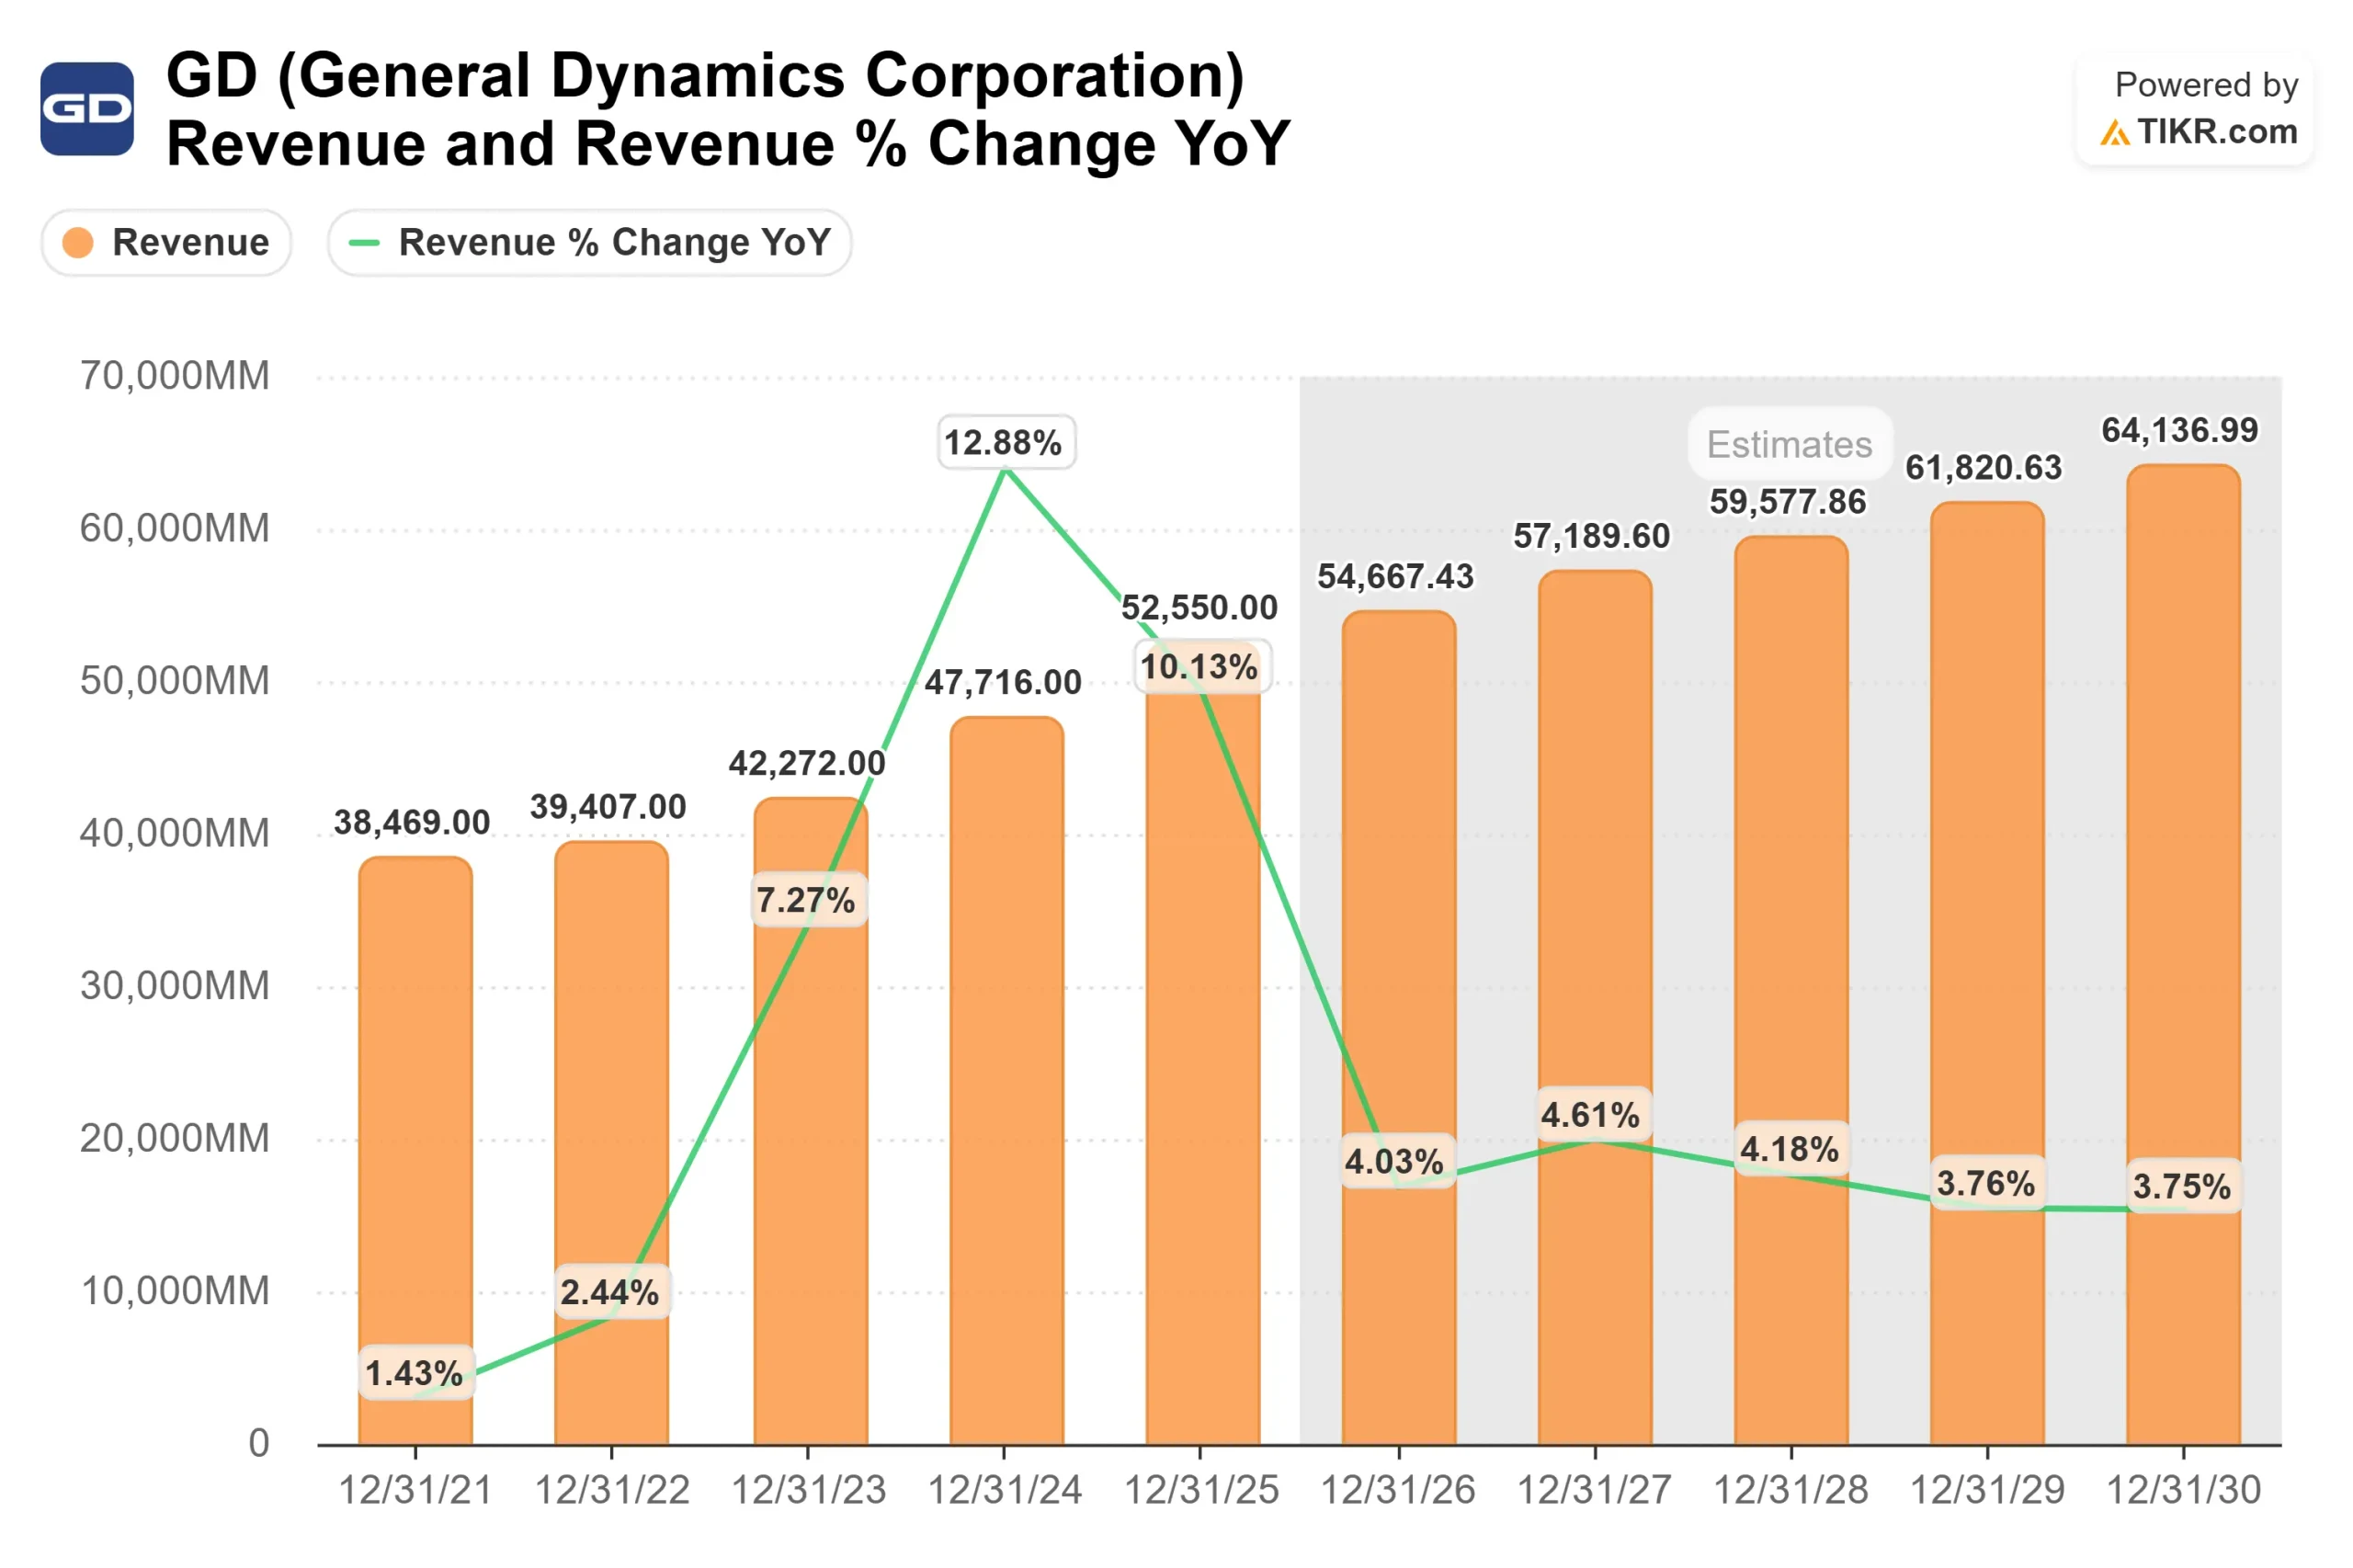
- Revenue Growth (CAGR): 4.3%
- Operating Margins: 10.9%
- Exit P/E Multiple: 18.8x
Revenue growth reflects steady expansion across Marine Systems and Aerospace, supported by a record $118 billion backlog and continued Gulfstream deliveries rather than cyclical spikes.
Marine Systems revenue grew 16.6% in 2025 and continues to benefit from submarine program throughput gains, while Aerospace revenue rose 16.5% with 158 aircraft deliveries.
Margin expansion toward 10.9% depends on improved productivity in shipyards, operating leverage in Combat Systems as large European vehicle awards transition from engineering into production in 2027, and continued margin improvement at Gulfstream as newer platforms move down the learning curve.
Tariff impacts are incorporated into 2026 guidance, and free cash flow conversion is expected to return to 100% of net income.
Based on these inputs, the model estimates a target price of $412, implying about 20% upside from current levels near $343, indicating the stock appears modestly undervalued.
If backlog converts as planned and Marine productivity continues improving while Aerospace margins expand, earnings growth in 2026 could remain supported by execution rather than multiple expansion alone.
Estimate a company’s fair value instantly (Free with TIKR) >>>
Value Any Stock in Under 60 Seconds (It’s Free)
With TIKR’s new Valuation Model tool, you can estimate a stock’s potential share price in under a minute.
All it takes is three simple inputs:
- Revenue Growth
- Operating Margins
- Exit P/E Multiple
From there, TIKR calculates the potential share price and total returns under Bull, Base, and Bear scenarios so you can quickly see whether a stock looks undervalued or overvalued.
If you’re not sure what to enter, TIKR automatically fills in each input using analysts’ consensus estimates, giving you a quick, reliable starting point.
See a stock’s true value in under 60 seconds (Free with TIKR) >>>