
Key Stats for American Airlines Stock
- 52-Week Range: $10.09 to $18.79
- Street Mean Target: ~$19
- Street High Target: $25
- YTD Return: -11%
- LTM Net Debt: $27.4B
- NTM P/E: ~12x
Now Live: Discover how much upside your favorite stocks could have using TIKR’s new Valuation Model (It’s free) >>>
American Airlines Is Executing a Commercial Turnaround, and the Revenue Numbers Show It
American Airlines (AAL) is the world’s largest airline by fleet size, operating roughly 900 aircraft across hundreds of domestic and international routes. Like every major U.S. carrier, it emerged from the pandemic with a battered balance sheet and a business model that needed rebuilding from the ground up.
Under CEO Robert Isom, who took over in 2022, the company has spent the past several years trying to reverse years of underperformance relative to Delta and United, specifically by refocusing on corporate travel, improving operational reliability, and strengthening its network in key hubs. The results have been visible in the revenue line, and Q2 2026 brought the clearest evidence yet that the strategy is working.
American reported record second-quarter revenue of $14.1 billion, up 16.9% year over year, driven by strong demand performance across all entities and cabins. Adjusted net income came in at $500 million, or $0.70 per diluted share, and the company’s Net Promoter Score improved for the fifth time in the past 17 months, reflecting continued gains in the customer experience.
Fuel expense rose $1.2 billion year over year, an 81% increase that weighed on margins, but management indicated demand strength was broad enough to offset it.
The revenue chart below captures how the recovery has compounded since 2021 and where consensus expects it to go from here.

Annual revenue grew from roughly $30 billion in 2021 to nearly $55 billion by 2025, and consensus projects continued growth toward $63 billion this year and $69 billion by 2030.
The forward growth rate is modest at roughly 10% per year, which is appropriate for a mature airline operating in a competitive domestic market, but the scale of the business and the margin leverage that comes with even incremental revenue growth make the valuation case interesting at current prices.
See analysts’ growth forecasts and price targets for American Airlines stock (It’s free) >>>
The Debt Story Is the Bull Case, and the Cash Flow Chart Is the Complication
The core investment thesis for American Airlines is not revenue growth in isolation. It is deleveraging. The company carries $27.4 billion in net debt, one of the heaviest balance sheets in the airline industry, and the argument for owning AAL at these prices is essentially a bet that management can generate enough free cash flow to steadily retire that debt, expand margins, and unlock a rerating in the stock.
Management has committed to reducing total debt by $15 billion through 2027, and the company held $7.3 billion in total available liquidity as of the end of Q2. That commitment is real, but the free cash flow chart below introduces an honest complication that investors need to understand.
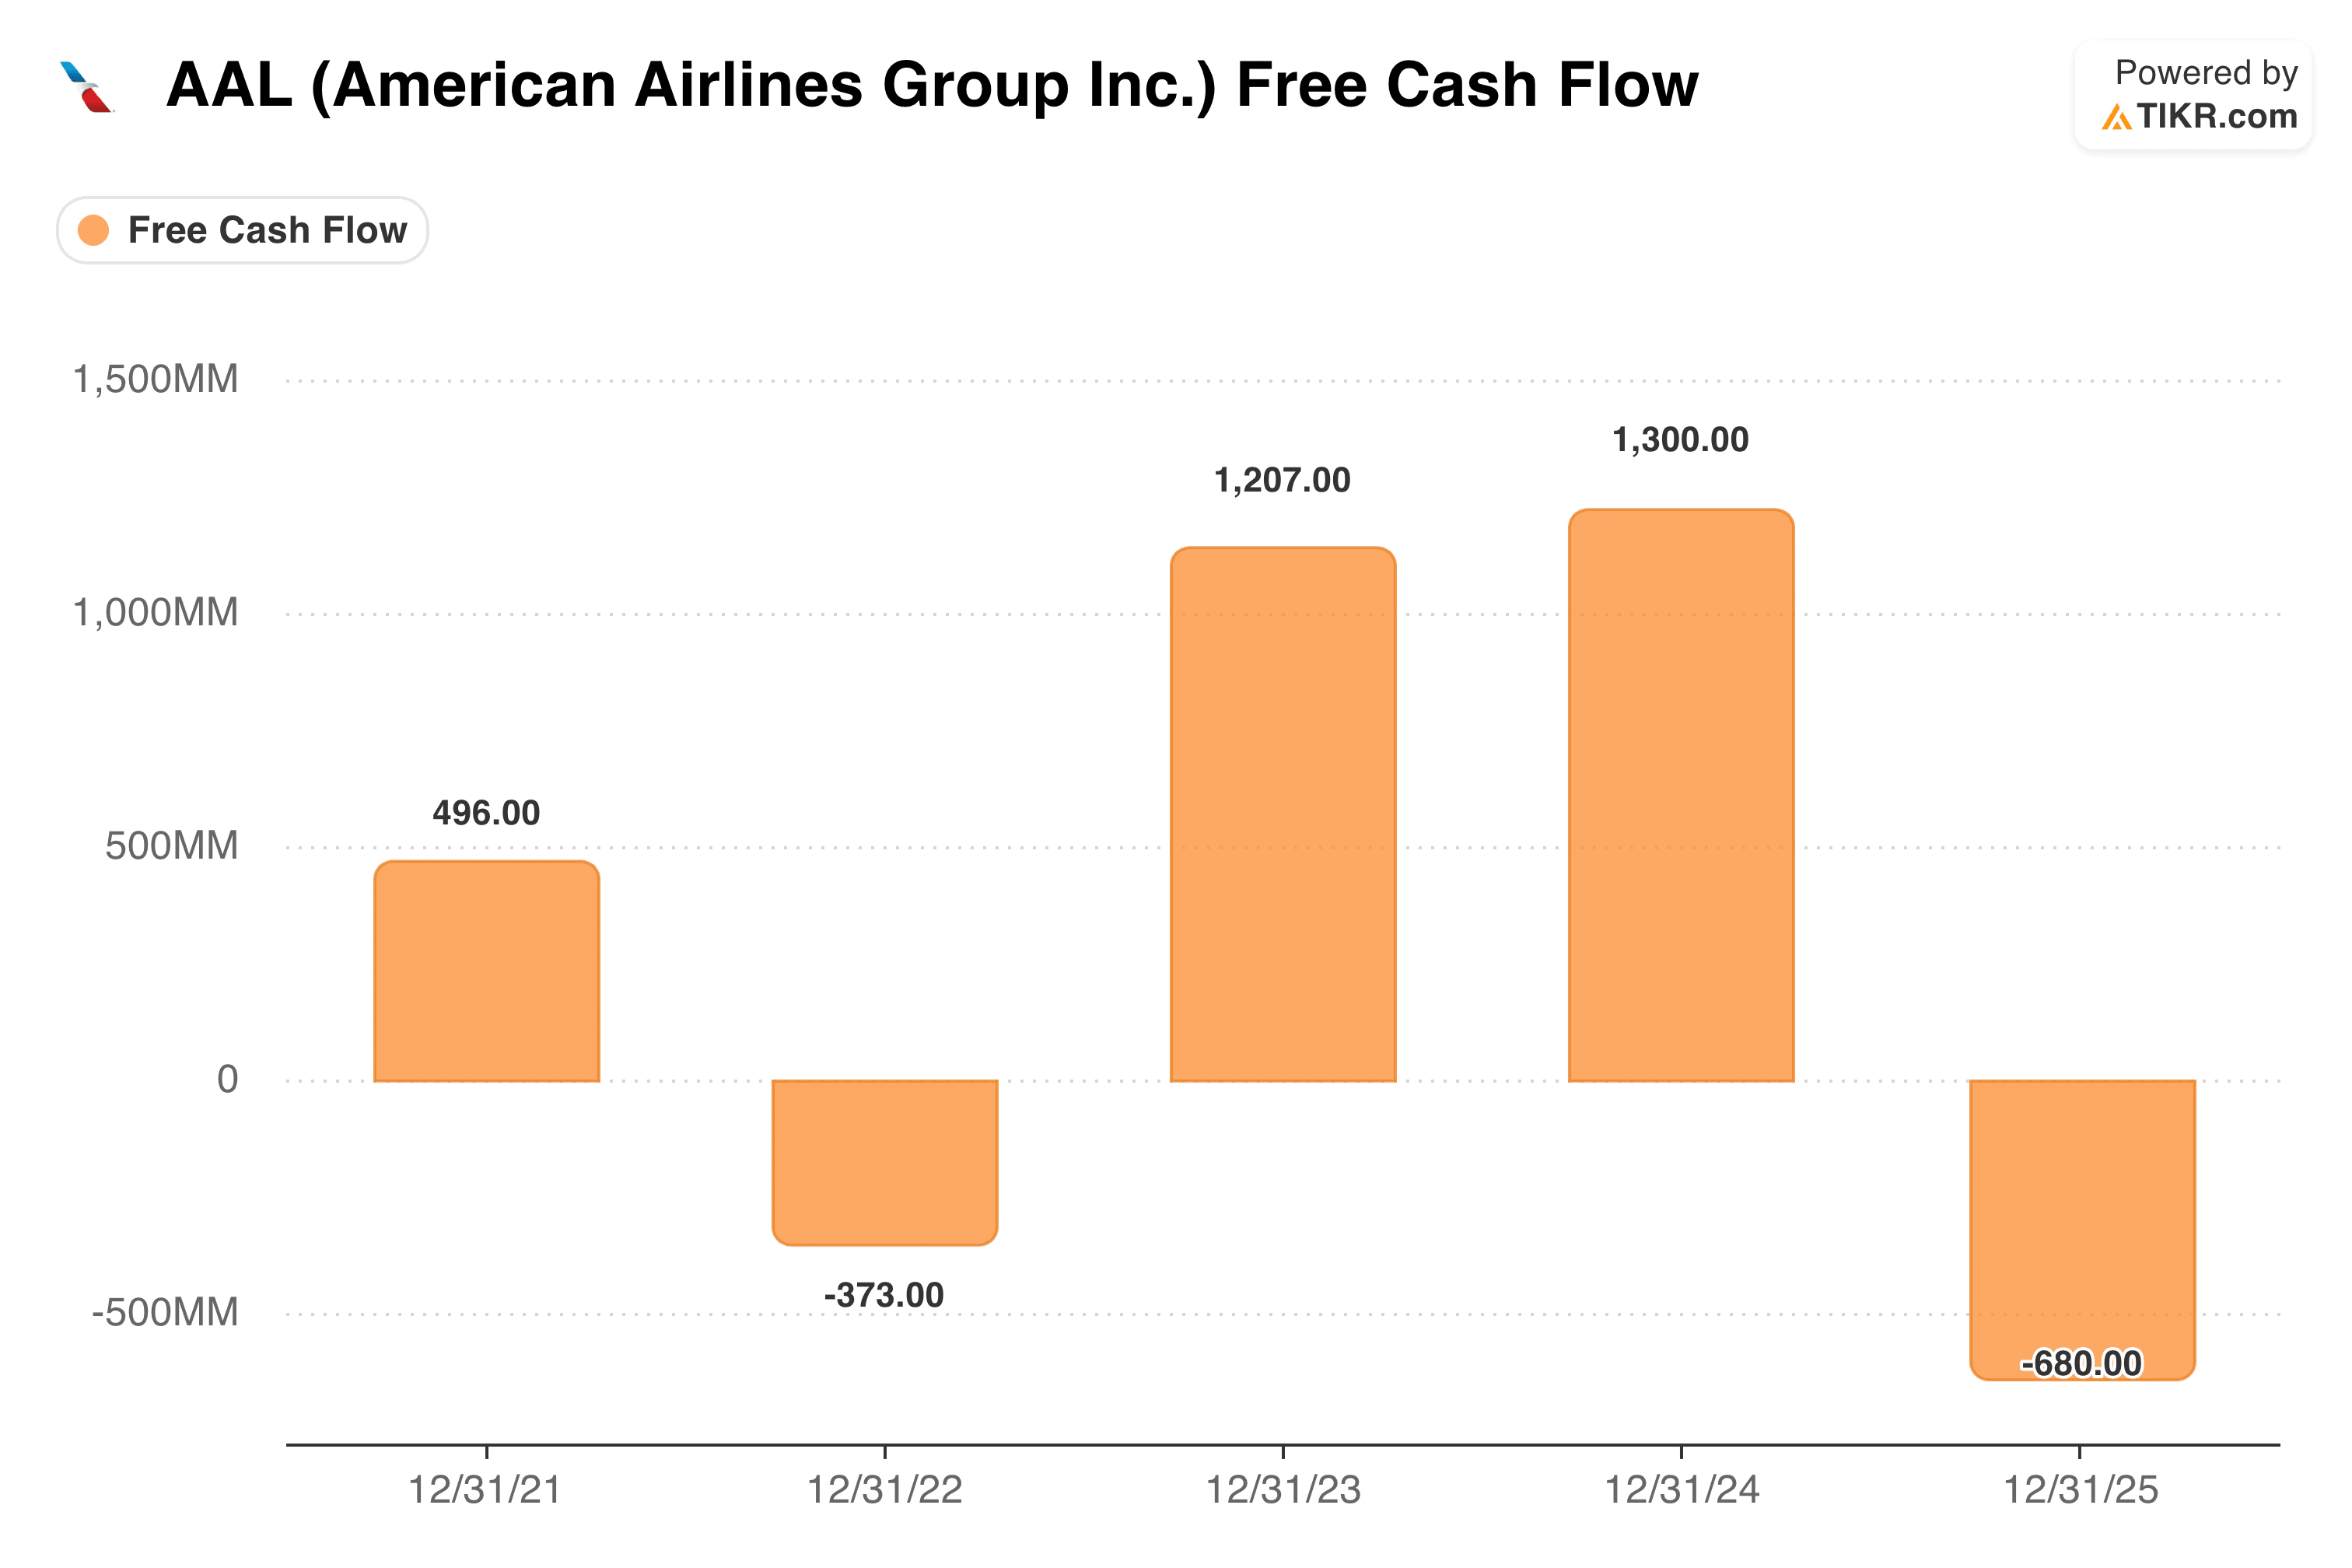
Free cash flow recovered strongly from negative $373 million in 2022 to $1.207 billion in 2023 and $1.3 billion in 2024, suggesting the deleveraging engine was finally running. But 2025 saw FCF fall back to negative $680 million, a reversal that reflects heavy capital expenditure on fleet renewal and elevated fuel costs.
The 2025 number is the primary reason AAL shares have underperformed in a year when its revenue hit a record. Bulls argue the fleet investment is front-loaded, and FCF will recover as new aircraft drive efficiency gains.
Bears point out that airlines have been saying that for years, and American’s execution history gives little reason to give the benefit of the doubt.
See how American Airlines performs against its peers in TIKR (It’s free!) >>>
What Wall Street Thinks About AAL at Current Prices
At around $14, American Airlines trades at roughly 12 times forward earnings, a discount to Delta and United that reflects the balance sheet overhang and the FCF uncertainty. The stock has pulled back meaningfully from its June peak near $18, which is actually close to where the Street mean target now sits. The targets chart below shows how analyst conviction has evolved over the past year.

The mean target of around $19 and median of $19 imply upside of roughly 35% from current levels, supported by 12 buy-equivalent ratings against 11 holds and 3 underperforms or sells from 23 analysts. The high target of $25 suggests some analysts see a genuine rerating if the debt paydown plan delivers on schedule.
The low of $10 reflects the risk that fuel costs, labor disputes, or a demand slowdown derail the thesis entirely, leaving shareholders with a deeply leveraged business and limited margin of safety.
Should You Buy American Airlines Stock?
American Airlines is a better business today than it was two years ago, and the Q2 results showed a company capable of generating record revenue even in a difficult fuel environment. The debt reduction commitment is credible, the valuation is undemanding at 12 times forward earnings, and the Street sees meaningful upside from current levels.
What is harder to dismiss is the 2025 FCF reversal, the ongoing execution risk on a $27 billion debt load, and a competitive landscape where Delta and United have spent years widening their operational advantages.
For value-oriented investors with patience for a multi-year turnaround, AAL at $14 is worth a serious look. For everyone else, the 2026 FCF trajectory is the number worth watching before making that call.
See analysts’ growth forecasts and price targets for American Airlines stock (It’s free!) >>>
Looking for New Opportunities?
- See which stocks billionaire investors are buying to follow the smart money.
- Analyze stocks in as little as 5 minutes with TIKR’s all-in-one, easy-to-use platform.
- The more rocks you overturn… the more opportunities you’ll uncover. Search 100K+ global stocks, global top investor holdings, and more with TIKR.
Disclaimer:
Please note that the articles on TIKR are not intended to serve as investment or financial advice from TIKR or our content team, nor are they recommendations to buy or sell any stocks. We create our content based on TIKR Terminal’s investment data and analysts’ estimates. Our analysis might not include recent company news or important updates. TIKR has no position in any of the stocks mentioned. Thank you for reading, and happy investing!