

Most investors focus on a company’s surface-level metrics, like revenue growth, earnings per share, and maybe a few valuation ratios. These are important, but those numbers only tell part of the story.
When you look deeper into a company’s financials, you start to uncover the real quality of the business. You can see how well it turns profits into cash, how scalable its operations are, and whether it’s actually creating long-term value for shareholders.
In this article, we’ll cover 5 overlooked metrics that help investors uncover high-quality businesses. You’ll also learn how to track each one on TIKR, where you can access detailed analyst estimates, 20+ years of historical financials, and powerful valuation tools for over 100,000 global stocks.
Let’s dive in!
1. Operating Leverage
Operating leverage measures how well a company can grow its profits faster than its revenue. It tells you whether the business can scale, because a company with operating leverage can earn more profit on each new dollar of revenue.
When a company has high fixed costs and low variable costs, it benefits from strong operating leverage. That means as revenue rises, costs don’t rise as quickly due to low variable costs, so the company becomes more profitable over time.
Why it matters:
Operating leverage is one of the clearest signs that a business can scale efficiently.
If a company consistently grows revenue and you see operating income or EBITDA growing even faster, that’s a sign of healthy leverage.
It also ties directly into margin expansion. Great businesses often expand margins over time as they scale, showing they’re becoming more efficient. Poor businesses may see flat or shrinking margins, even as they grow.
You can see that Alphabet’s operating margins have expanded over time, with the business seeing record profit margins in 2024:

How to track operating leverage on TIKR:
- Search for a company on TIKR
- Go to Financials > Income Statement
- Analyze long-term operating margin trends
Analyze stocks quicker with TIKR >>>
2. EBITDA & Gross Margin Trends
Gross margins and EBITDA margin can tell you a lot about a company’s competitive position. If margins are expanding, the business usually has pricing power, operational efficiency, or both.
If these margins are shrinking, it could be a sign that the company is losing its competitive edge, either from rising costs, weaker demand, or increased competition.
Why it matters:
Gross margins reflect the strength of a company’s moat and pricing power. The EBITDA margin accounts for a company’s overall profitability before interest and taxes.
Stable or rising margins suggest the business is gaining efficiency or strengthening its competitive position. Falling margins may point to increased competition, poor cost control, or unfavorable industry dynamics.
Margins are also one of the first places you’ll spot operational shifts. A company might still grow revenue, but if margins are slipping, that growth may be lower quality or harder to sustain.
Alphabet’s gross margin has gradually declined from over 61% in 2015 to around 58% today, suggesting slight pressure on input costs as well as a shift in revenue mix toward lower-margin segments.
In contrast, the company’s EBITDA margin has improved significantly since 2019, climbing from under 30% to 37% in 2024. This is due to the company’s stronger cost discipline and operating leverage despite fluctuations in gross profitability.

How to track EBITDA & gross margin trends on TIKR:
- Search for a company on TIKR
- Go to Financials > Ratios
- Under Margin Analysis, look at Gross margin and EBITDA margin
- See whether margins have been improving or deteriorating over a 3-5 year period
See what the world’s best investors are buying with TIKR (It’s free) >>>
3. Share Count Trend
A stock’s share count trend tracks whether a company is issuing new shares or buying back existing shares outstanding.
It’s a simple way to see how shareholder-friendly a company is and whether your stake in the business is growing or shrinking over time.
Why it matters:
If a company steadily increases its share count, it may be diluting shareholders to fund operations, pay employees, or acquire other businesses. This reduces your ownership in the company and can offset earnings growth.
On the other hand, companies that repurchase shares reduce the total share count. If shares are repurchased at reasonable valuations, buybacks can boost earnings per share and increase your stake in the business without you doing anything.
Tracking a stock’s share count gives you insight into how a company allocates capital and whether it’s creating long-term value for shareholders.
As you can see below, Alphabet’s share count has steadily declined in recent years due to its aggressive share buyback program. This has helped offset dilution and increased value per share for long-term investors.

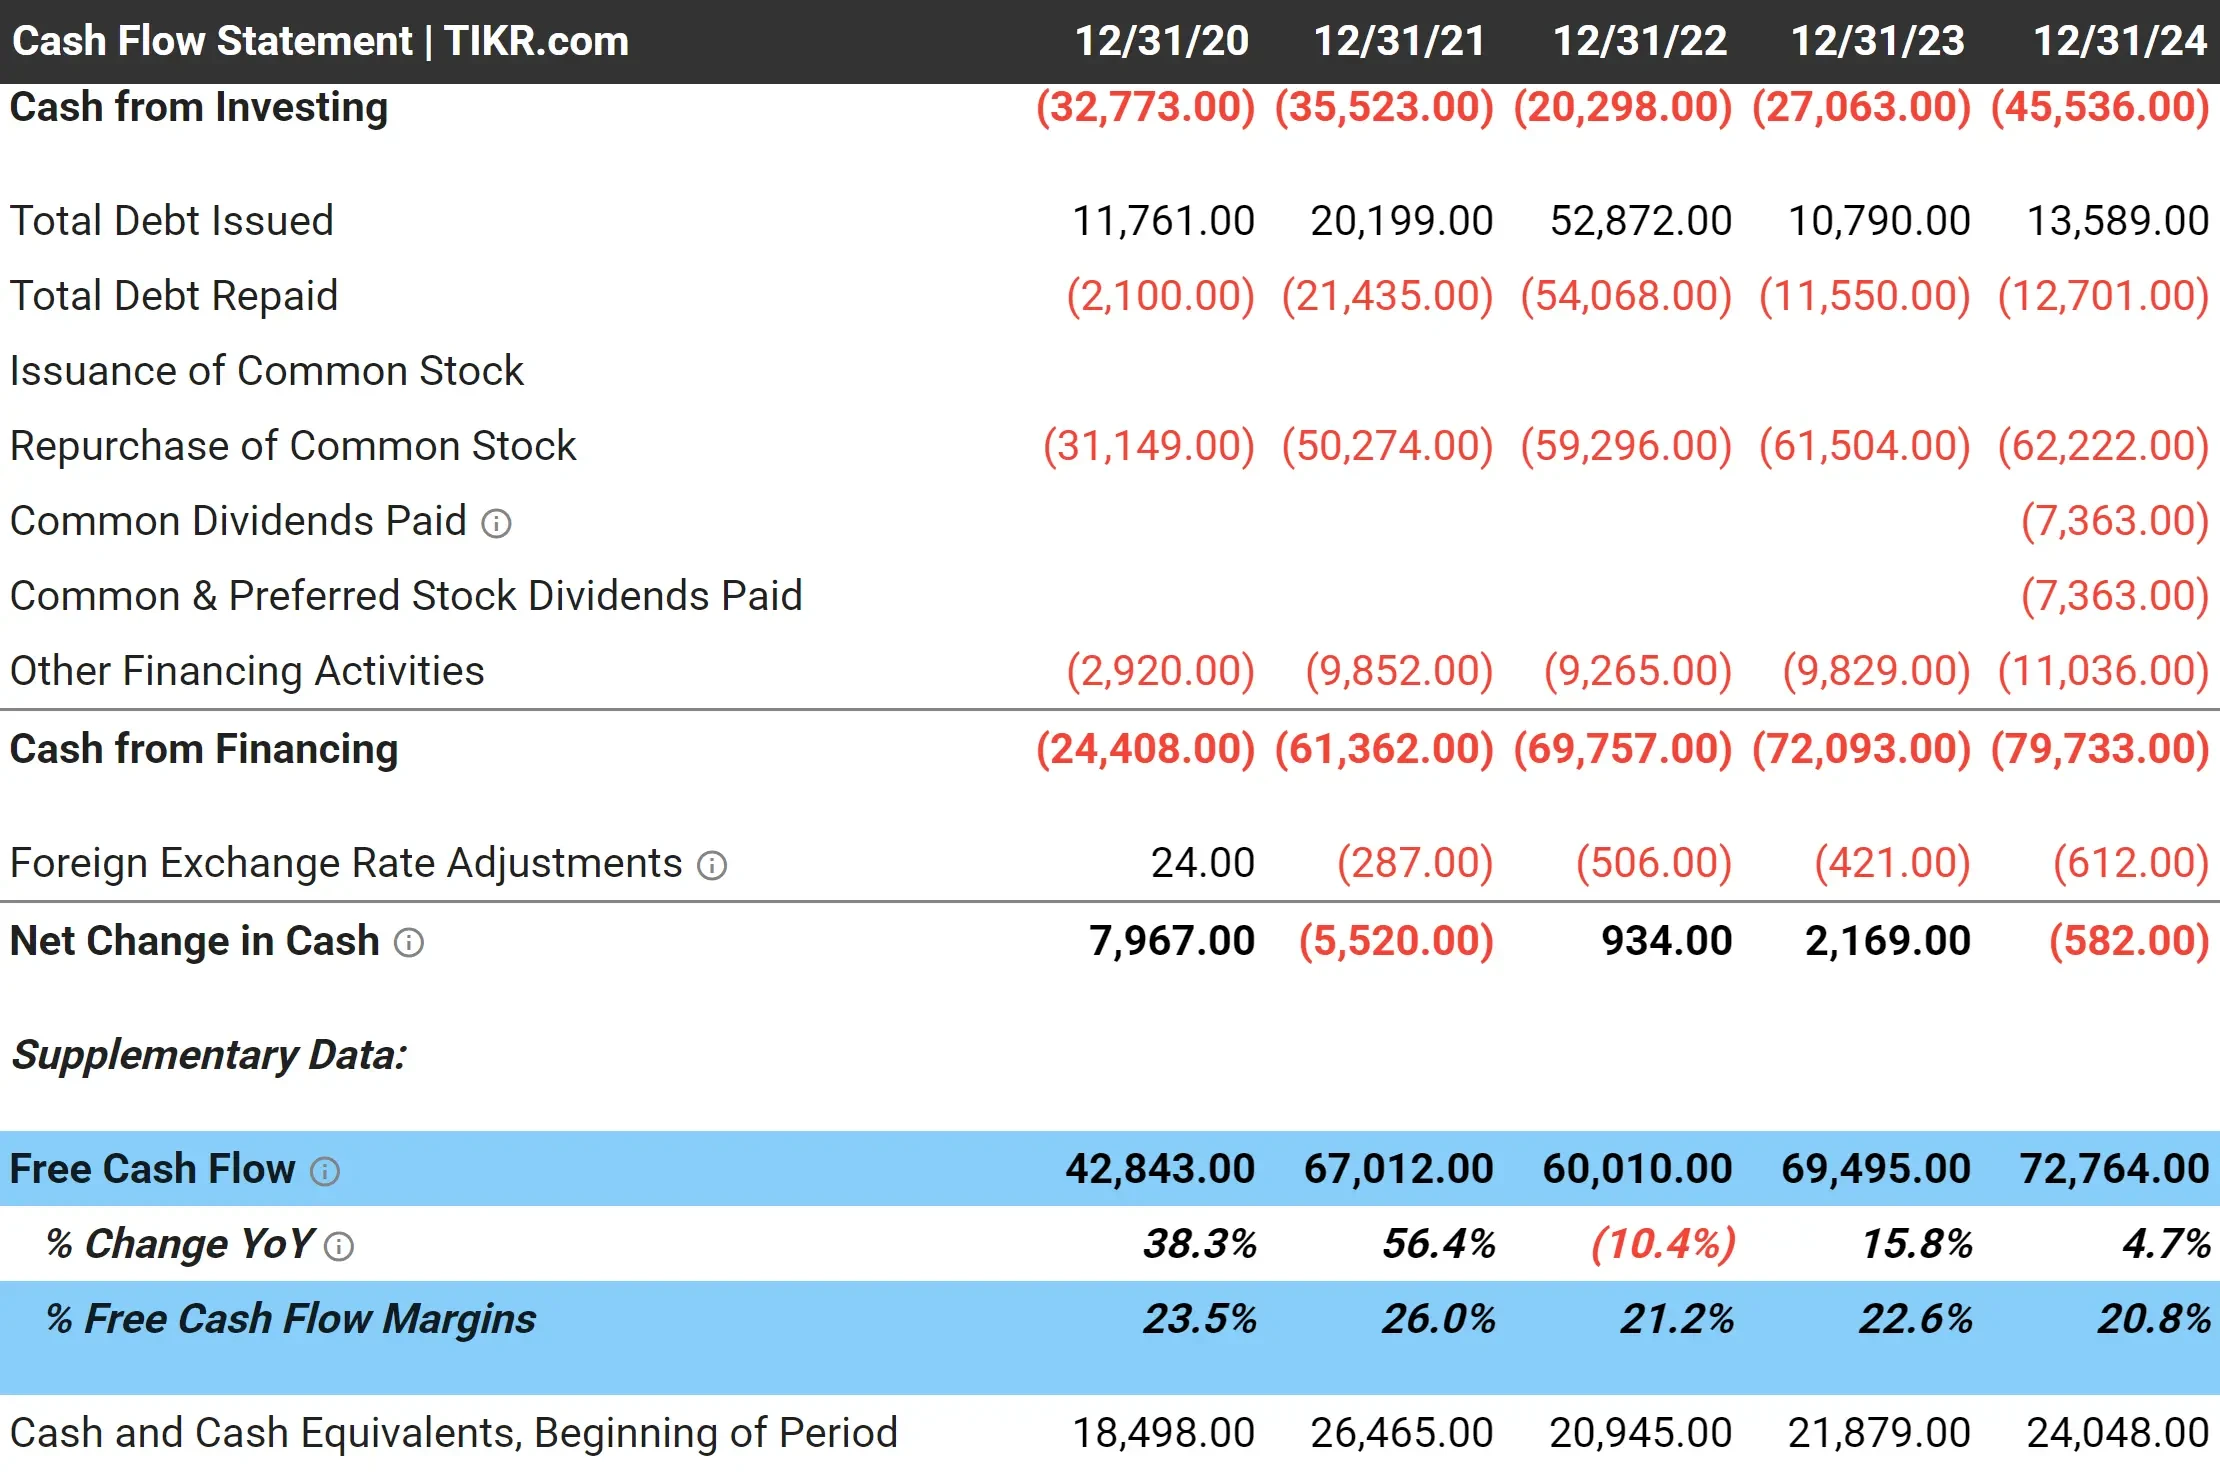
You can also check a stock’s Cash Flow Statement to see how much a company is spending on share repurchases or raising capital through new stock issuance.
Alphabet hasn’t issued new shares in recent years and has consistently spent around $50-$60 billion annually on buybacks over the past four years.

How to track share count trends on TIKR:
- Search for a company on TIKR
- Go to Financials > Income Statement
- Scroll down to view Diluted Shares Outstanding
- Compare the share count year by year to see whether it’s rising or falling
- Also, go to Financials > Cash Flow Statement to view a company’s issuance or repurchase of shares
See detailed financials and analyst estimates on over 100,000 global stocks on TIKR (It’s free) >>>
4. Earnings Quality
Earnings quality measures how reliable a company’s reported profits are. The goal is to understand whether a business is generating real cash, not just accounting income.
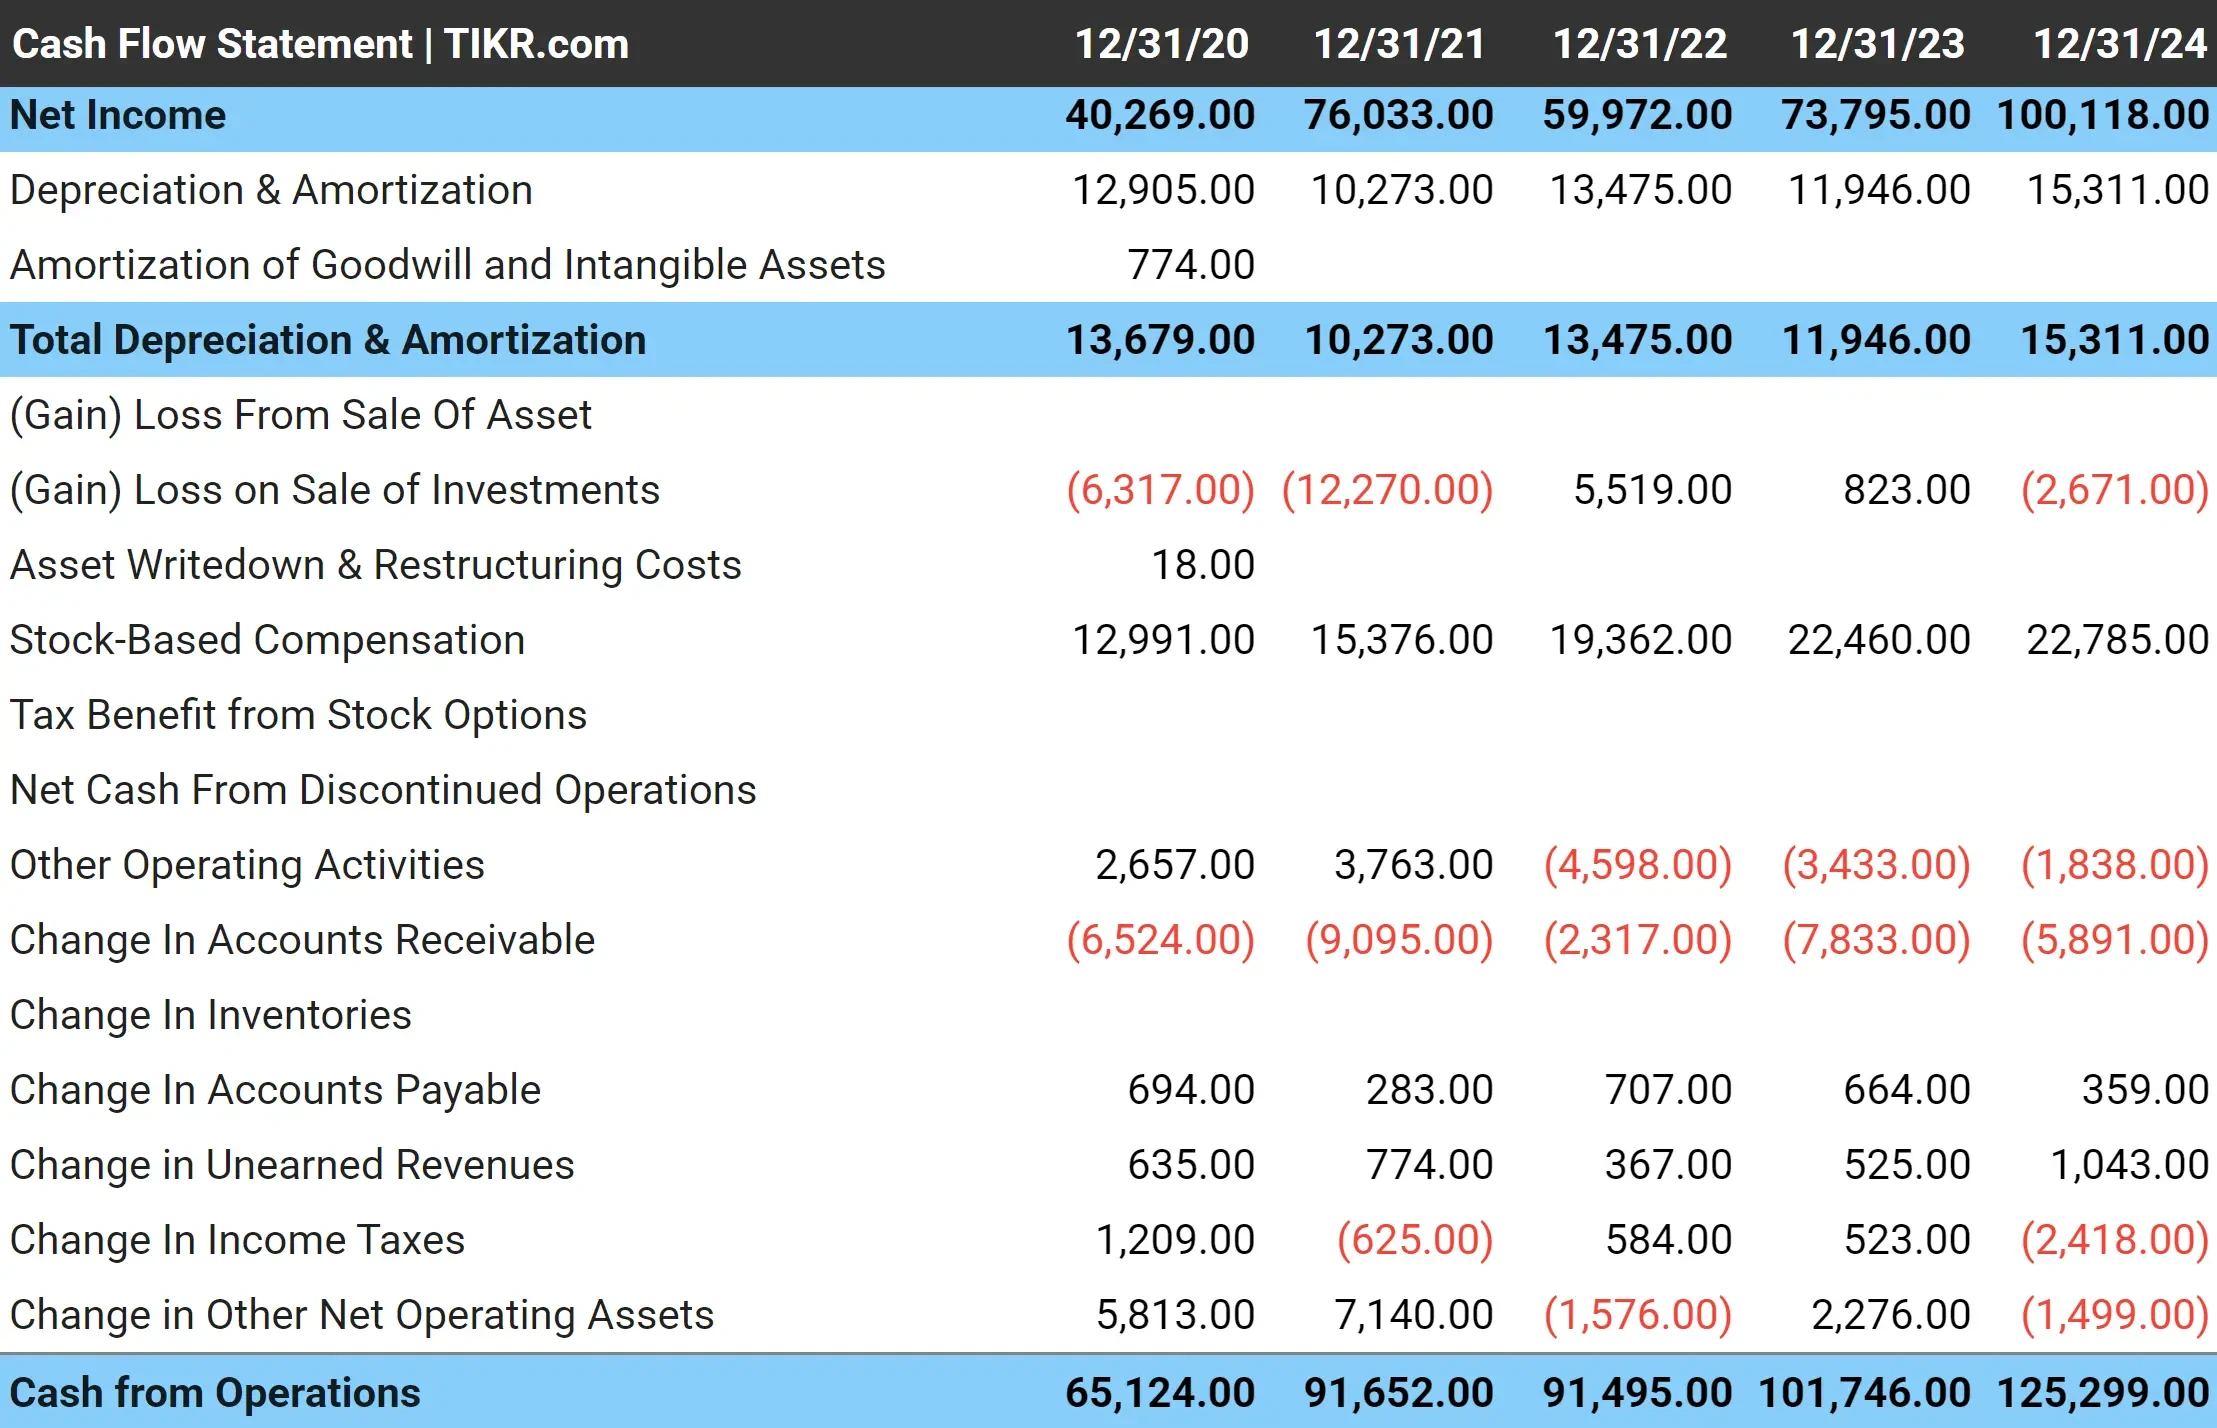
One of the clearest ways to assess this is by comparing Cash from Operations (CFO) to Adjusted Net Income + Depreciation & Amortization. This tells you whether the company’s earnings are backed by actual cash flow from the core business.
Ideally, you’d like to see that Cash from Operations is greater than or equal to Net Income + Depreciation & Amortization:
CFO ≥ Adjusted Net Income + Depreciation & Amortization
If Cash from Operationsd is consistently less than 70 percent of net income, it may be a warning sign. But if it regularly exceeds 90 percent, the company likely has high-quality, cash-backed profits and efficient working capital management.
Another signal of strong earnings quality is a healthy Free Cash Flow (FCF) margin, which shows how much of a company’s revenue is turning into free cash flow. The higher the margin, the more financial flexibility the business has to reinvest, reduce debt, or return capital to shareholders.
Why it matters:
Reported earnings can be influenced by accounting adjustments, one-time items, or changes in revenue timing. Cash is harder to manipulate. If a company reports strong profits but struggles to generate cash, that can be a red flag.
As shown below, Alphabet’s cash from operations has consistently exceeded its adjusted net income plus depreciation and amortization in the past 5 years. This indicates high earnings quality.
Alphabet has maintained healthy FCF margins over time, consistently above 20%. Even during slower growth years like 2022, FCF margin held at 21.2%, and in 2024 it reached 20.8% on nearly $73B of FCF, reflecting durable operating efficiency and disciplined capital spending.
How to track earnings quality on TIKR:
- Search for a company on TIKR
- Navigate to Financials > Cash Flow Statement
- Compare cash from operations (CFO) with net income and D&A under Financials > Cash Flow Statement
- On the Cash Flow Statement, check the stock’s free cash flow margin
- Look at the 3–5 year trend for each of these metrics to see whether the company’s cash generation is stable, improving, or deteriorating
Find stocks analysts think will explode with TIKR’s detailed analyst estimates (It’s free) >>>
5. ROIC vs WACC
Return on invested capital (ROIC) shows how efficiently a company uses to create operating profit.
ROIC is more comprehensive than return on equity (ROE), which looks only at shareholder equity. Since ROIC looks at a company’s profit on its equity and debt, it offers a more complete view of how effectively the company drives returns across all funding sources.
High ROIC suggests smart capital allocation, pricing power, and strong operational discipline.
On the other hand, weighted average cost of capital (WACC) reflects the average rate the company pays to raise capital from lenders and shareholders. It blends the cost of debt and equity based on the company’s capital structure.
The key is the spread between the two. You generally want to see ROIC exceed WACC by at least 2 percentage points:
ROIC > WACC = value creation
ROIC < WACC = value destruction
For context, WACC is often around 8% for many companies. Capital-light tech industries like software tend to have higher costs of capital (8–10%), while utilities or stable consumer businesses usually have closer to 5–6% because they use lower cost debt.
Why it matters:
A company that consistently earns more on its capital than it costs to raise that capital is creating value with every reinvested dollar. That’s one of the clearest signs of a high-quality business.
If a company consistently earns more on its capital than it costs to raise that capital, it likely has pricing power, operational efficiency, or a competitive moat. That’s what makes it a long-term compounder.
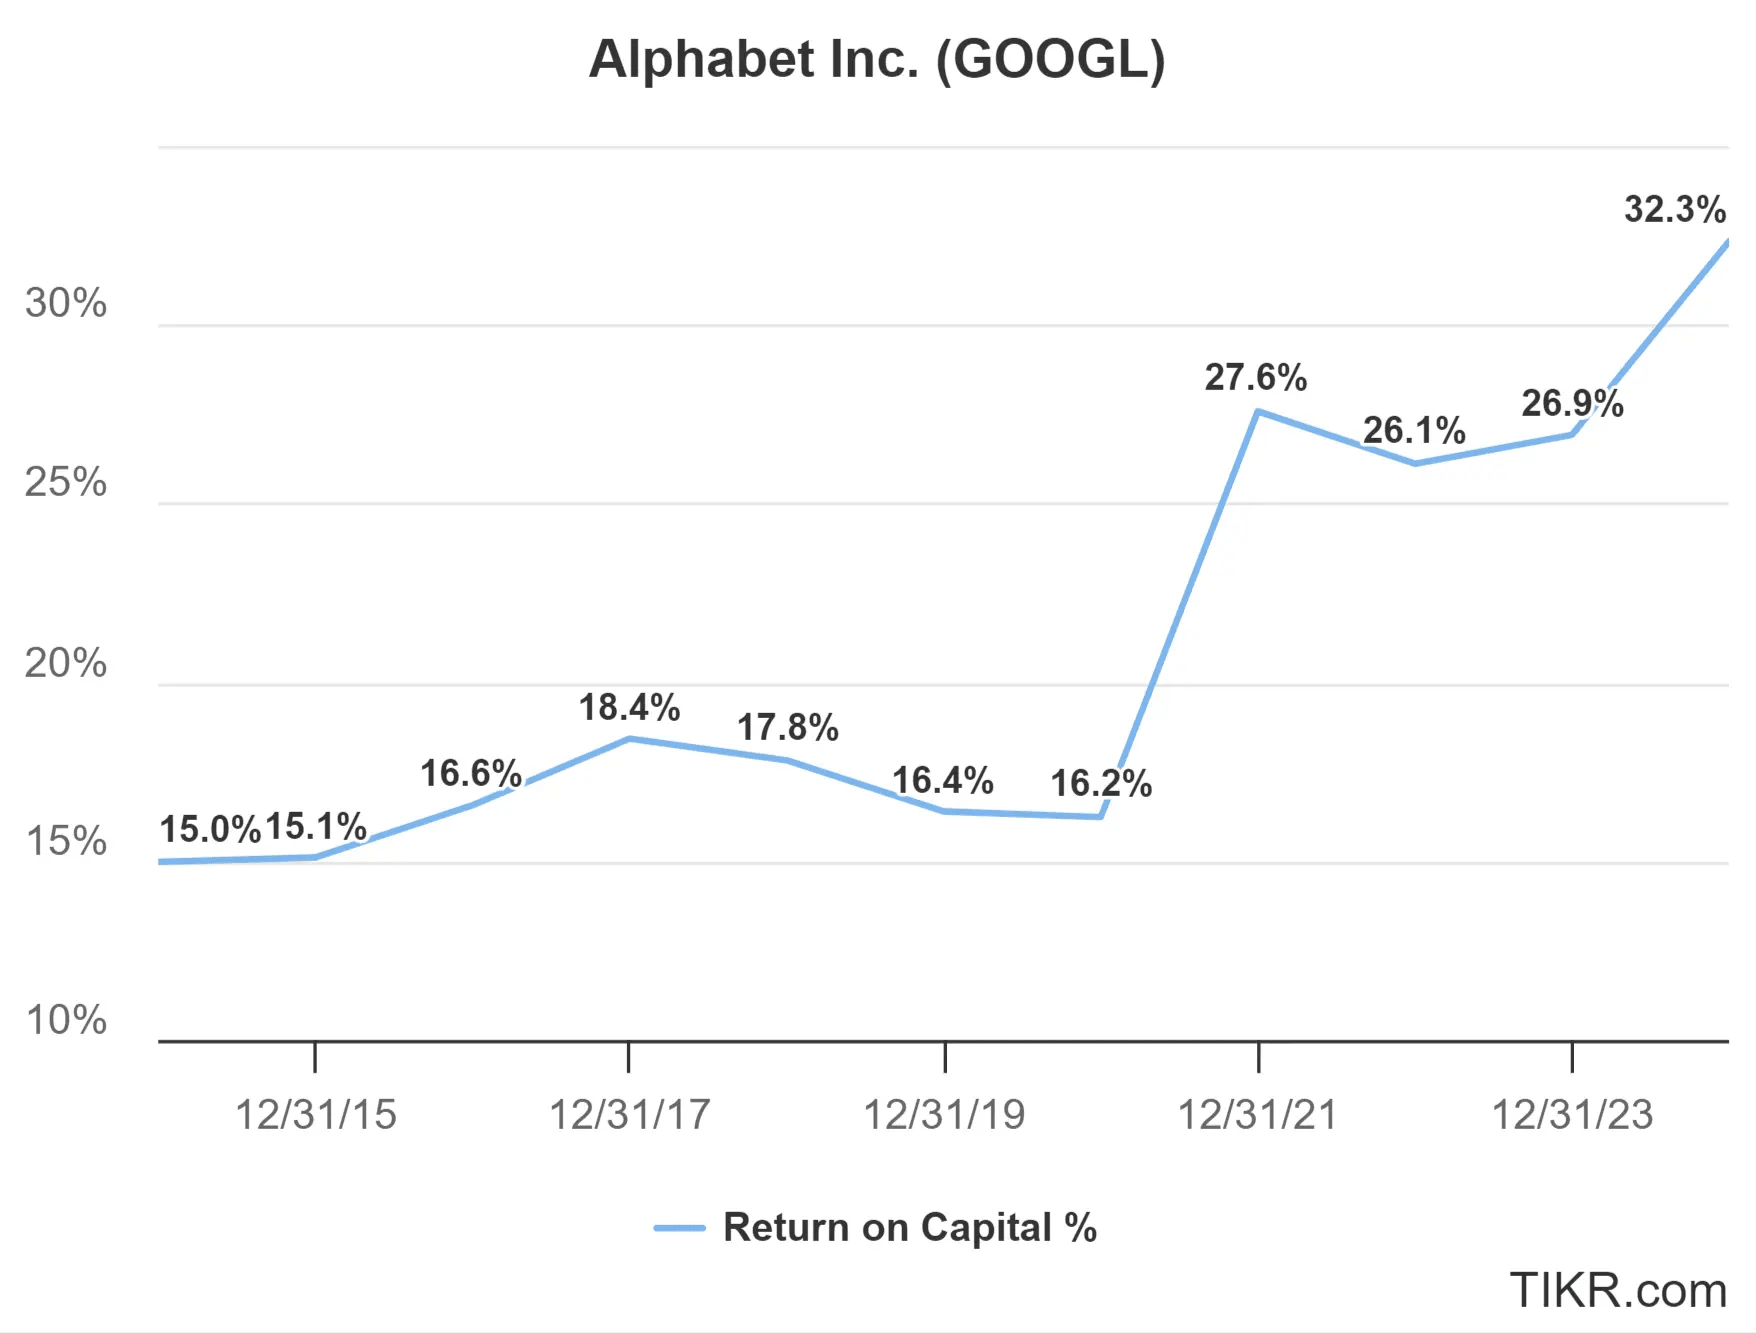
As you can see below, Alphabet’s return on invested capital hovered in the mid-teens from 2015 to 2020, reflecting solid but steady capital efficiency.
Since 2021, Alphabet’s ROIC has surged to reach 32.3% in 2024, showing that the company has dramatically improved its ability to generate profit from its capital base due to its stronger margins, tighter cost control, and high-return investments.
How to track ROIC on TIKR:
- Search for a company on TIKR
- Go to Financials > Ratios
- Under Return Ratios, you can view ROIC
- Observe ROIC across several years to spot companies that see consistently high returns on capital
TIKR Takeaway:
Most investors focus on surface-level metrics like revenue and earnings, but those only tell part of the story. If you want to invest like the best, you need to dig into metrics that reveal a company’s true quality, efficiency, and discipline.
The five metrics in this article (Operating Leverage, Margin Trends, Share Count Trend, Earnings Quality, and ROIC vs WACC) can help you spot high-quality businesses before the market fully recognizes them.
With TIKR, you can easily track all of these using clean financial data, analyst forecasts, and valuation tools built to help you make smarter investing decisions.
Want to Invest Like Warren Buffett, Joel Greenblatt, or Peter Lynch?
TIKR just published a special report breaking down 5 powerful stock screeners inspired by the exact strategies used by the world’s greatest investors.
In this report, you’ll discover:
- A Buffett-style screener for finding wide-moat compounders at fair prices
- Joel Greenblatt’s formula for high-return, low-risk stocks
- A Peter Lynch-inspired tool to surface fast-growing small caps before Wall Street catches on
Each screener is fully customizable on TIKR, so you can apply legendary investing strategies instantly. Whether you’re looking for long-term compounders or overlooked value plays, these screeners will save you hours and sharpen your edge.
This is your shortcut to proven investing frameworks, backed by real performance data.
Click here to sign up for TIKR and get this full report now, completely free.
FAQ Section:
What is free cash flow conversion, and why does it matter to investors?
Free cash flow conversion shows how much of a company’s accounting earnings turn into real cash flow, which is an important sign of financial health and earnings quality.
How do you compare ROIC and WACC when analyzing a stock?
Comparing ROIC to WACC helps investors determine if a company is generating returns that exceed its cost of capital, which is a signal of value creation and competitive advantage.
What is a good reinvestment rate for long-term stock growth?
A good reinvestment rate is one where the company retains a large portion of earnings and can deploy it at high returns, fueling long-term compounding.
How do EBITDA and gross margin trends affect stock performance?
Improving margins suggest better pricing power and cost efficiency, which often leads to stronger earnings growth and stock performance over time.
Why should investors track a company’s share count trend?
Share count affects earnings per share and ownership. A rising share count can dilute returns, while buybacks can enhance shareholder value if done at attractive prices.
Looking for New Opportunities?
- See what stocks billionaire investors are buying so you can follow the smart money.
- Analyze stocks in as little as 5 minutes with TIKR’s all-in-one, easy-to-use platform.
- The more rocks you overturn… the more opportunities you’ll uncover. Search 100K+ global stocks, global top investor holdings, and more with TIKR.
Disclaimer:
Please note that the articles on TIKR are not intended to serve as investment or financial advice from TIKR or our content team, nor are they recommendations to buy or sell any stocks. We create our content based on TIKR Terminal’s investment data and analysts’ estimates. We aim to provide informative and engaging analysis to help empower individuals to make their own investment decisions. Neither TIKR nor our authors hold any positions in the stocks mentioned in this article. Thank you for reading, and happy investing!