Key Stats for Xylem Stock
- 6-Month Performance: -10%
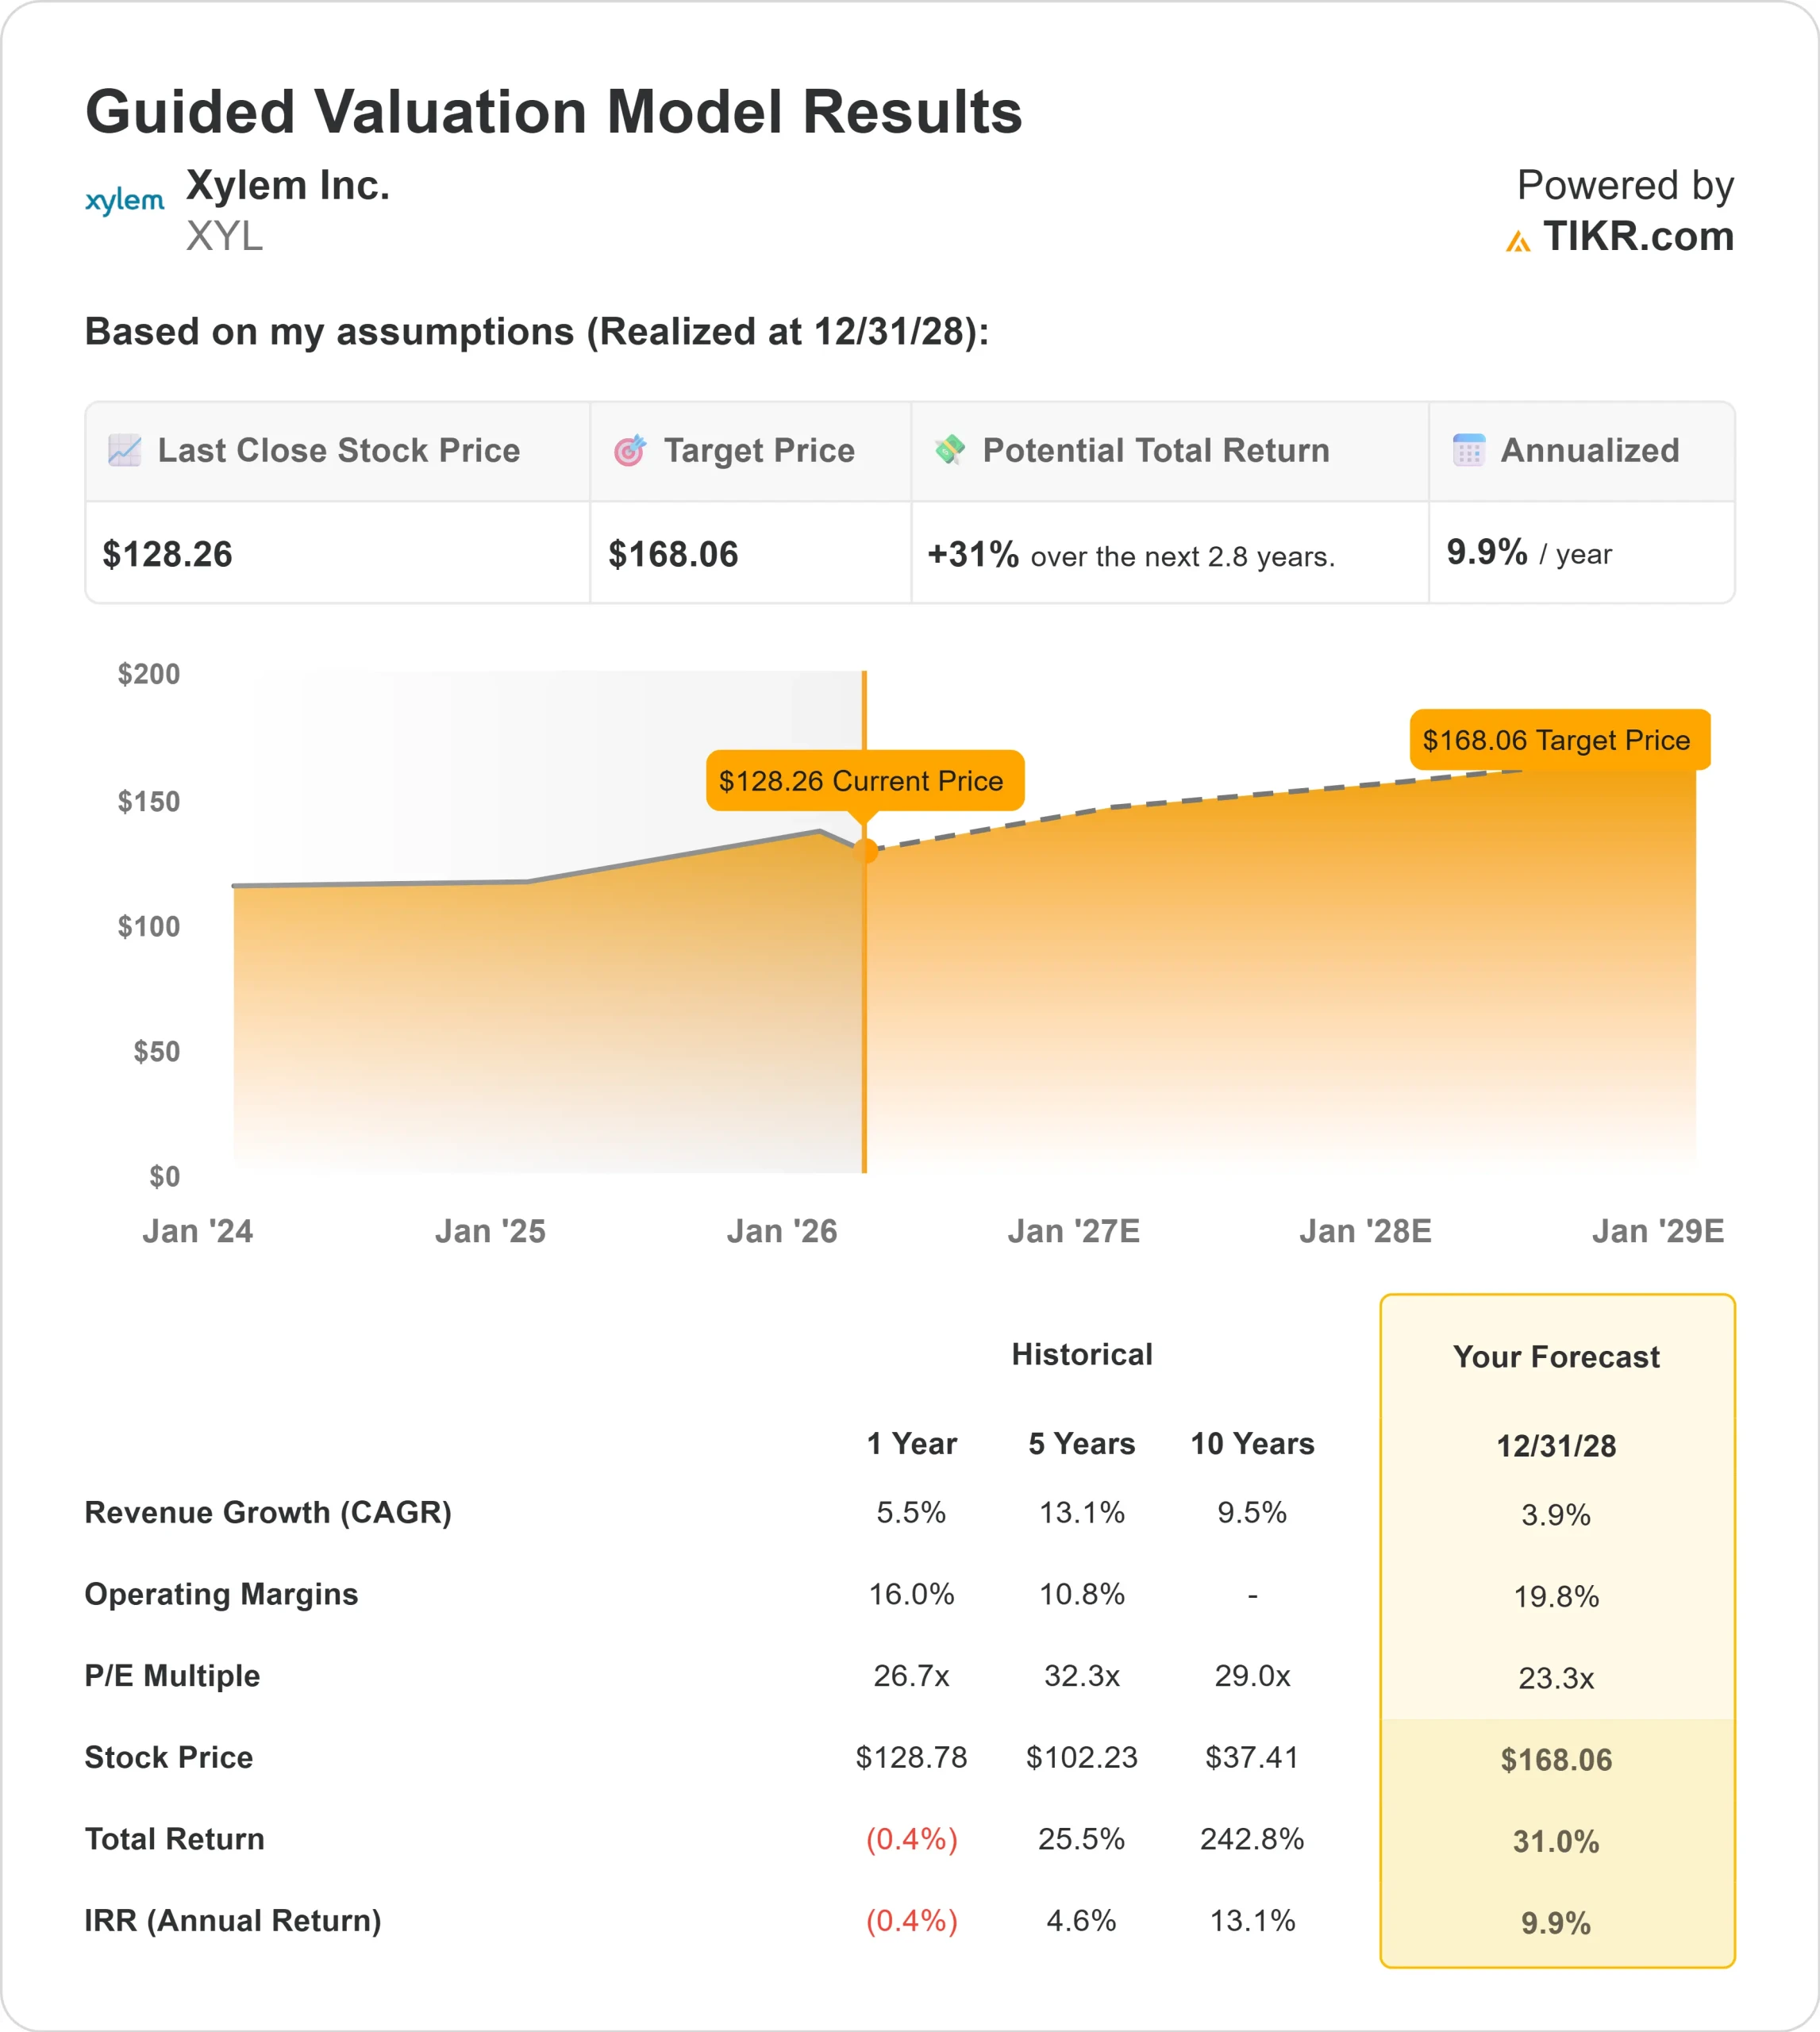
- 52-Week Range: $100 to $154
- Valuation Model Target Price: $168
- Implied Upside: 31%
Value your favorite stocks like Xylem with 5 years of analysts’ forecasts using TIKR’s new Valuation Model (It’s free) >>>
What Happened?
Xylem stock has fallen about 10% over the last six months, recently trading near $128 per share, as investors reacted to moderating revenue growth expectations for 2026 despite record profitability.
The pullback reflects a reset in growth assumptions after management guided to 1% to 3% reported revenue growth this year, including a roughly 2% headwind from portfolio simplification actions under its 80/20 program.
The stock declined following the company’s fourth quarter earnings release, where revenue rose 4% and full-year sales increased 5%, but guidance emphasized slower top-line growth as the company exits lower-quality revenue.
Adjusted EBITDA margin expanded to 23% in Q4 and 22% for the full year, driving record quarterly EPS of $1.42, up 20%.
CEO Matthew Pine said the team delivered “an outstanding fourth quarter to close a record year for Xylem,” yet the market focused more on tempered revenue growth than margin expansion.
For 2026, management expects revenue between $9.1 billion and $9.2 billion, EBITDA margins of 23% at the midpoint, and EPS of $5.35 to $5.60, up 8% at the midpoint.
Measurement & Control Solutions is projected to grow mid single digits, supported by 22% order growth in the fourth quarter and a roughly $5 billion total company backlog, including about $1.4 billion in MCS.
Water Infrastructure and Applied Water are expected to grow at low single-digit rates as simplification actions create a temporary top-line drag but support higher-quality earnings.
Institutional positioning remains active. Vanguard increased its stake by 0.7% to nearly 30 million shares worth about $4.4 billion, representing roughly 12% ownership.
Bowen Hanes raised its position by more than 500% to about 350,000 shares valued at roughly $52 million, while NEOS Investment Management boosted its stake by 47%. Tredje AP fonden added 12%, bringing holdings to nearly 700,000 shares worth about $103 million.
Institutional ownership remains high at about 88%, indicating sustained long-term sponsorship despite recent share price weakness.
See analysts’ growth forecasts and price targets for Xylem (It’s free) >>>
Is Xylem Undervalued?
Under valuation assumptions, the stock is modeled using:
- Revenue Growth (CAGR): 4%
- Operating Margins: 20%
- Exit P/E Multiple: 23x
Revenue is projected to expand from about $9.2 billion in 2026 to roughly $11.7 billion by 2030, reflecting steady demand tied to water infrastructure upgrades, wastewater treatment modernization, and utility digitalization rather than cyclical industrial acceleration.
Margin expansion toward 20% assumes continued mix shift toward analytics, smart metering, and software-enabled solutions that carry structurally higher profitability than legacy hardware.

Backlog conversion in Measurement & Control Solutions remains central, as utilities invest in leak detection, advanced metering infrastructure, and grid resilience to reduce non-revenue water losses.
Growth in outsourced water projects and data center-related demand within Water Solutions & Services also supports multi-year revenue visibility.
At the same time, 80/20 portfolio actions are expected to lift earnings quality by exiting lower-margin revenue streams.
Based on these inputs, the model estimates a target price of $168, implying about 31% total upside over the next several years, indicating the stock appears undervalued at current prices.
At current levels near $128, Xylem appears undervalued, with future performance driven primarily by digital water adoption, infrastructure spending execution, and sustained operating leverage rather than aggressive revenue acceleration.
Estimate a company’s fair value instantly (Free with TIKR) >>>
Value Any Stock in Under 60 Seconds (It’s Free)
With TIKR’s new Valuation Model tool, you can estimate a stock’s potential share price in under a minute.
All it takes is three simple inputs:
- Revenue Growth
- Operating Margins
- Exit P/E Multiple
From there, TIKR calculates the potential share price and total returns under Bull, Base, and Bear scenarios so you can quickly see whether a stock looks undervalued or overvalued.
If you’re not sure what to enter, TIKR automatically fills in each input using analysts’ consensus estimates, giving you a quick, reliable starting point.
See a stock’s true value in under 60 seconds (Free with TIKR) >>>