


Key Stats for Visa Stock
- 52-Week Range: $293.89 to $373.97
- Street Mean Target: $416.20
- TIKR Target Price (Mid): ~$692
- TIKR Annualized IRR (Mid): ~17% per year
- Q3 FY2026 Net Revenue: $11.6B (up 14% YoY)
- Q3 FY2026 Non-GAAP EPS: $3.32 (up 11% YoY)
- LTM Gross Margin: 97.7%
Model Visa’s next five years of growth with TIKR’s free Valuation Model (It’s free) >>>
The Network That Connects 200 Countries and Grows Stronger With Every Transaction
Visa (V) does not lend money, take deposits, or own the merchants that accept its cards. What it does is run the rails. Every time a Visa card is swiped, tapped, or entered online anywhere in the world, a transaction flows across Visa’s network, and Visa collects a small fee for moving it.
The company operates in more than 200 countries and territories, connecting roughly 4.4 billion credentials, 130 million merchant locations, and over 14,500 financial institution clients. No single bank, retailer, or consumer can opt out of the network without losing access to a significant portion of global commerce.
That structural position is what makes Visa’s economics so unusual. With 98% gross margins and nearly 67% EBIT margins, the business generates an extraordinary amount of profit per dollar of revenue. It requires no factories, inventory, or physical infrastructure in each new market it enters.
Every new transaction that flows across the network is essentially pure margin at the incremental level, which is why net income has grown from $12.3 billion in FY2021 to $20 billion in FY2025, even as the company invested in international expansion and value-added services.

The revenue chart shows what compounding looks like over time. From $24.1 billion in FY2021, revenue has grown every single year to $40 billion in FY2025. Consensus estimates project continued acceleration, with revenue reaching around $45.8 billion in FY2026 and climbing toward $67.6 billion by FY2030.
The slope is not a hockey stick fueled by speculation; it is the predictable output of a network that processes more transactions every year as the global economy continues its long shift away from cash.
See historical and forward estimates for Visa stock (It’s free!) >>>
A Record Quarter Powered by Value-Added Services, the FIFA World Cup, and Resilient Spending
Visa’s fiscal Q3 2026 results demonstrated the business firing on multiple cylinders. Net revenue grew 14% year over year to $11.6 billion, beating the $11.38 billion consensus. Non-GAAP EPS of $3.32 rose 11% and beat the $3.23 estimate.
Global payments volume crossed $4 trillion in a single quarter for the first time in Visa’s history, growing 10% in constant dollars. Cross-border volume grew 13%, driven partly by FIFA World Cup travel. Processed transactions reached 71.7 billion, up 10%.
The standout metric was value-added services revenue, which surged 34% in constant dollars to $3.8 billion and now represents nearly a third of total revenue.
Value-added services include Visa Direct, which enables real-time money movement between individuals and businesses, as well as fraud prevention tools, issuer analytics, and agentic commerce infrastructure as Visa partners with companies like OpenAI to enable AI-driven payments.
CEO Ryan McInerney described the quarter plainly: “Visa delivered a strong fiscal third quarter, with net revenue up 14% year-over-year. Consumer and business spending remains resilient, and our strategy continues to deliver strong performance.”
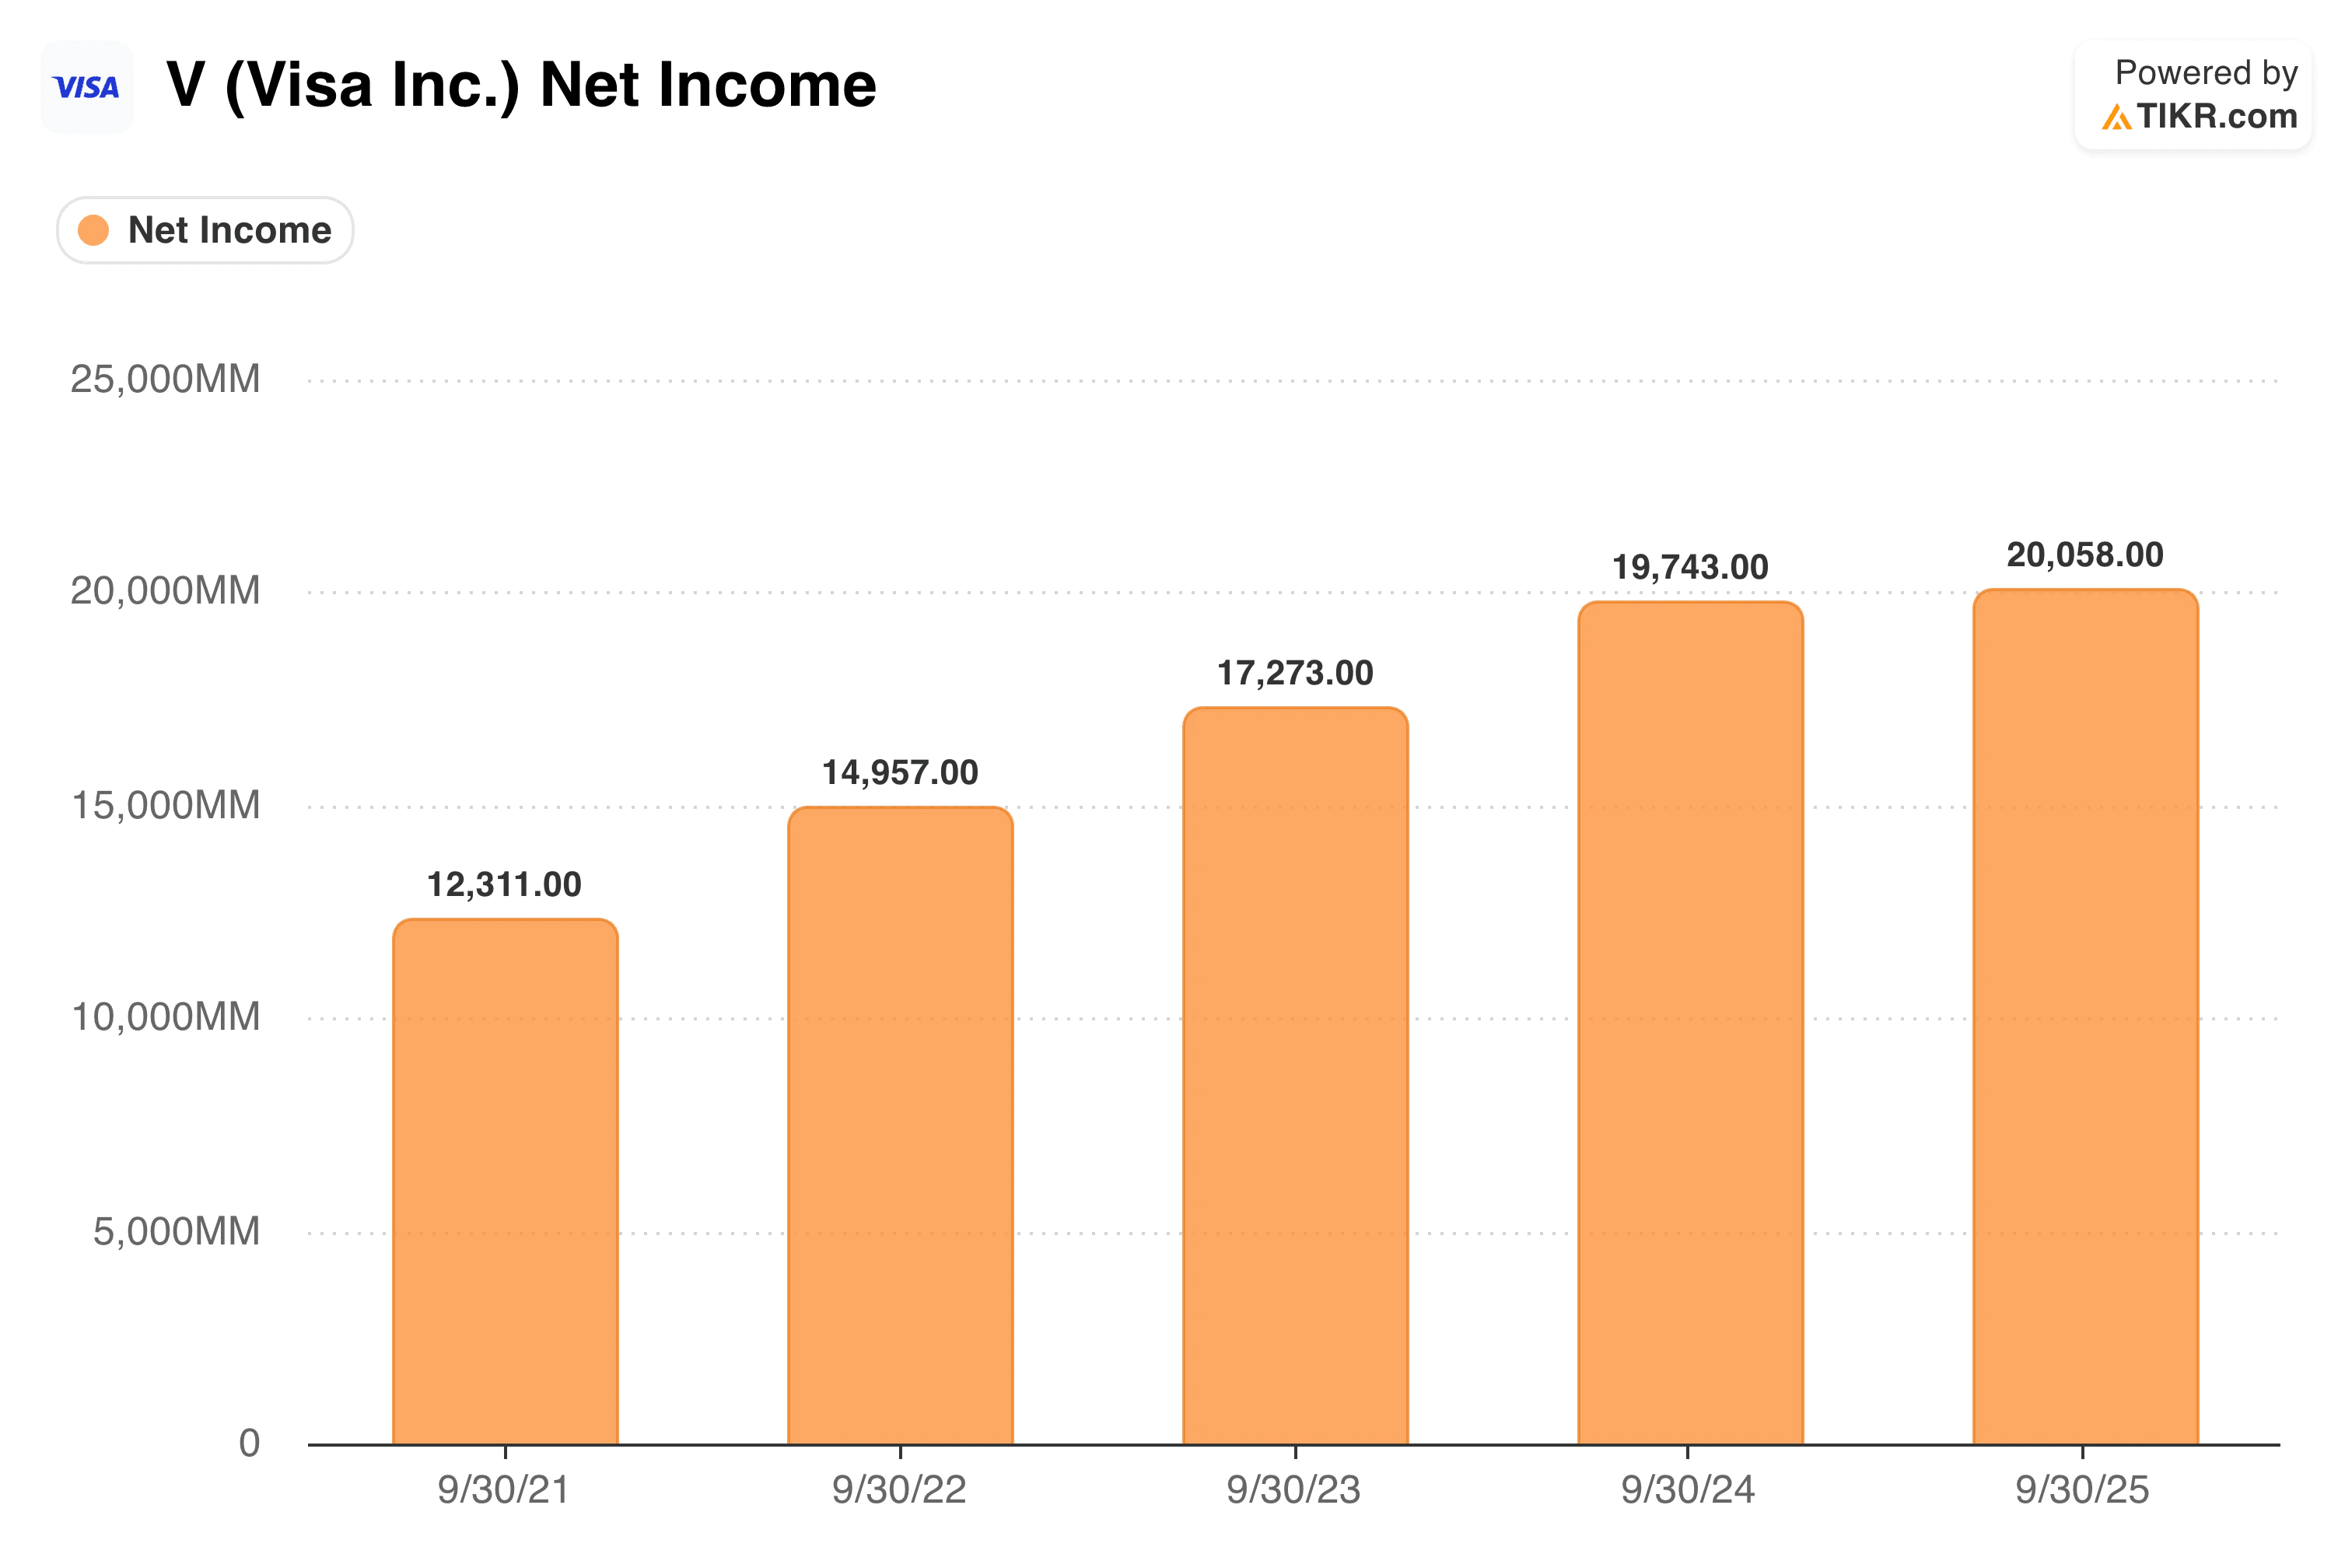
The net income chart shows the earnings power the toll-road model generates at scale. From $12.3 billion in FY2021, net income grew steadily to $20 billion in FY2025.
The growth rate slowed slightly in FY2025 due to litigation provisions, but the absolute level is striking. Visa returned $6.2 billion to shareholders in Q3 2026 alone through buybacks and dividends, with $28.4 billion remaining under its buyback authorization.
Read our full take on Visa’s earnings, margins, and valuation upside >>>
What the Valuation Model Says at $364
At around 25 times forward earnings, Visa trades at a premium reflecting the consistency and durability of the network.
The Street’s mean target of around $416 implies roughly 14% upside from current levels, suggesting analysts see meaningful room even from near the 52-week high.

The TIKR valuation model works from a mid-case assumption of around 10% annual revenue growth and net income margins near 54%, arriving at a target of around $692. That implies a potential total return of around 90% over roughly four years, or about 17% annualized.
The model bakes in modest P/E compression, meaning returns come from earnings growth and buybacks rather than multiple expansion. The scenario range runs from around 7.5% annualized in the low case to around 14.5% in the high case.
Should You Buy V Stock?
Visa is one of the most defensible businesses in the world. Network effects, switching costs, and global merchant acceptance have created a competitive position that has strengthened over decades rather than eroded, and value-added services growing to nearly a third of revenue suggest the growth ceiling is higher than the core payments business alone would imply.
A 25x forward earnings multiple is not cheap in absolute terms, but for a business compounding EPS at around 14% annually with nearly infinite operating leverage on incremental volume, it is not obviously expensive either.
The primary risk is regulatory and competitive. Governments have periodically challenged card network fee structures, and any meaningful interchange regulation in the US or Europe would directly pressure revenue. Fintech competitors, stablecoins, and central bank digital currencies represent long-term structural questions rather than near-term threats, but they bear watching.
For long-term investors, Visa’s combination of network durability, capital returns, and expanding services revenue makes it one of the more straightforward compounders in large-cap equities.
See analysts’ growth forecasts and price targets for Visa stock (It’s free!) >>>
Looking for New Opportunities?
- See which stocks billionaire investors are buying to follow the smart money.
- Analyze stocks in as little as 5 minutes with TIKR’s all-in-one, easy-to-use platform.
- The more rocks you overturn… the more opportunities you’ll uncover. Search 100K+ global stocks, global top investor holdings, and more with TIKR.
Disclaimer:
Please note that the articles on TIKR are not intended to serve as investment or financial advice from TIKR or our content team, nor are they recommendations to buy or sell any stocks. We create our content based on TIKR Terminal’s investment data and analysts’ estimates. Our analysis might not include recent company news or important updates. TIKR has no position in any of the stocks mentioned. Thank you for reading, and happy investing!


