Key Takeaways
- Verizon yields 6.2% and Chevron 3.4%, and each paid out just over half its free cash flow as dividends in the 12 months to June 30, 2026.
- Chevron raised its dividend 5.8% a year from fiscal 2020 to fiscal 2025, against 1.9% for Verizon, and carries far less debt.
- Chevron’s coverage depends on oil prices: its free cash flow fell far short of its dividend in fiscal 2020.
- Verizon’s debt, at 3.35x EBITDA, is the main risk to watch as it keeps raising its dividend.
Anyone buying a dividend stock to hold for a decade has two reasons to look this summer. Verizon (VZ) grew free cash flow 24.4% to $6.4 billion in the second quarter of 2026 from a year earlier, and it expects 9% to 10% free cash flow growth for the full year.
Chevron (CVX) went bigger: $18.1 billion of free cash flow in the second quarter of 2026, against $4.9 billion a year before, as production jumped 20%.
Both now pay out a little over half of their free cash flow as dividends. So if I can only hold one for the next 10 years, which is it?
| Metric | Verizon (VZ) | Chevron (CVX) |
|---|---|---|
| Dividend yield | 6.2% | 3.4% |
| Dividend growth, fiscal 2020 –2025 | 1.9% a year | 5.8% a year |
| Consecutive years of raises (company’s count) | 20 | 39 |
| Cash dividend payout ratio (TTM to June 30, 2026) | 54% | 51% |
| Net debt/EBITDA (LTM) | 3.35x | 0.56x |
| Interest coverage (LTM) | 4.36x | 18.93x |
Source: TIKR, Oct. 9, 2026; raise counts from each company’s earnings calls.
Verizon: slow raises, plenty of room
Verizon’s growth is coming from service, with more customers signing up for its broadband and fewer walking away. Mobility and broadband service revenue rose 2.8% to about $23.4 billion in the second quarter of 2026, even as total revenue slipped 0.7% to $34.3 billion because fewer people upgraded their phones.
Looking ahead, management expects service revenue growth to approach 4.0% in the fourth quarter, and it expects its new AI Connect fiber business to start adding revenue in 2027.
That cash covers the dividend with room to spare. Verizon paid out a well-covered 54% of its free cash flow over the 12 months to June 30, 2026, and free cash flow has topped the dividend every year since fiscal 2018…
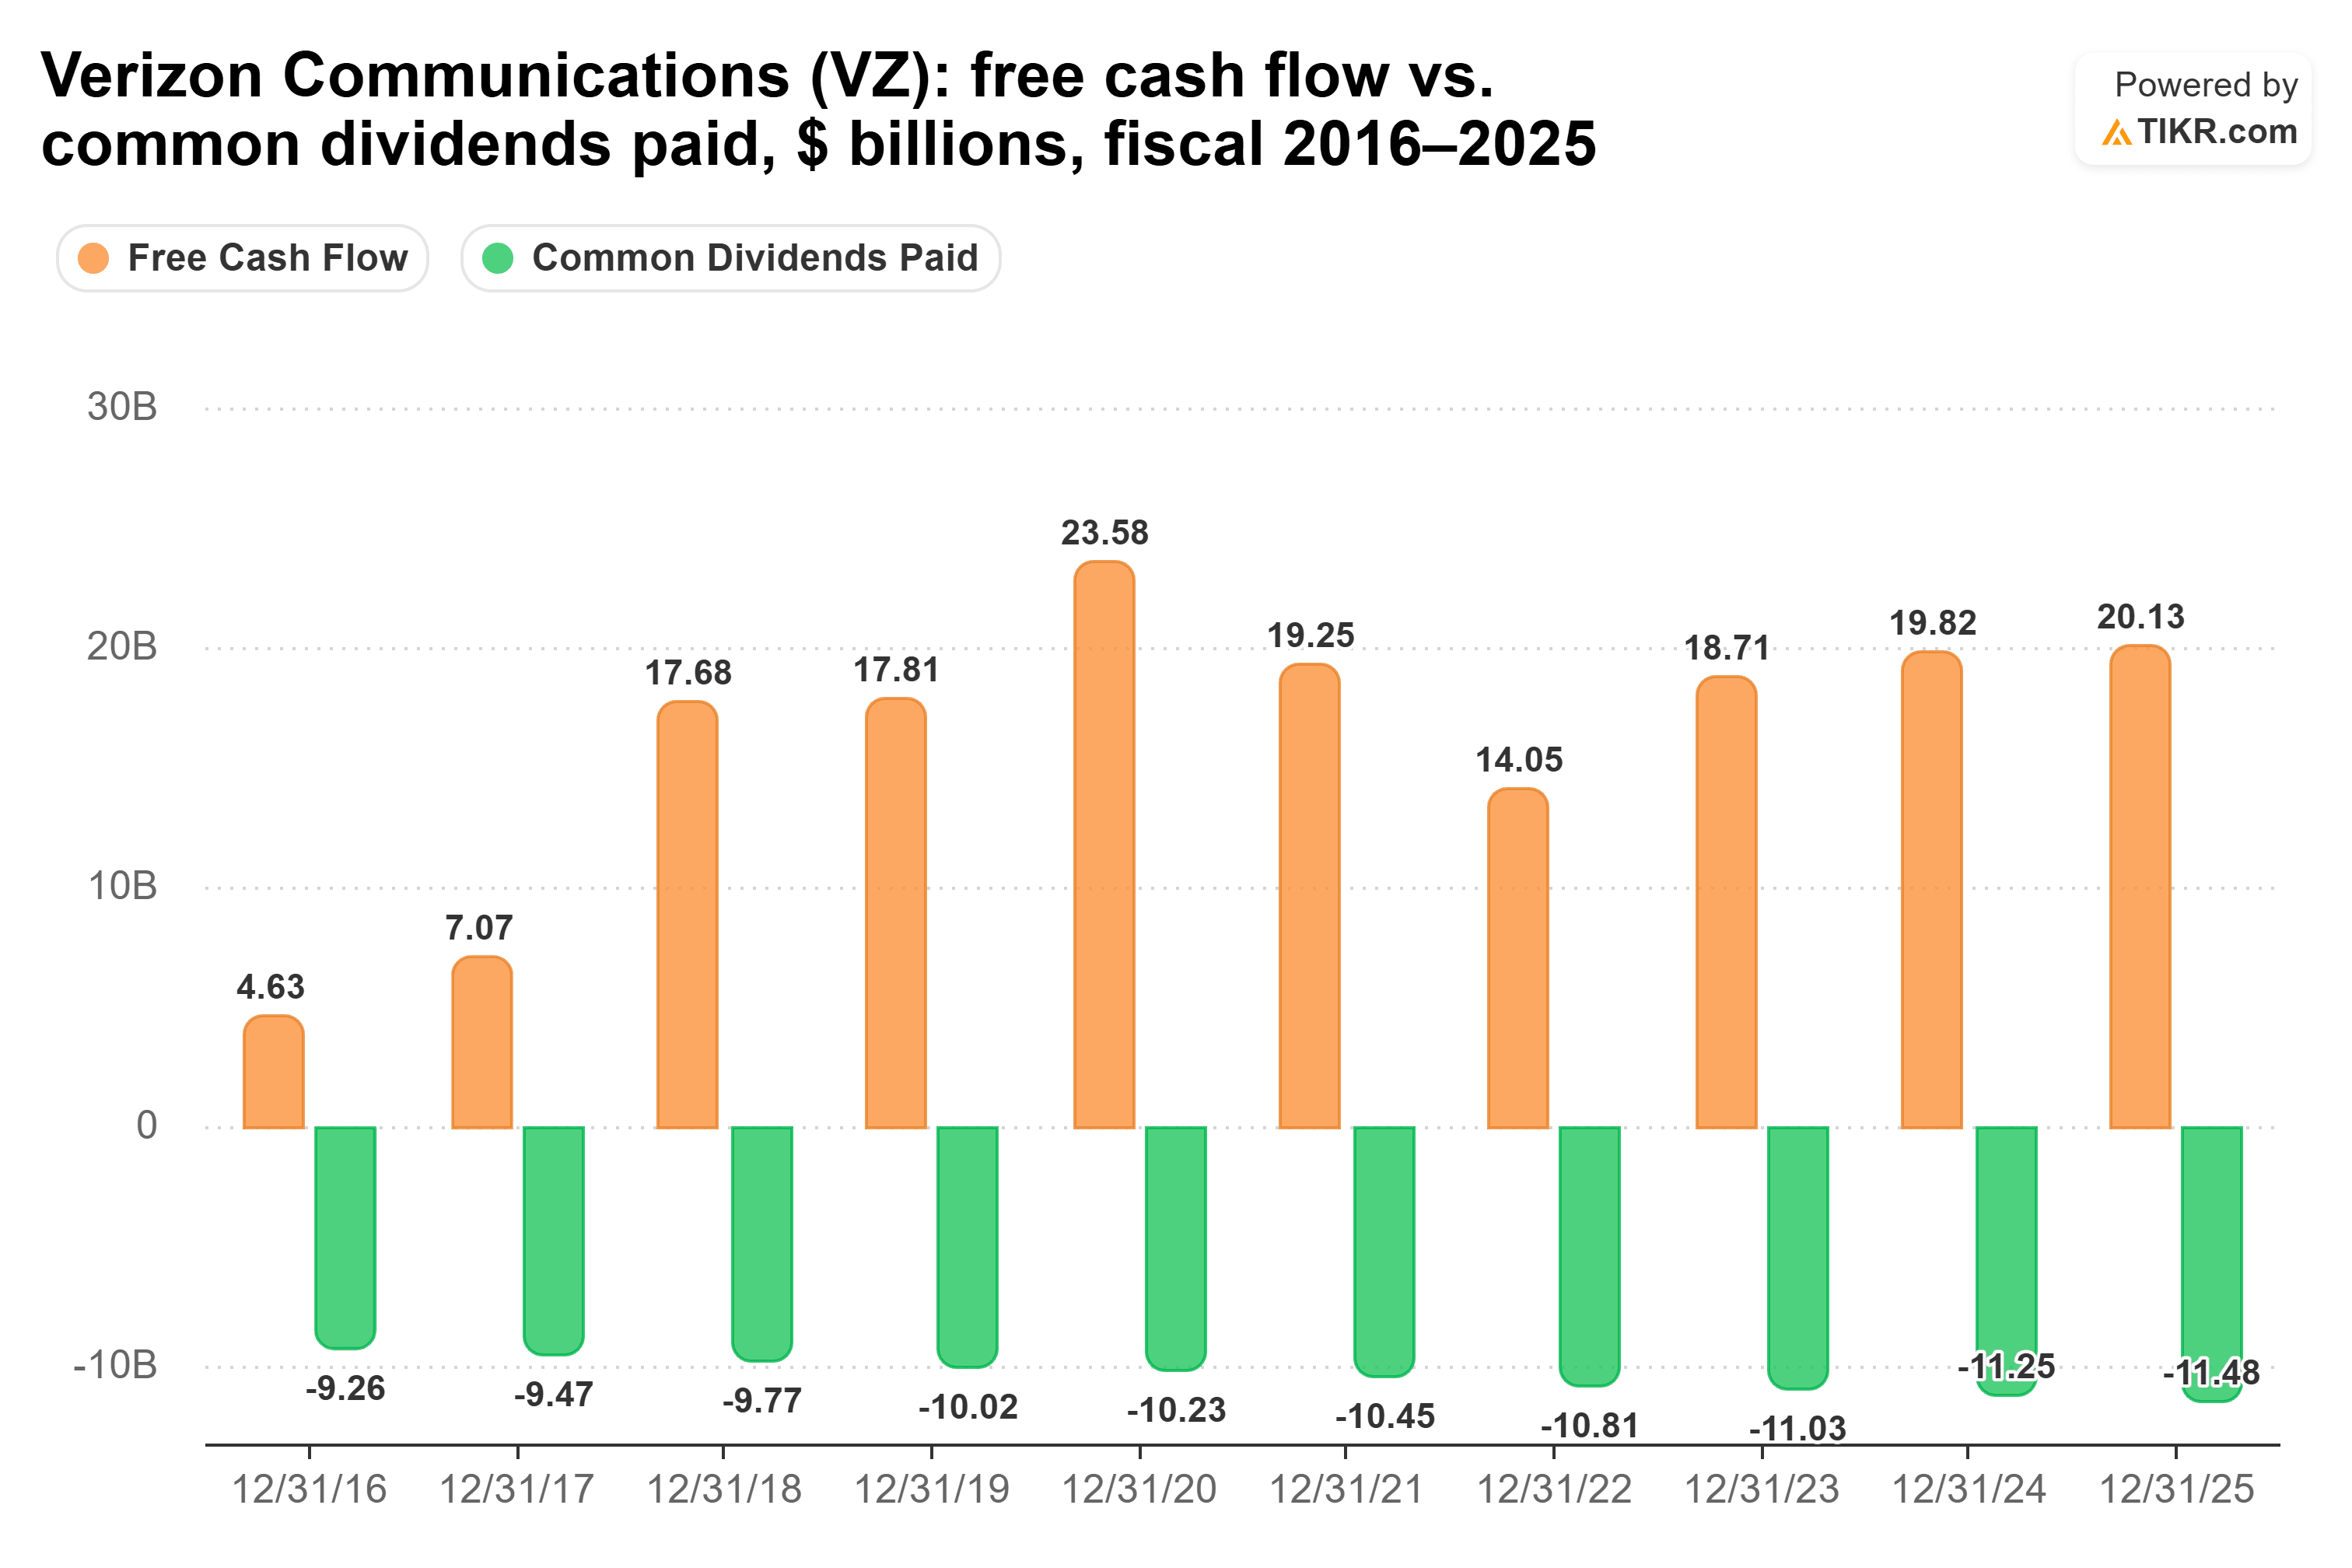
…with the payout ratio between 54% and 77% from fiscal 2021 to fiscal 2025.
“We are growing our dividend, and we are paying down our debt,” management said on its second-quarter call. The coverage backs the first half: Verizon raised its dividend 2.5% in January 2026, for what it calls “the 20th consecutive year of dividend increases.”
The second half is the risk. Net debt runs 3.35x EBITDA over the last twelve months, and EBIT covers interest just 4.36x.
Chevron: faster raises, bumpier cash
Verizon’s edge is the bigger check, but Chevron’s check is growing faster and sits on a far stronger balance sheet. Net debt is just 0.56x EBITDA, and EBIT covers interest 18.93x. Production rose 20% from a year earlier in the second quarter of 2026, helped by the Hess acquisition and growth in the Permian Basin and Gulf of America. CEO Michael Wirth put it this way on the second-quarter call: “The Hess assets are generating strong free cash flow, which has been roughly double the incremental dividends.”
Chevron paid out a well-covered 51% of its free cash flow over the 12 months to June 30, 2026. That figure leans on a huge second quarter, though, and the full-year record is bumpier: a stretched 78% in fiscal 2024 and 77% in fiscal 2025, and in fiscal 2020, free cash flow of $1.66 billion against $9.65 billion of dividends…
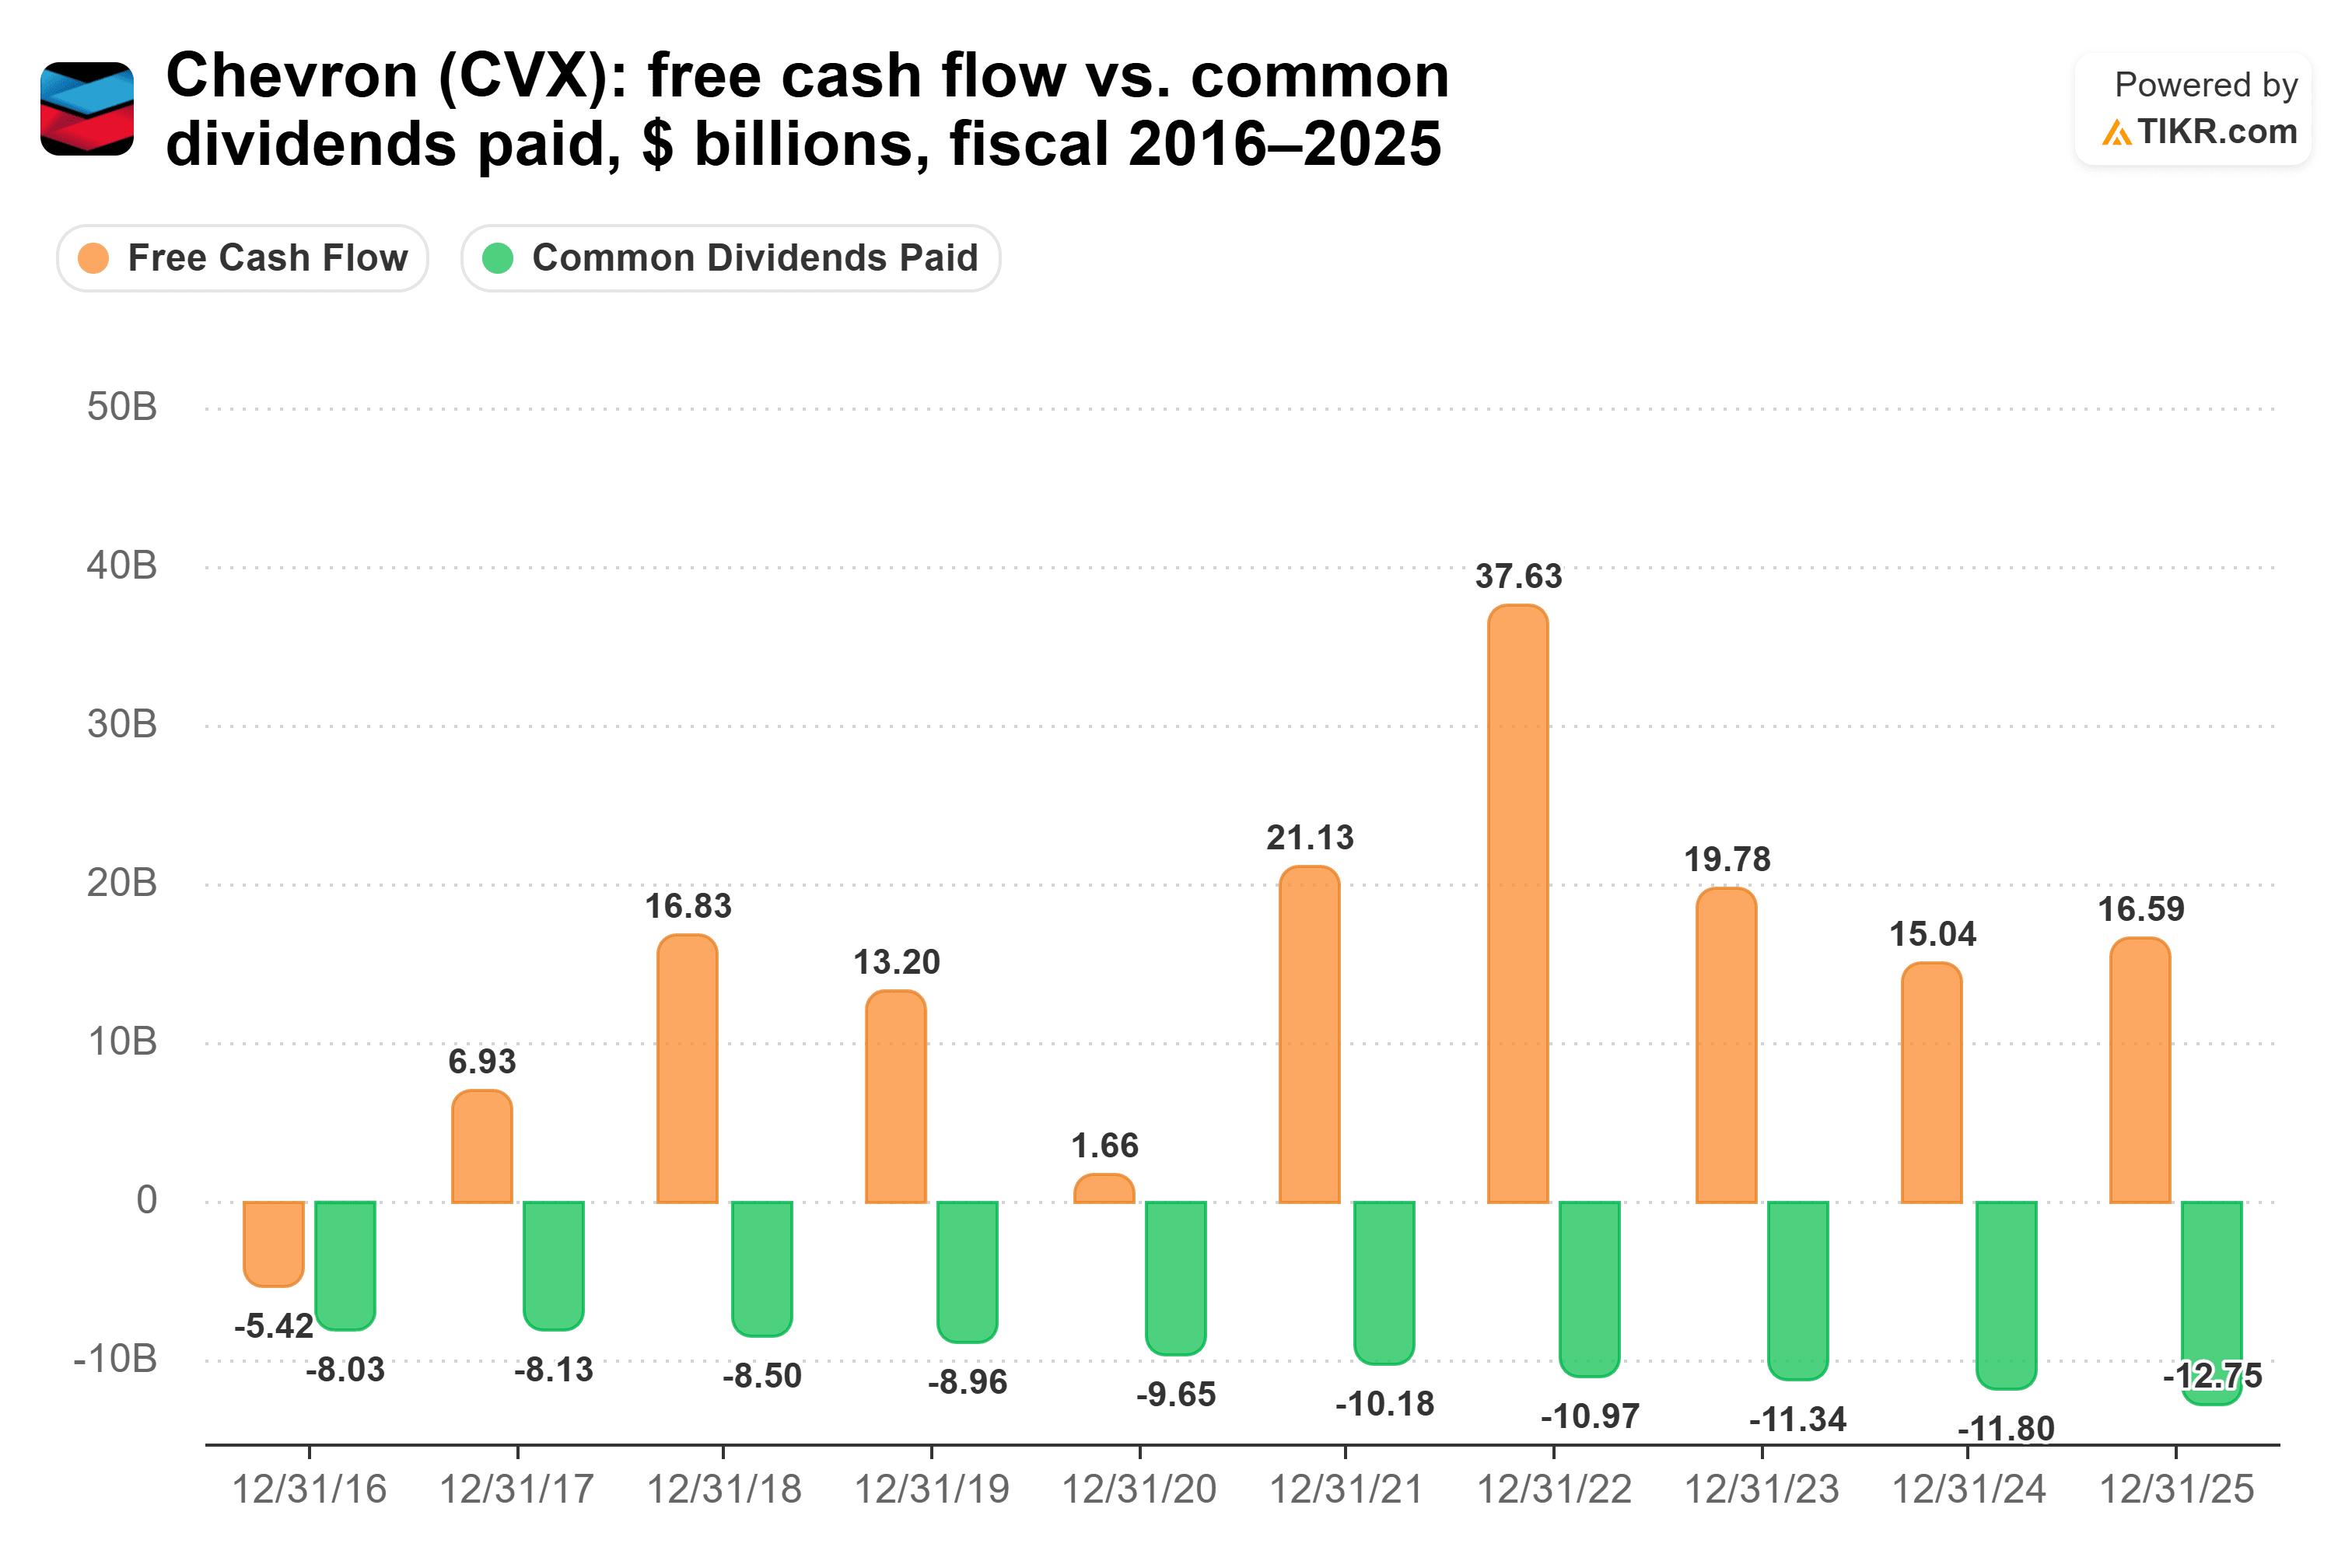
The dividend kept growing anyway. As management put it on its first-quarter call, “we’ve grown it for the 39th consecutive year.”
The main risk for Chevron is the price of oil. Management’s goal of growing adjusted free cash flow by more than 10% a year on average through 2030 assumes commodity prices stay flat at levels below today’s, and the Middle East conflict is already holding back some of its production.
So which dividend wins?
I’m holding Verizon for the next 10 years. At today’s yields and each company’s raise pace from fiscal 2020 to fiscal 2025, $10,000 in Verizon pays about $6,770 over the decade, against about $4,439 in Chevron. That’s about $2,331 more, and Chevron’s yearly check wouldn’t pass Verizon’s until around 2043.
Verizon’s 1.9% pace also looks easy to keep. It pays out 54% of its free cash flow, expects that cash flow to grow 9% to 10% in 2026, and hasn’t topped 77% in any of the last five fiscal years. Chevron’s 5.8% pace leans harder on oil prices, and if it slowed, Verizon’s lead would only grow.
This isn’t to say Chevron’s dividend is shaky. Thirty-nine straight years of raises and very little net debt make it a dividend I’d trust through a downturn. It’s just that, for a 10-year hold, I’d rather collect the bigger check from the business whose cash flow doesn’t ride on oil.
Of course, Verizon still has to pay down that debt while it grows its dividend. The fourth quarter, when management expects service revenue growth near 4%, is the first test.
So what is Verizon stock actually worth?
TIKR lets you forecast the future price of any stock in less than a minute. Just enter a few assumptions into TIKR’s valuation model and see what Verizon could be worth. Start from Wall Street consensus estimates, or adjust the inputs to reflect your own view of the business. It’s free to use.
Disclaimer:
Please note that the articles on TIKR are not intended to serve as investment or financial advice from TIKR or our content team, nor are they recommendations to buy or sell any stocks. We create our content based on TIKR Terminal’s investment data and analysts’ estimates. Our analysis might not include recent company news or important updates. TIKR has no position in any of the stocks mentioned. Thank you for reading, and happy investing!