Key Stats for Union Pacific Stock
- 52-Week Range: $211 to $280
- Current Price: $272
- Street Mean Target: $292
- Street High Target: $330
- Analyst Consensus: 13 Buy, 2 Outperform, 7 Hold, 1 Underperform, 1 No Opinion
- TIKR Model Target (Dec. 2030): $424
Union Pacific Stock Drops 4% on STB Pause, but the Standalone Railroad Just Delivered Record Results
Union Pacific (UNP), the largest freight railroad in North America by track miles, fell 4.2% on May 28 after the U.S. Surface Transportation Board froze review of its $85 billion merger with Norfolk Southern, citing an “unclear or underdeveloped” application.
The STB accepted the revised filing but placed all proceedings, including the environmental review, in abeyance while requesting supplemental information on competitive impacts, market share projections, and downstream merger effects, with responses due July 27.
The drop happened against a backdrop that makes it look like an overreaction.
Weeks earlier, on April 23, Union Pacific had reported first-quarter 2026 results that CEO Jim Vena called record-setting across the board, with adjusted net income up 7% and adjusted EPS of $2.93, a 9% increase year over year.
The quarter produced records in all six key performance and efficiency metrics: freight car velocity hit 235 miles per day, terminal dwell reached a best-ever 19.7 hours, and locomotive productivity improved 6% with a smaller active fleet.
Vena was unambiguous about the merger delay on the Q1 2026 earnings call: “We are more convicted now than we ever have been when you take a look at what’s in the merger application and all the detail that we’re putting forward.”
The merger case, filed in revised form on April 30, projects around $3.5 billion in annual shipper savings, roughly 2.1 million fewer truckloads on U.S. roads per year, and approximately 1,200 net new union jobs by year three.
The STB pause extends the expected approval timeline to mid-2027, but RBC analyst Walter Spracklin, who covers Union Pacific stock, characterized the development as “neutral to sentiment” and said the delay was unlikely to affect the probability of the deal closing.
The companies said they are working with the STB on the information request and expect approval next year.
UNP Stock Consensus Is Bullish and the EPS Trajectory Is Why

Thirteen of 22 analysts covering Union Pacific stock carry a Buy rating, with two more at Outperform, seven at Hold, and one at Underperform, producing a mean price target near $292 against the current price of $272.
The near-term earnings setup explains the conviction.

Adjusted EPS came in at $2.93 for Q1 2026, beating the estimate of $2.86 by 2.45%, and management reaffirmed guidance for mid-single-digit reported EPS growth for the full year.
Beyond 2026, Union Pacific stock has a standing three-year target of high-single to low-double-digit EPS CAGR through 2027, a commitment management repeated at both the Wolfe Research transportation conference and the RBC Canadian Industrials conference in May.
The Street’s forward EPS estimates align with that cadence: consensus has normalized EPS at around $3 for Q2 2026, scaling to around $3 for Q3 and Q4 2026, then stepping up to around $3 per quarter in 2027.
Revenue growth is modest but steady, with consensus projecting Q2 2026 revenue at around $7 billion, a 6% increase year over year, after Q1’s 3.2% top-line growth was driven by a 4% gain in freight revenue on 1% lower volume.
The FCF trajectory is a secondary reason for analyst confidence: Q1 2026 free cash flow reached $1.50 billion, up 15.3% from the same quarter last year, with the consensus seeing FCF expanding toward around $2 billion per quarter by mid-2027.
CFO Jennifer Hamann said on the Q1 call that the railroad exited the quarter with an adjusted debt-to-EBITDA ratio of 2.5x, maintaining A-rated credit, and Union Pacific’s net debt declined $1.2 billion as long-term debt was repaid.
The one credible near-term risk is fuel: Q2 diesel costs were running around $4.20 per gallon versus the January estimate of $2.35, and Hamann acknowledged that elevated fuel prices will pressure operating ratio specifically in the second quarter.
But thirteen buy-rated analysts see that as a timing issue, not a thesis-breaker: the efficiency engine, record service metrics, and pricing discipline give Union Pacific stock a structural earnings story that the fuel headwind does not rewrite.
At $272 with a Street mean target near $292, UNP stock trades at a discount to where the consensus thinks the standalone business is worth, before any merger optionality is assigned.
UNP Runs the Widest EPS Lead Over CSX and Norfolk Southern Into 2027

Union Pacific stock’s normalized EPS of $2.93 in Q1 2026 ran more than seven times the $0.39 CSX Corporation (CSX) posted in the same quarter, and roughly 18% ahead of Norfolk Southern’s (NSC) $2.49.
The gap is not narrowing on the forward estimates: consensus has Union Pacific stock’s normalized EPS at approximately $3 for Q2 2026, while CSX is projected at around $0.49 and Norfolk Southern at around $3.
Through the end of 2026, UNP’s quarterly EPS cadence holds consistently above $3, while Norfolk Southern tops out near $3 in Q4 2026 and CSX remains below $1 per quarter across every period on the chart.
By Q1 2027, the estimates show Union Pacific stock at around $3, Norfolk Southern at approximately $3, and CSX at around $0.48, a structure that has held without meaningful compression across five consecutive quarters of actuals.
The structural source of that lead is the operating ratio gap CEO Vena cited at the May Wolfe Research conference: Union Pacific’s adjusted OR came in at 59.9% in Q1 2026, more than 400 basis points better than its nearest competitor.
That margin advantage compounds directly into per-share earnings, and it is why the Street’s buy-to-hold ratio tilts more favorably toward Union Pacific stock than toward either peer despite the merger uncertainty weighing on the near-term multiple.
Is Union Pacific Stock Undervalued in 2026? TIKR’s $424 Model Says Yes
TIKR’s base case values Union Pacific stock at approximately $424 by December 2030, implying around 56% total return from the current price of $272, or roughly 10% annualized over approximately 4.6 years.
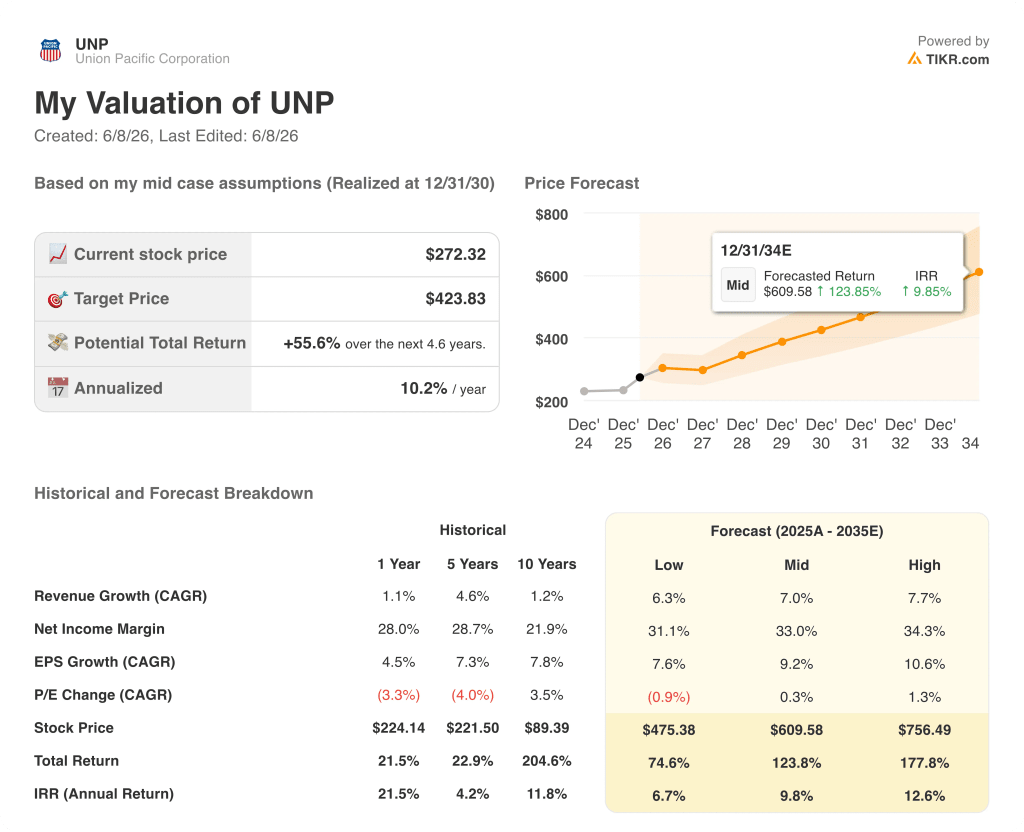
If Union Pacific holds its mid-case trajectory, with revenue CAGR near 7%, net income margins expanding toward 33%, and EPS CAGR around 9%, the model produces a stock price near $610 by December 2034, representing a total return of approximately 124% and an IRR near 10%.
If the cycle softens and only the low-case assumptions are realized, revenue growing around 6%, margins holding near 31%, and EPS compounding around 8% annually, the TIKR model still produces a stock price near $475 by December 2034 and a total return around 75%, implying roughly 7% annualized.
If both the operational improvements and the merger optionality are realized, the high-case assumptions (revenue CAGR near 8%, margins approaching 34%, EPS CAGR near 11%) push the model’s December 2034 output to approximately $756 per share, a total return near 178% and an IRR around 13%.
All three scenarios land above the current price. The verdict is that Union Pacific stock is undervalued, and the gap is wider than the $20 spread between the current price and the Street’s mean target makes it appear.
Is Union Pacific stock a buy right now?
The consensus is bullish: 13 of 22 analysts rate UNP a Buy or Outperform, with a mean price target near $292 against the current price of $272.
The standalone earnings case remains intact, with Q1 2026 adjusted EPS of $2.93 beating estimates by roughly 2% and management reaffirming high-single to low-double-digit EPS CAGR through 2027.
The key variable to watch is the STB’s response to the supplemental information due July 27.
What is the price target for UNP stock?
The Street’s mean target is approximately $292 and the high target is $330, based on 22 analyst estimates as of June 5, 2026. Individual targets range from recent upgrades by Susquehanna (raised to $305) and Jefferies ($325) to more conservative holds.
TIKR’s base-case model puts the mid-2030 target at approximately $424, assuming around 7% revenue CAGR and EPS compounding near 9% annually.
Should You Invest in Union Pacific Corporation?
The only way to really know is to look at the numbers yourself. TIKR gives you free access to the same institutional-quality financial data that professional analysts use to answer exactly that question.
Pull up Union Pacific Corporation stock and you’ll see years of historical financials, what Wall Street analysts expect for revenue and earnings in the quarters ahead, how valuation multiples have moved over time, and whether price targets are trending up or down.
You can build a free watchlist to track Union Pacific Corporation alongside every other stock on your radar. No credit card required. Just the data you need to decide for yourself.
Access Professional Tools to Analyze UNP stock on TIKR for Free →