Key Fundamental Metrics for O Stock
- 52-Week Range: $55.52 to $67.94
- Current Stock Price: $62.02
- Consensus Street Target: $68.45
- LTM Gross Profit Margin: 92.6%
- LTM Operating Margin: 44.60%
- LTM Net Debt / EBITDA Leverage: 5.68x
Value your favorite stocks like Realty Income with 5 years of analysts’ forecasts using TIKR’s new Valuation Model (It’s free) >>>
Scaling the Triple-Net Lease Rent Engine Safely Through Volatility
Realty Income Corporation (O) has carved out a highly defensive market positioning, delivering a stable 12.4% price return over the past year to trade at $62.02.
General real estate market observers frequently fret over shifting e-commerce landscapes, interest rate fluctuations, and commercial property valuations. However, this short-term anxiety overlooks the underlying operational insulation provided by Realty Income’s massive net-lease infrastructure.

The historical trajectory of their property acquisition engine illustrates the power of uncompromised operational scale. Total revenues surged sequentially upward from $2.08 billion in 2021 to an impressive $5.76 billion by the end of 2025.
Over this same multi-year timeline, absolute operating margins recovered from a cyclical 2022 trough of 39.02% to settle at a stellar 44.60% in late 2025. Because their underlying retail contracts enforce a triple-net mandate, individual tenants cover property upkeep, insurance, and taxes, keeping corporate profit margins secure.
See why Realty Income could be undervalued today with TIKR (It’s free) >>>
Balance Sheet Discipline: Systematically Defusing Capital Cost Constraints
Evaluating an equity real estate trust requires moving beyond top-line revenue metrics to analyze how debt structures are managed across economic expansions.
Because real estate operations depend heavily on the continuous issuance of unsecured credit to fund pipeline developments, maintaining absolute balance sheet health is paramount. For long-term allocators, tracking leverage ratios isolates true operational safety.

The historical trend in corporate solvency proves that management has acted with structural prudence. Rather than over-leveraging the equity base to chase lower-quality asset volumes, Realty Income systematically reduced its net debt to EBITDA multiple from a pandemic peak of 8.51x down to a highly disciplined 5.68x by the close of 2025.
Deleveraging the cash engine ensures the company retains its high-quality investment-grade rating. This protective shield allows management to comfortably manage its $29.90 billion net debt layer without crimping capital returns.
Find high-quality dividend stocks that look even better than Realty Income today. (It’s free) >>>
Deciphering the Valuation Multiples of the Monthly Dividend Flywheel
As the preeminent global landlord for non-discretionary retail portfolios, Realty Income commands a distinct corporate premium, trading at a trailing Price-to-Earnings multiple of 50.82x and a highly liquid NTM Price-to-Earnings ratio of 39.29x.
While these absolute multiples often appear extended on traditional industrial screens, they reflect an ultra-premium business architecture backed by an elite 92.6% gross profit margin and a dependable 5.3% current dividend yield.
This cash machine is sustained by cross-geographical portfolio diversification across critical retail operations like grocery stores, convenience logistics, and consumer necessity hubs. By securing stable rent streams from essential businesses through long-term leases, the underlying entity operates more like an indexed fixed-income annuity than a volatile property stock.
As incremental rental increases continue to lock in across their vast real estate ecosystem, cash flow flows efficiently to fund the company’s trademark monthly dividend distributions.
Unlocking Value: What the TIKR Forecast Breakdown Implies
Shifting focus to long-term performance expectations, the forward valuation architecture isolates a remarkably tight distribution of performance probabilities for income-focused equity investors. Reviewing the historical 5-year total return drop of negative 9.1% shows how significantly near-term cost-of-capital friction can cloud long-term underlying performance.
Under the mid-case forecasting parameters, organic top-line revenue growth is modeled to settle at a normalized compound annual rate of 4.2% over the next decade, with net income margins steadying at 24.1%.
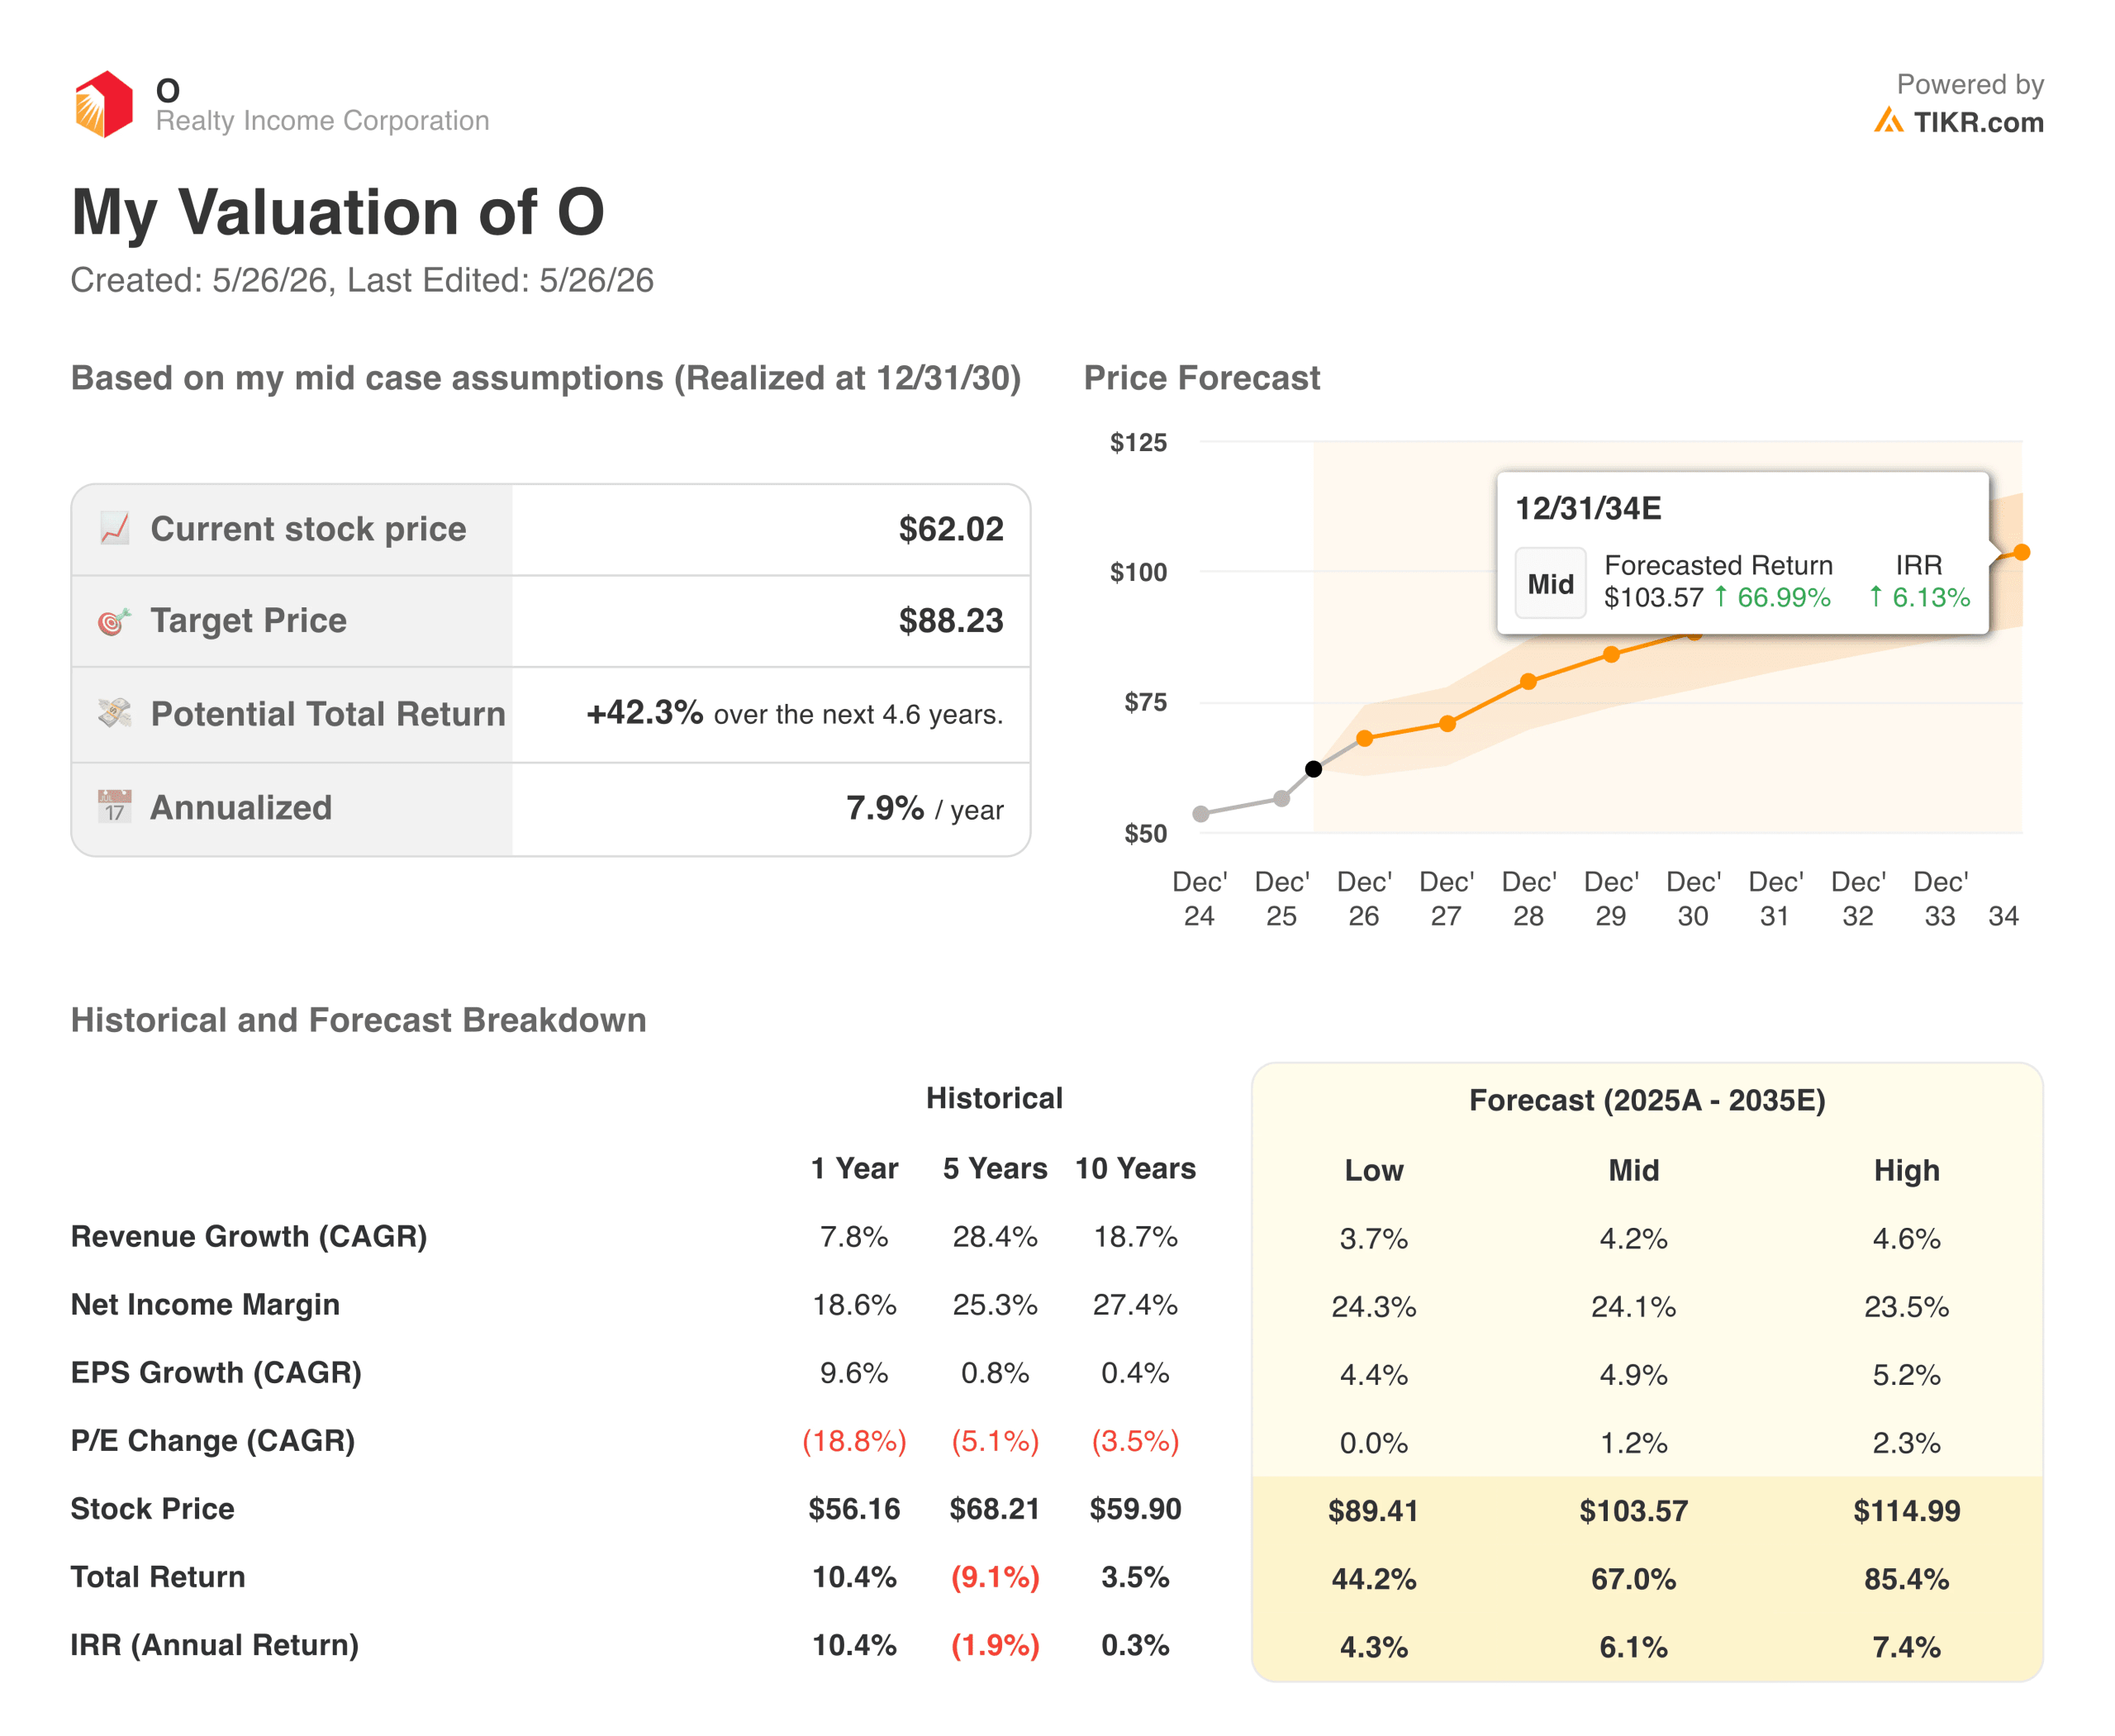
These baseline parameters translate into highly visible forward asset targets. The model indicates that even if top-line revenue growth drops to a conservative low-case footprint of 3.7%, the underlying real estate cash generation establishes a reliable $89.41 stock price floor by 2034.
By insulating operational results from standard commercial vacancies, the forecast framework maps out a mid-case terminal stock price target of $103.57 by late 2034, representing an overall 67.0% cumulative total return.
Is O Worth Buying at Today’s Levels?
At the current price of $62.02, the TIKR forward valuation model establishes a highly defensive, income-centric entry point for long-term equity allocators.
Under the mid-case scenario, achieving a fair value target price of $88.23 by December 2030 yields a predictable 7.9% annualized internal rate of return over the next 4.6 years, progressing toward a long-term 10-year annualized return of 6.1% by late 2034. This trajectory is secured by a steady 4.9% compound annual growth rate for EPS.
Importantly, the conservative low-case adjustments show immense fundamental protection, projecting an annualized return of 4.3% even if multiple expansion remains entirely muted over the forward horizon. This narrow return variance highlights a massive cash-backed margin of safety, requiring zero speculative growth to sustain investor returns.
For disciplined, risk-averse allocators looking to lock in an elite commercial property footprint backed by a resilient 5.3% dividend yield, initiating a core position at today’s price is an outstanding defensive move.
See Realty Income’s full growth forecast and analyst estimates. (It’s free) >>>
Looking for New Opportunities?
- See what stocks billionaire investors are buying so you can follow the smart money.
- Analyze stocks in as little as 5 minutes with TIKR’s all-in-one, easy-to-use platform.
- The more rocks you overturn… the more opportunities you’ll uncover. Search 100K+ global stocks, global top investor holdings, and more with TIKR.
Disclaimer:
Please note that the articles on TIKR are not intended to serve as investment or financial advice from TIKR or our content team, nor are they recommendations to buy or sell any stocks. We create our content based on TIKR Terminal’s investment data and analysts’ estimates. Our analysis might not include recent company news or important updates. TIKR has no position in any stocks mentioned. Thank you for reading, and happy investing!