Key Stats for Texas Instruments Stock
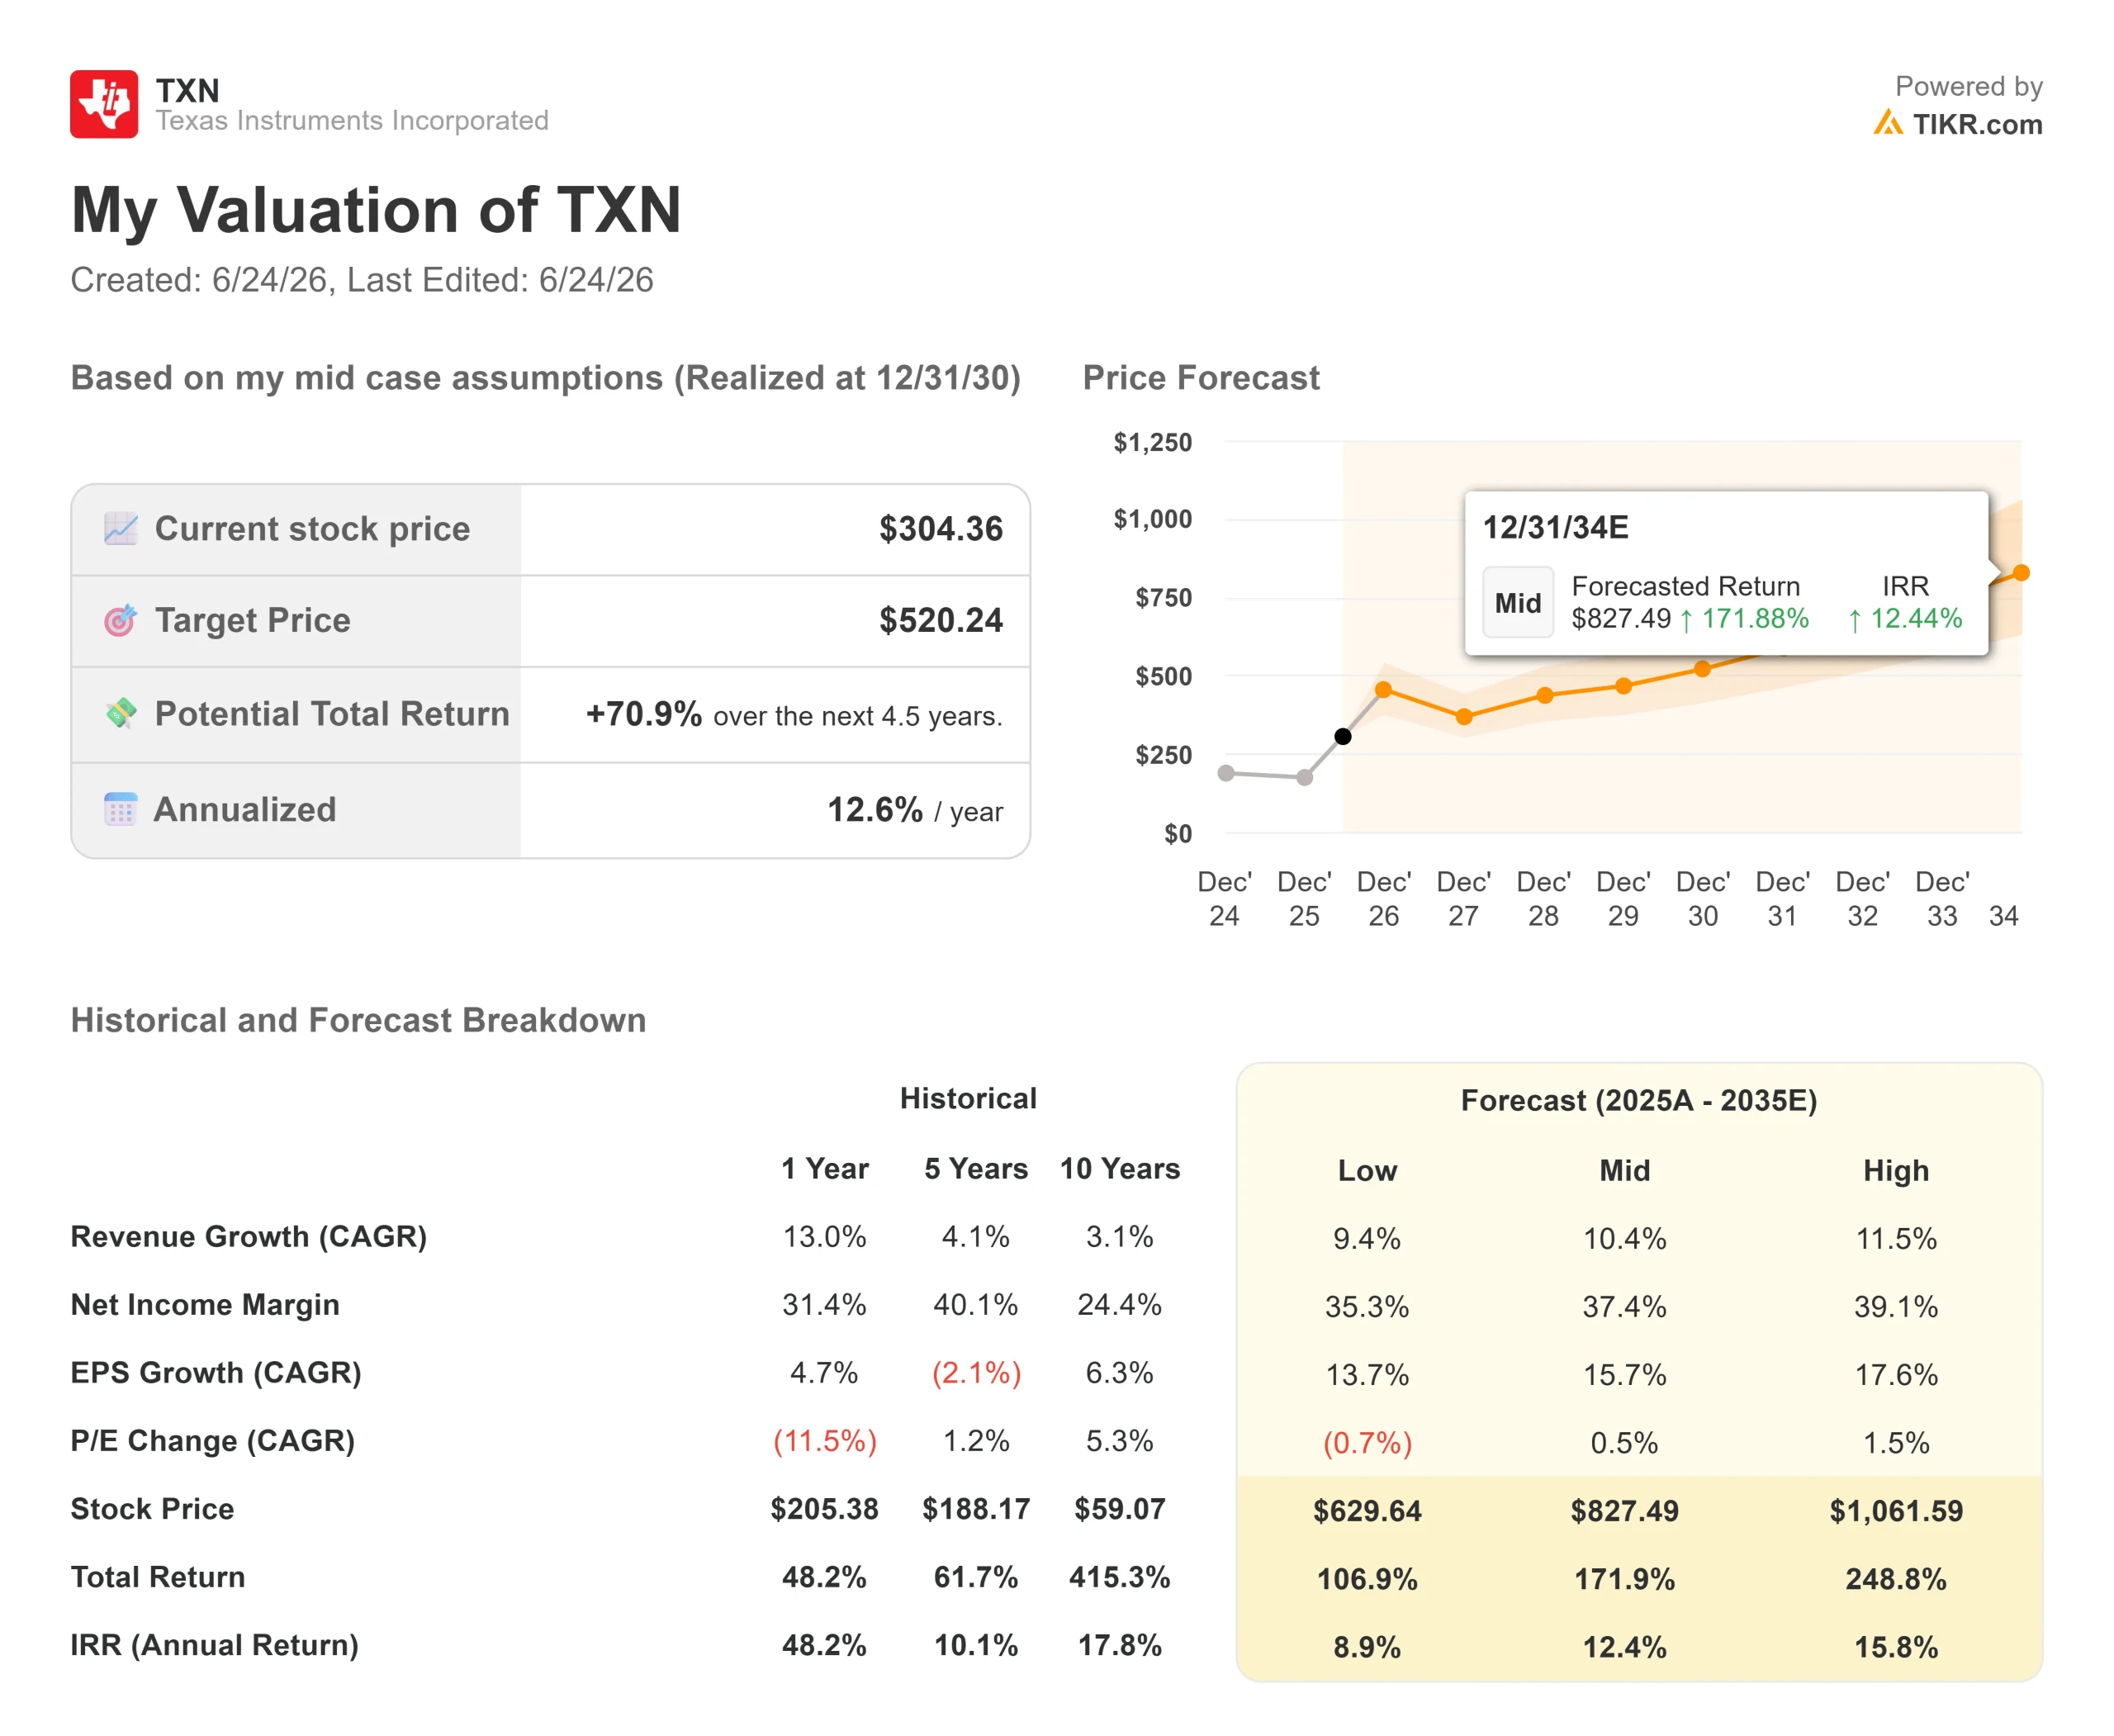
- Current Price: $304.36
- Target Price (Mid): ~$520
- Street Target: ~$294
- Potential Total Return: ~71%
- Annualized IRR: ~13% / year
- Earnings Reaction: +19.43% (April 22, 2026)
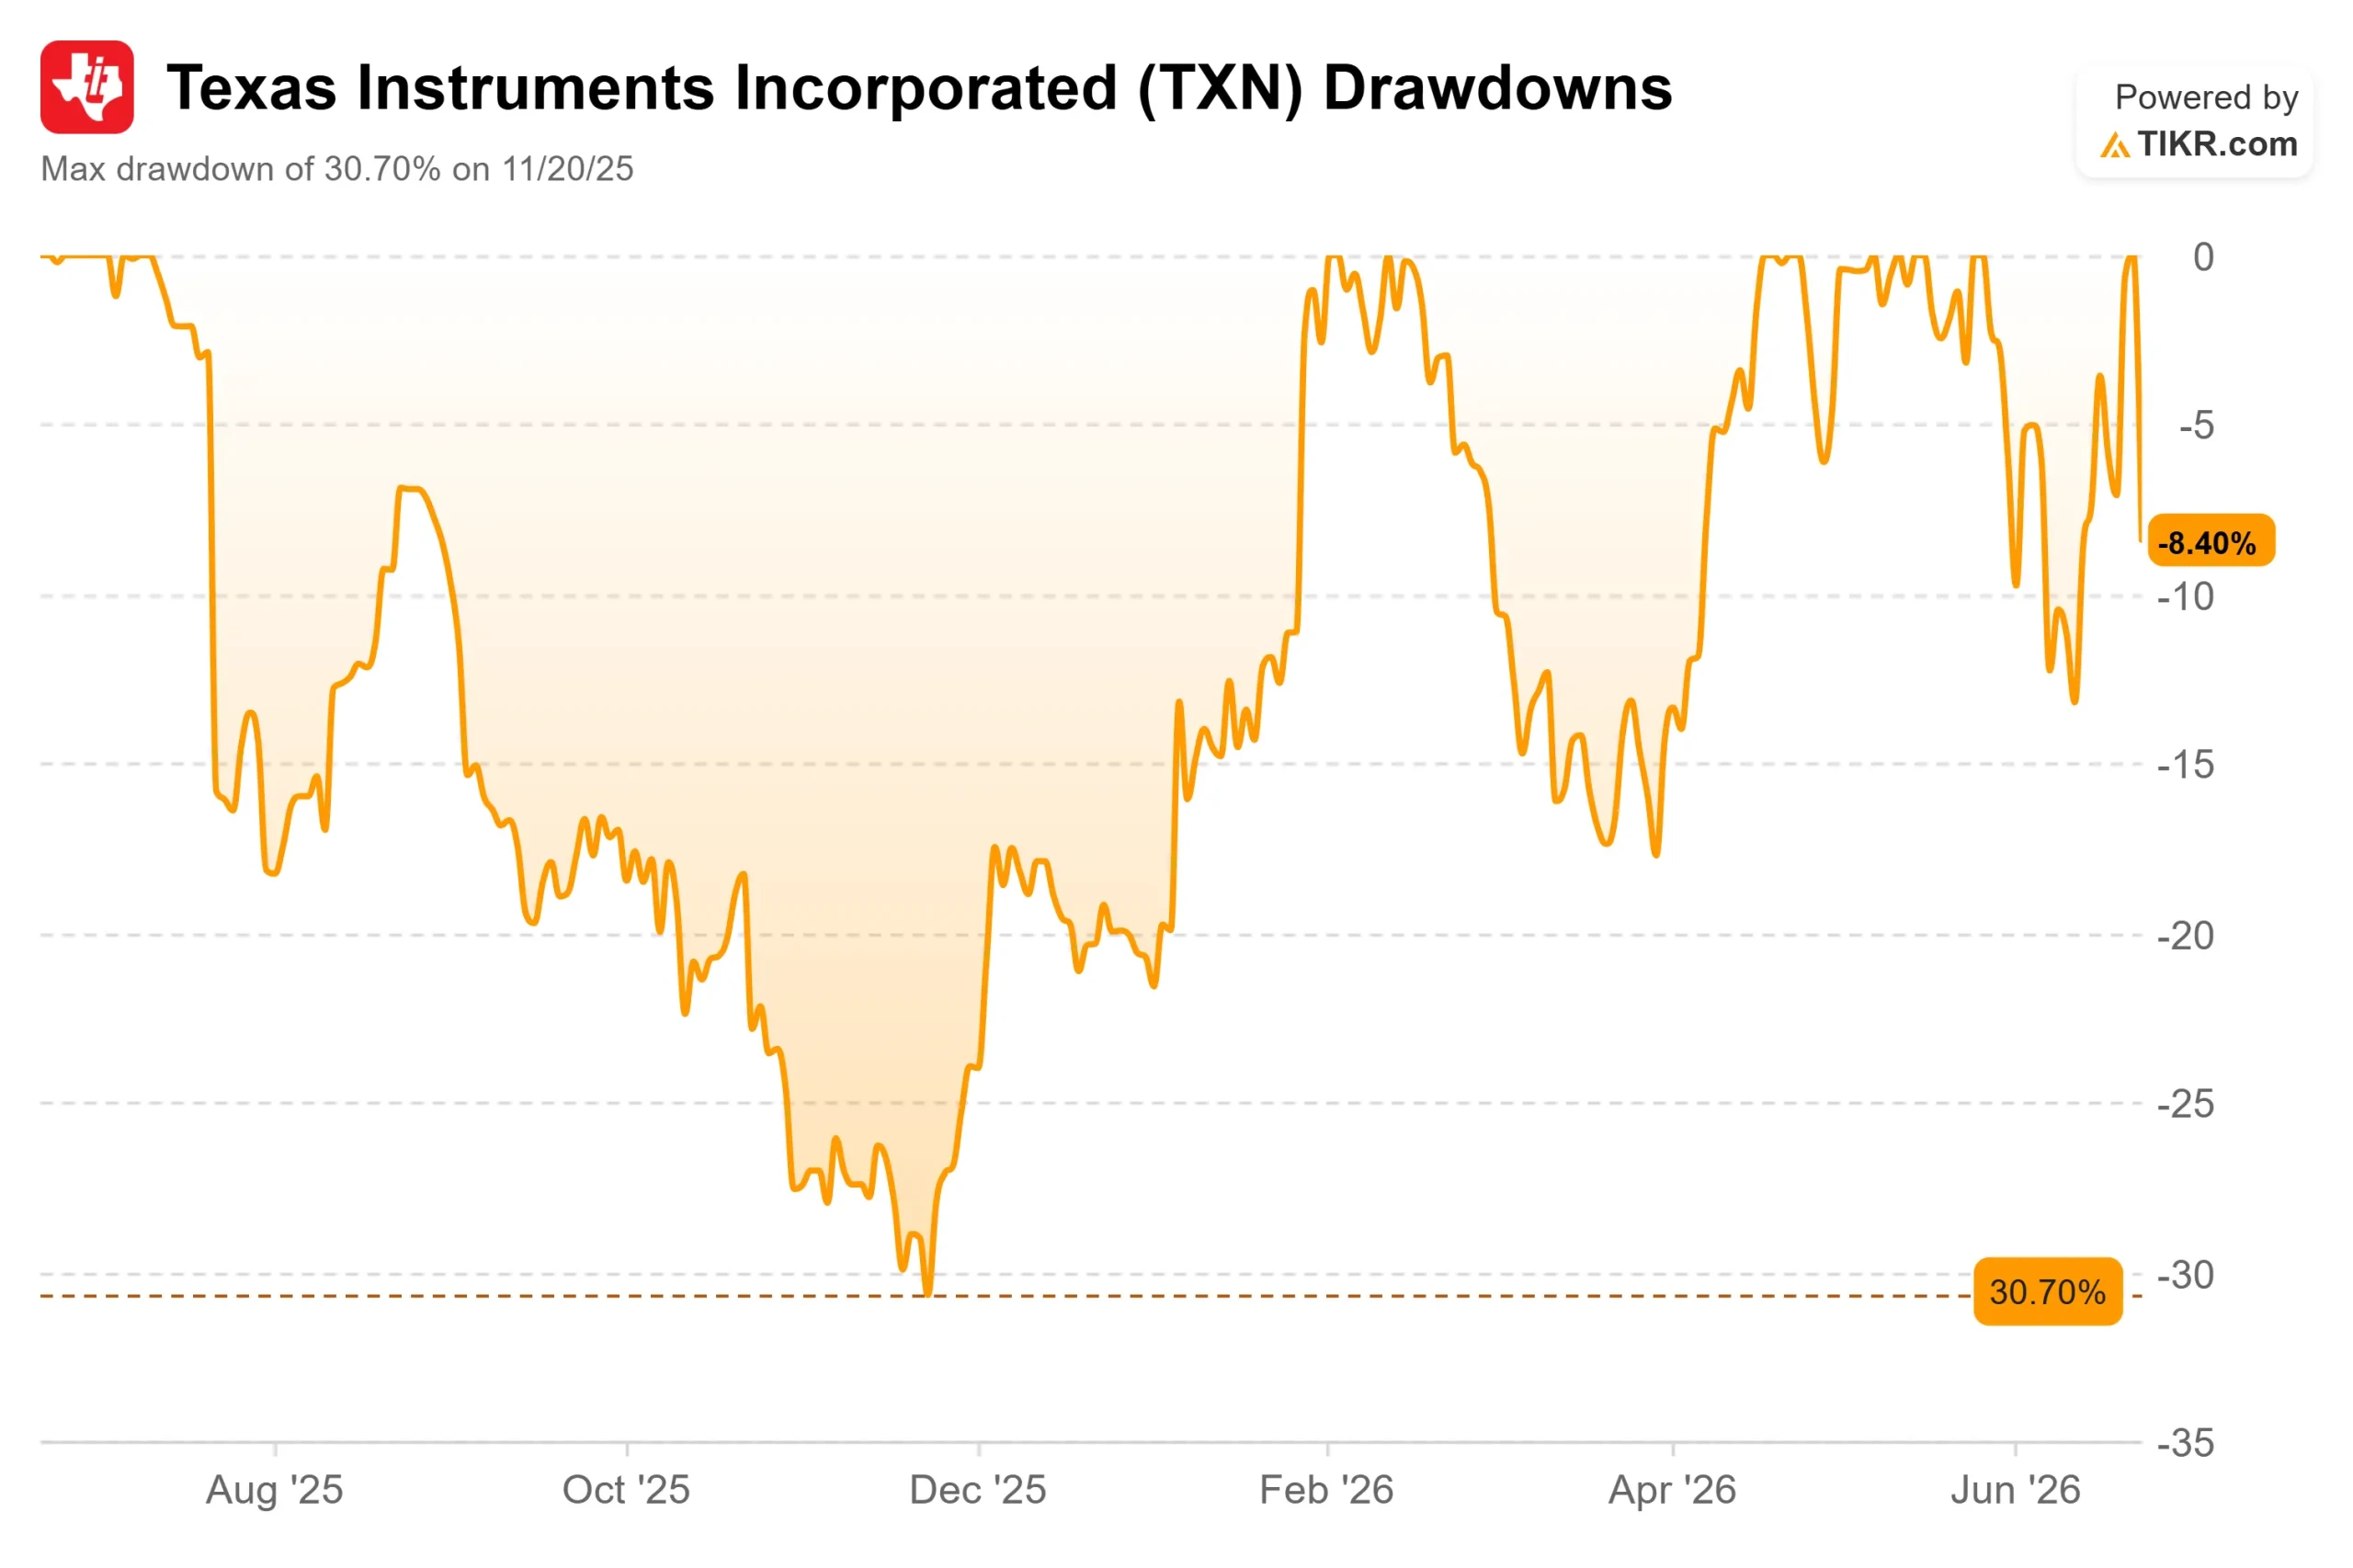
- Max Drawdown: 30.70% (November 20, 2025)
Now Live: Discover how much upside your favorite stocks could have using TIKR’s new Valuation Model (It’s free) >>>
What Happened?
Texas Instruments (TXN) spent 2026 as the comeback story the chip world stopped expecting, and then the tape turned on it in a single morning. After a rally of roughly 80% on the year, the stock fell 8.40% on June 23 to close at $304.36. Nothing broke at the company. The selloff came from outside the building.
That gap between a strong quarter and a brutal session is the story. Bulls see an analog franchise finally harvesting a six-year factory bet, with data center demand inflecting and industrial turning up. Bears see a stock that, even after the drop, trades above the average analyst target. The market cannot yet answer the only question that matters: was June 23 a warning, or a window?
What actually happened
The drop had little to do with Texas Instruments and everything to do with memory. A global chip selloff started overnight in Asia, where Korean memory makers each fell around 12% and triggered circuit breakers. The wave rolled into Wall Street and dragged the complex lower. Texas Instruments, a power and signal-chain supplier with no memory exposure, got swept along because it had run so far, so fast. Three sessions earlier, it had jumped nearly 7% on the same group momentum. The move up and the move down both came from the sector, not the fundamentals.
See historical and forward estimates for Texas Instruments stock (It’s free!) >>>
Why the run happened
The rally had a real engine. On April 22, Texas Instruments reported first-quarter results that beat on earnings and topped revenue estimates, and the stock jumped 19.43% on the print. The standout was the data center. CEO Haviv Ilan sized it directly at the Bernstein Strategic Decisions Conference on May 28: “I called the TAM at about 65% growth. So far, 1 quarter, we grew 90% year-over-year.” That share-gain claim is what re-rated the stock from cyclical laggard to AI-adjacent winner.
The capacity bet behind the margins
What separates this Texas Instruments from past cycles is the factory footprint. The company is finishing a six-year, $20 billion-plus program building 300-millimeter wafer fabs (its most modern, automated plants) in Texas and Utah. Ilan framed the payoff plainly: “free cash flow should grow as CapEx goes down and demand goes up.”
The margin lever is internalization, meaning pulling production in-house instead of buying it from outside foundries. Each internal wafer lifts gross margin, which sat at 57.3% over the last twelve months. That is the engine analysts are underwriting.
The premium is the crux of the debate. TXN trades near 25 times NTM EV/EBITDA (next-twelve-months enterprise value to core earnings), above a peer median of around 27 times and well above Broadcom, which trades near 19 times. That premium is defensible only if both data center and industrial hold. If either slips, a stock above the Street’s target has the most room to fall, which is what June 23 previewed. Adding to the caution, SEC filings show executives sold stock over the past quarter, including the retiring CFO, ahead of August’s leadership change to incoming CFO Julie Knecht.
See how Texas Instruments performs against its peers in TIKR (It’s free!) >>>
TIKR Advanced Model Analysis
- Current Price: $304.36
- Target Price (Mid): ~$520
- Potential Total Return: ~71%
- Annualized IRR: ~13% / year
See analysts’ growth forecasts and price targets for Texas Instruments stock (It’s free!) >>>
On the TIKR Valuation Model’s mid-case, realized at the end of 2030, the target is around $520, an implied total return near 71% over 4.5 years, or about 13% annualized. That sits above today’s price and well above the Street’s average target of around $294, where consensus already models the stock below where it trades.
Two revenue drivers anchor the case: the data center ramp, where TXN grew 90% year over year against a market growing around 65%, and the industrial recovery, which Ilan called early-stage and still 15% below its prior peak. The mid-case models’ revenue CAGR is near 10% per year. The margin driver is internalization into the Lehi and Sherman fabs, supporting a mid-case net income margin near 37%. The primary risk is depreciation, which rises as new fabs come online and pressures margins if growth stalls.
Upside: if the data center holds near 90% growth and industrial confirms its turn, the path to around $520 looks reachable.
Downside: if the data center surge proves to be pull-forward demand that fades as rivals add capacity, the premium unwinds toward the Street’s sub-$300 target.
Conclusion
The thesis gets settled on July 22, when Texas Instruments reports second-quarter results. Watch data center growth above all. Holding near last quarter’s 90% pace confirms the share-gain story. A slowdown toward the market’s 65% rate is the first crack, and after the year’s run, the stock has room to fall toward the Street’s average. Watch industrial too: a second straight quarter of broad sequential growth turns a hopeful recovery into a confirmed one. Good looks like both are holding. Bad looks like either slipping. The answer comes in late July.
See what stocks billionaire investors are buying so you can follow the smart money with TIKR.
Should You Invest in Texas Instruments?
The only way to really know is to look at the numbers yourself. TIKR gives you free access to the same institutional-quality financial data that professional analysts use to answer exactly that question.
Pull up Texas Instruments, and you’ll see years of historical financials, what Wall Street analysts expect for revenue and earnings in the quarters ahead, how valuation multiples have moved over time, and whether price targets are trending up or down.
You can build a free watchlist to track Texas Instruments alongside every other stock on your radar. No credit card required. Just the data you need to decide for yourself.
Analyze Texas Instruments on TIKR Free →
Looking for New Opportunities?
- See what stocks billionaire investors are buying so you can follow the smart money.
- Analyze stocks in as little as 5 minutes with TIKR’s all-in-one, easy-to-use platform.
- The more rocks you overturn… the more opportunities you’ll uncover. Search 100K+ global stocks, global top investor holdings, and more with TIKR.
Disclaimer:
Please note that the articles on TIKR are not intended to serve as investment or financial advice from TIKR or our content team, nor are they recommendations to buy or sell any stocks. We create our content based on TIKR Terminal’s investment data and analysts’ estimates. Our analysis might not include recent company news or important updates. TIKR has no position in any stocks mentioned. Thank you for reading, and happy investing!