Key Stats for TMUS Stock
- Past-Month Performance: 18%
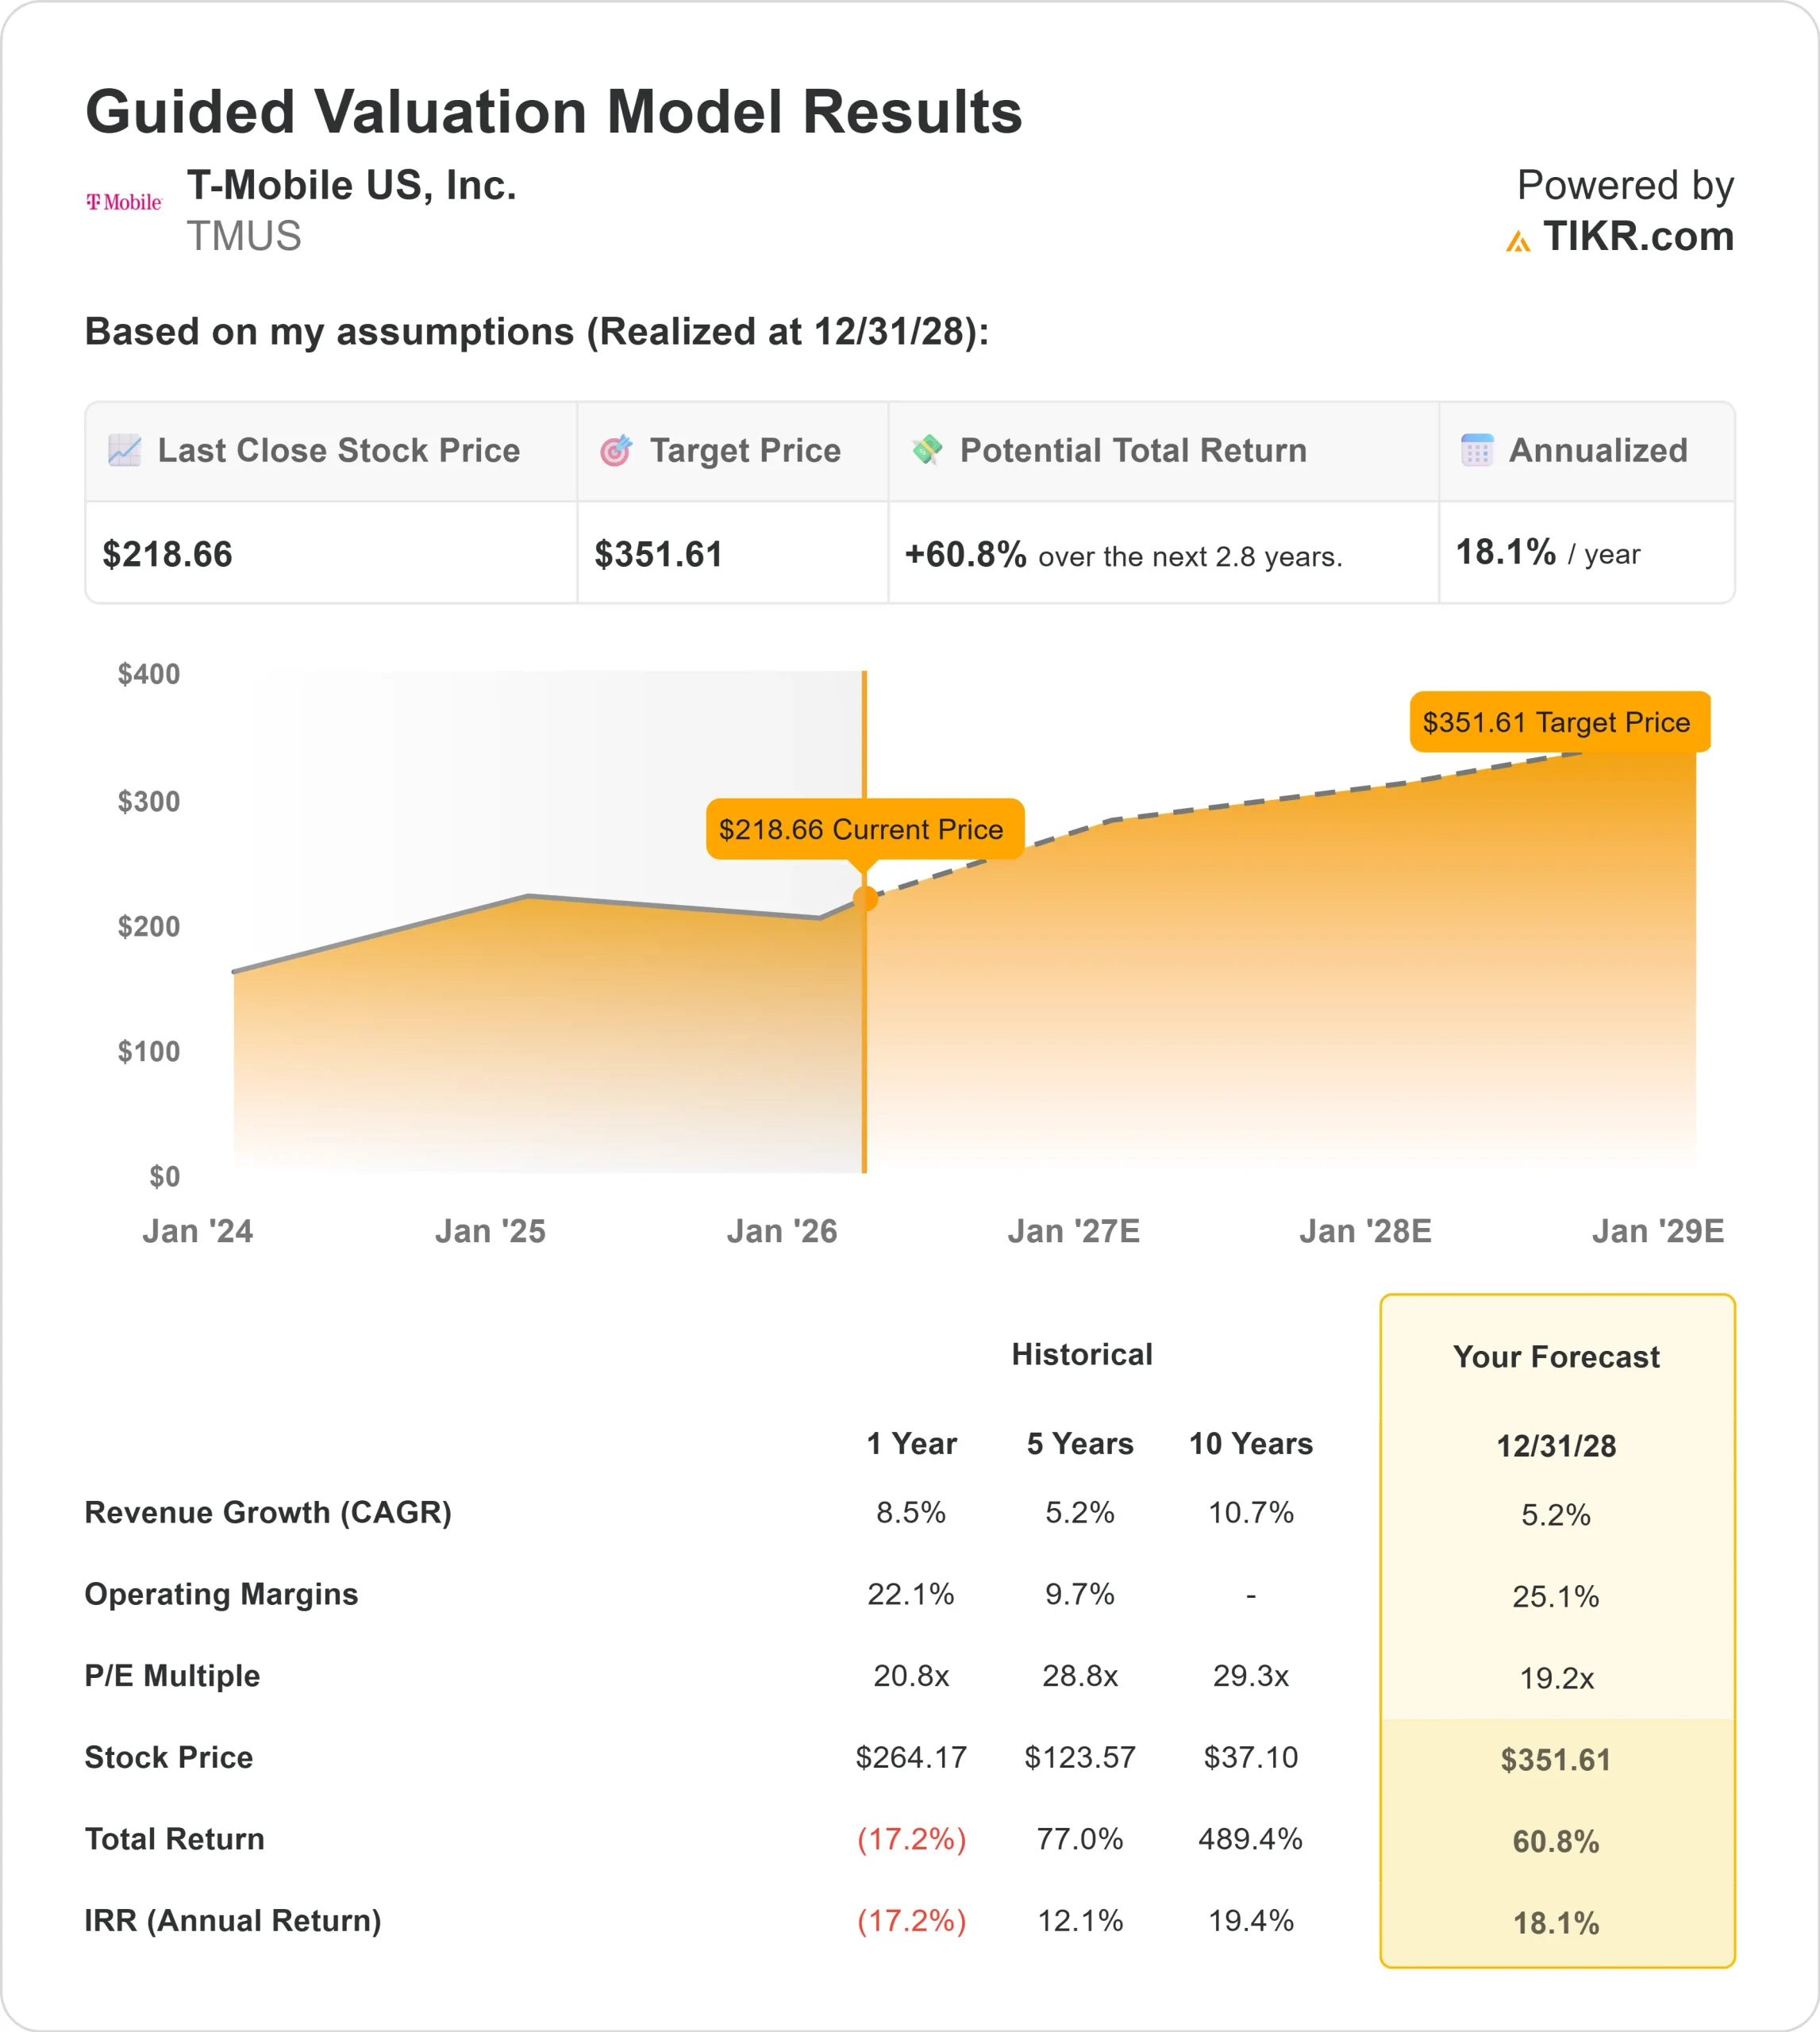
- 52-Week Range: $181 to $276
- Valuation Model Target Price: $352
- Implied Upside: 61%
Value your favorite stocks like T-Mobile US with 5 years of analysts’ forecasts using TIKR’s new Valuation Model (It’s free) >>>
What Happened?
T-Mobile US stock rose about 18% over the past month, recently trading near $219 per share, as investors responded to strong Q4 earnings, raised 2026 guidance, and accelerated capital returns.
The move reflects growing confidence in the company’s ability to compound earnings and cash flow into 2026.
The stock moved higher specifically because T-Mobile delivered industry-leading Q4 results and increased its forward outlook.
The company reported 261,000 postpaid net account additions and 2.7% postpaid ARPA growth, driving 10% reported service revenue growth and 7% adjusted EBITDA growth.
Free cash flow reached 25% of service revenue for the year, highlighting strong cash conversion. Management guided for approximately $77 billion in 2026 service revenue, up 8%, and 900,000 to 1 million postpaid net account additions, reinforcing expectations for sustained growth this year.
CEO Srini Gopalan said the company is performing “incredibly well.”
Institutional positioning and capital allocation updates reinforced the advance. NEOS Investment Management increased its stake by 61.9% to 391,092 shares worth about $93.62 million, while Vanguard raised its holdings 1.5% to 42,797,074 shares valued at approximately $10.24 billion.
Bowen Hanes & Co. increased its position by 21.3%, Empirical Wealth Management boosted its stake by 22.2%, and Cumberland Partners raised its holdings by 189%.
The company also accelerated Q1 share repurchases to up to $5 billion, and Deutsche Telekom stated it does not plan to sell shares in 2026, signaling long-term confidence.
Insider activity was mixed. CFO Peter Osvaldik sold 27,000 shares on February 18 at an average price of $214.86 for about $5.80 million.
Director Mark Wolfe Nelson sold a combined 16,514 shares across February 17 and 18 for about $3.64 million. While insider selling drew attention, the raised outlook, free cash flow strength, and aggressive capital returns appear to have driven the stock’s recent 18% gain.
See analysts’ growth forecasts and price targets for T-Mobile US (It’s free) >>>
Is TMUS Undervalued?
Under valuation assumptions, the stock is modeled using:
- Revenue Growth (CAGR): 5.2%
- Operating Margins: 25.1%
- Exit P/E Multiple: 19.2x
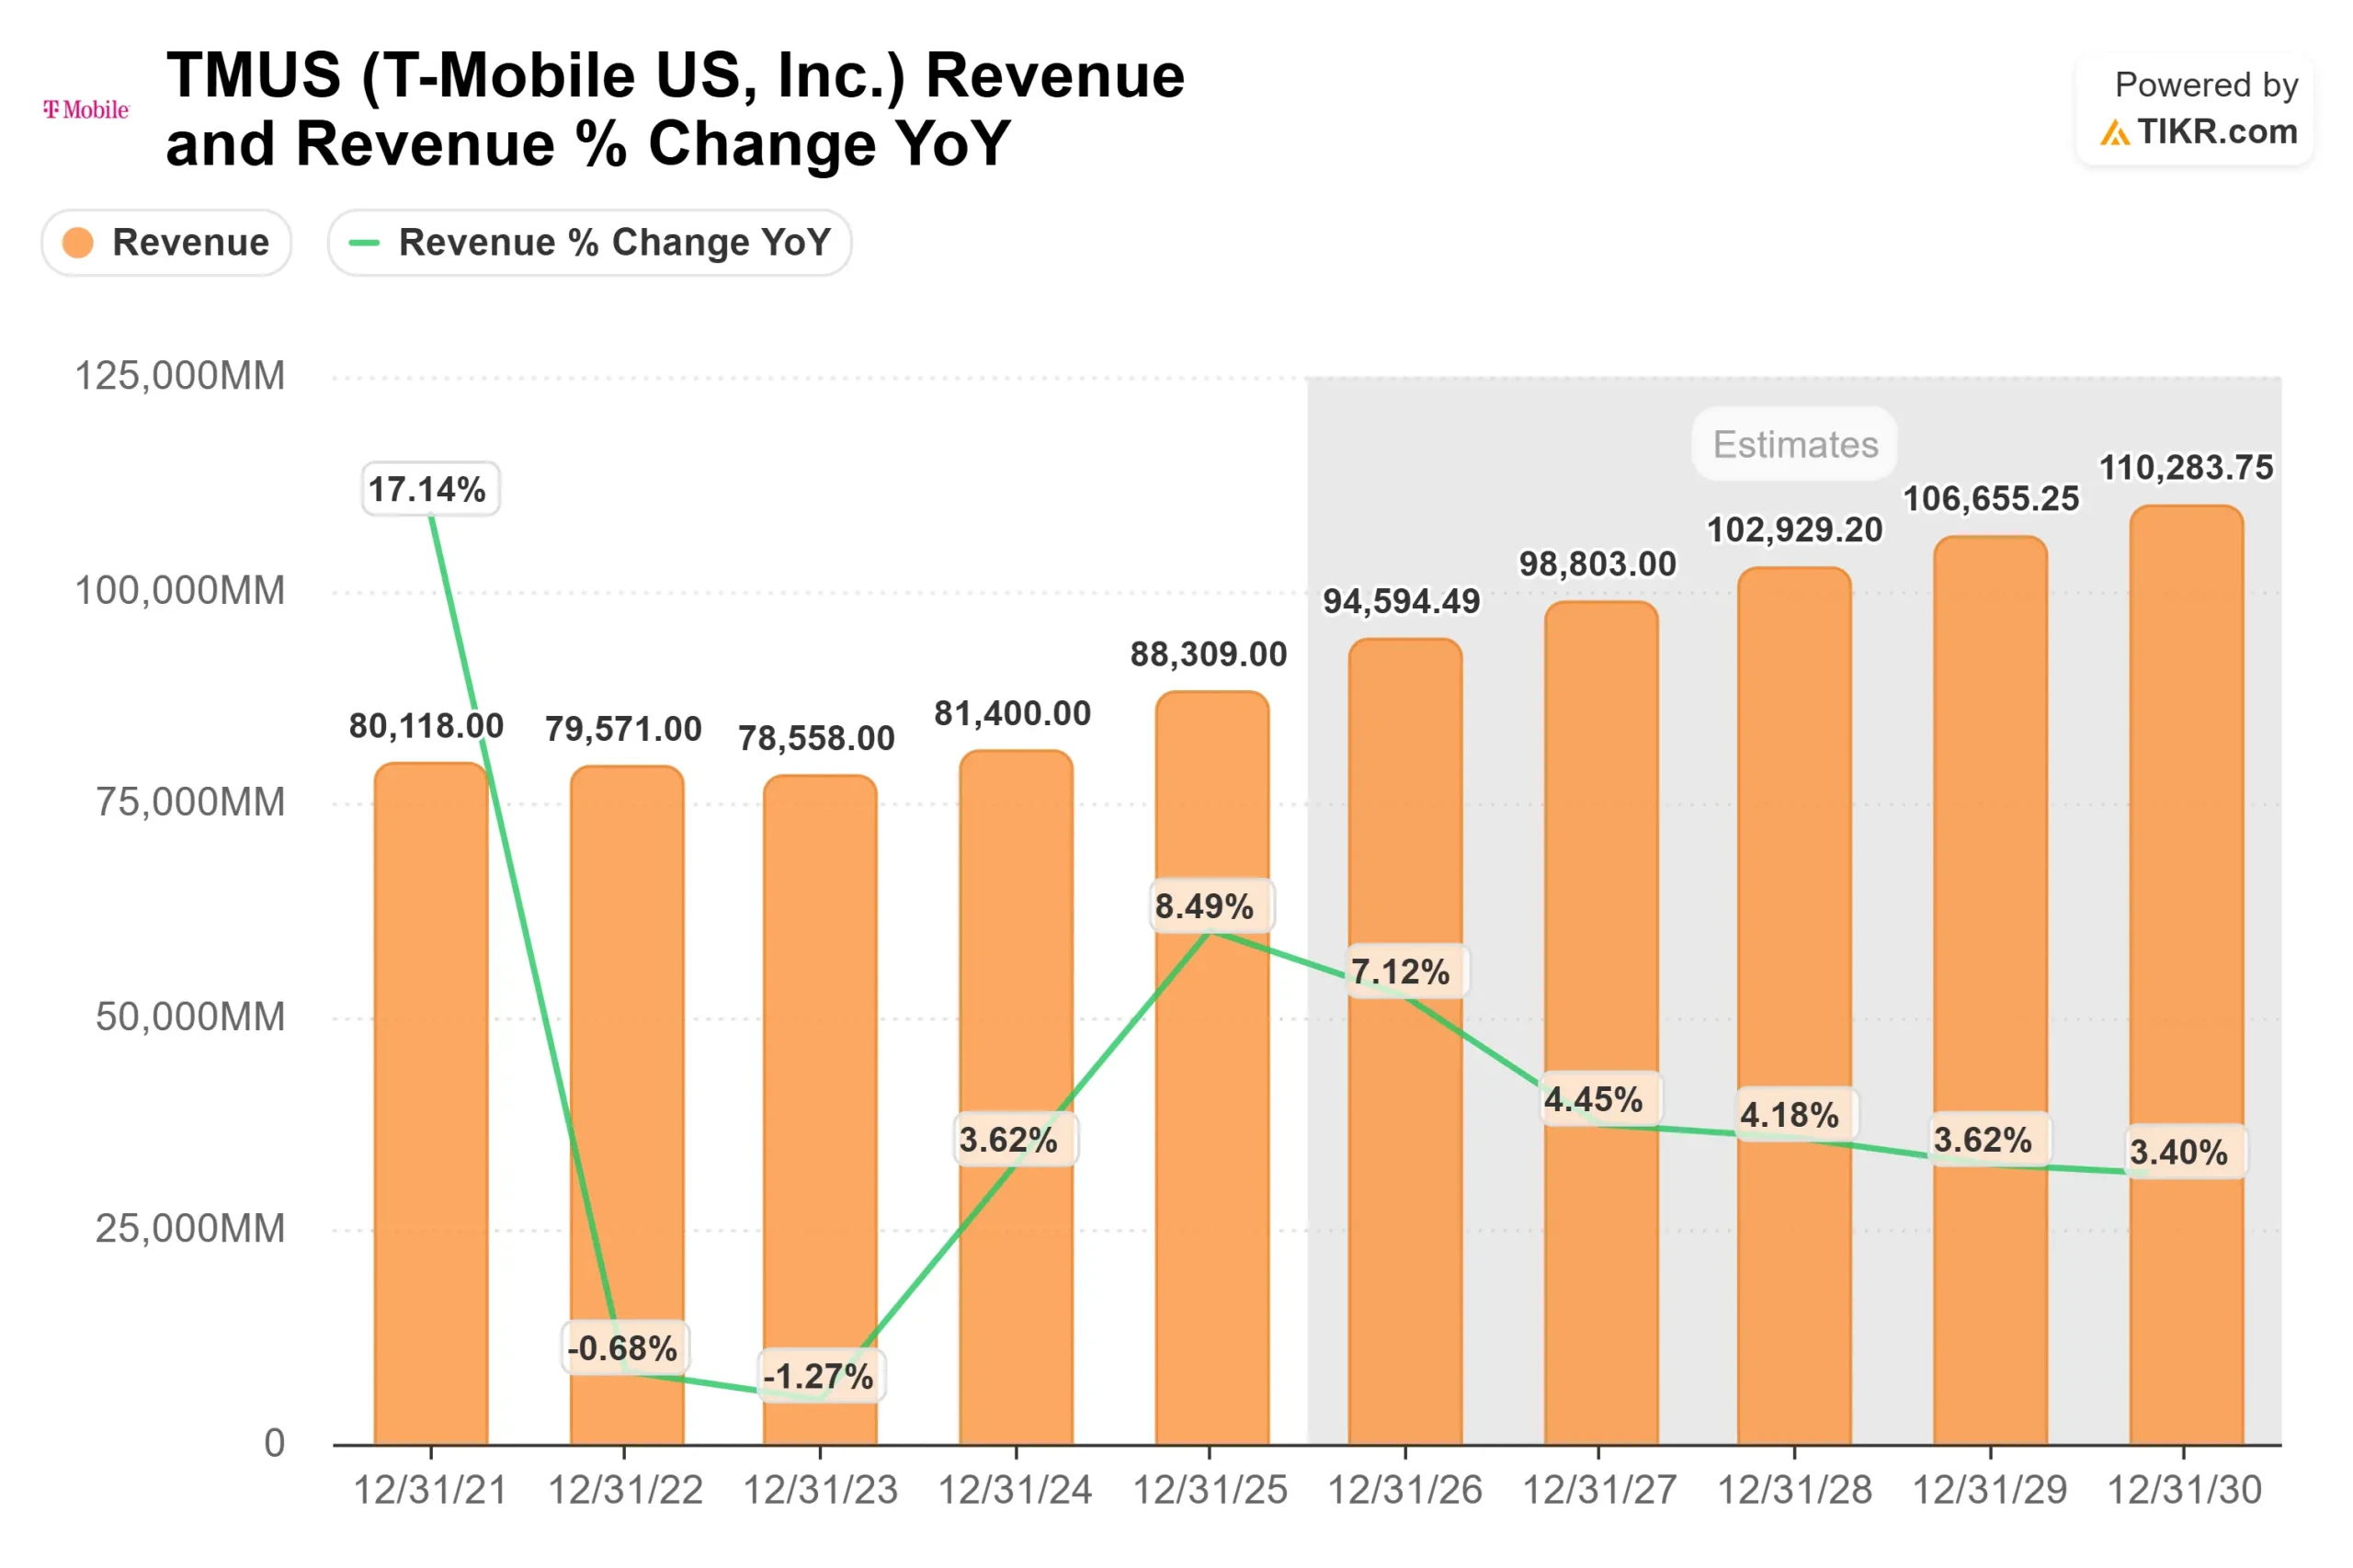
Revenue is projected to expand from about $95 billion in 2026 to roughly $110 billion by 2030, reflecting steady service revenue growth, premium plan adoption, and continued expansion in broadband and business wireless rather than aggressive industry-wide pricing.
Margin expansion toward 25% is central to the thesis. As integration costs moderate, digital initiatives scale, and more transactions shift to T-Life self-service, operating leverage improves.
Management expects meaningful AI-driven efficiency gains through 2027, supporting stronger EBITDA growth relative to revenue.
Free cash flow remains a key driver. With free cash flow already reaching 25% of service revenue, continued operating leverage and disciplined capital spending support rising cash generation. Accelerated buybacks amplify per-share earnings growth even if subscriber growth moderates.
Based on these inputs, the model estimates a target price of about $352, implying roughly 61% total upside from current levels near $219 over the next few years.
Performance in 2026 will be driven by postpaid net account additions, ARPA growth in the 2.5% to 3% range, broadband expansion, and disciplined capital returns. These factors directly influence earnings compounding rather than short-term promotional activity.
At current levels, T-Mobile appears undervalued, with upside tied primarily to earnings durability, margin expansion, and sustained free cash flow growth into 2026.
Estimate a company’s fair value instantly (Free with TIKR) >>>
Value Any Stock in Under 60 Seconds (It’s Free)
With TIKR’s new Valuation Model tool, you can estimate a stock’s potential share price in under a minute.
All it takes is three simple inputs:
- Revenue Growth
- Operating Margins
- Exit P/E Multiple
From there, TIKR calculates the potential share price and total returns under Bull, Base, and Bear scenarios so you can quickly see whether a stock looks undervalued or overvalued.
If you’re not sure what to enter, TIKR automatically fills in each input using analysts’ consensus estimates, giving you a quick, reliable starting point.
See a stock’s true value in under 60 seconds (Free with TIKR) >>>