

Key Stats for SEDG Stock
- Price Change for SEDG stock: +8.4%
- SEDG Share Price as of Feb. 20: $37.90
- 52-Week High: $48.60
- SEDG Stock Price Target: $33.84
Now Live: Discover how much upside your favorite stocks could have using TIKR’s new Valuation Model (It’s free)>>>
What Happened?
SolarEdge Technologies, Inc. (SEDG) shares gained about 8% in the sessions following its Q4 2025 earnings report, as investors reacted to a strong revenue beat and better‑than‑feared guidance for 2026.
The solar power electronics and energy solutions provider reported Q4 2025 revenue of roughly $335 million, up about 71% year over year and slightly ahead of Wall Street expectations near $328 million.
Despite the revenue surge, the company remained unprofitable, posting a GAAP net loss of about $405 million for 2025, but that was a significant improvement from the roughly $1.8 billion loss recorded in 2024.
Management highlighted four consecutive quarters of year‑over‑year revenue growth and five straight quarters of margin expansion, driven by better fixed‑cost absorption, production tax credits, and shifting more manufacturing to the U.S.
The company is rolling out its new SolarEdge Nexis platform, with high‑volume shipments expected in the second half of 2026 and a largely completed transition by early 2027, and it reiterated a target to reach EBIT profitability later in 2026 if trends hold.
SolarEdge ended 2025 with about $493 million in cash and short‑term investments and net cash of roughly $106 million, giving it balance‑sheet flexibility despite ongoing operating losses.
However, the business remains under pressure from cyclical solar demand, pricing competition, and a multi‑year revenue decline from its 2022 peak, with the last 3‑year revenue CAGR still negative despite the recent rebound.
See analysts’ growth forecasts and price targets for SEDG stock (It’s free!) >>>
What the Market Is Telling Us About SEDG Stock
Even after the post‑earnings bounce, SEDG trades at $37.90, below its 52‑week high of $48.60 but well above the 52‑week low of $11.00 as investors reassess the turnaround.
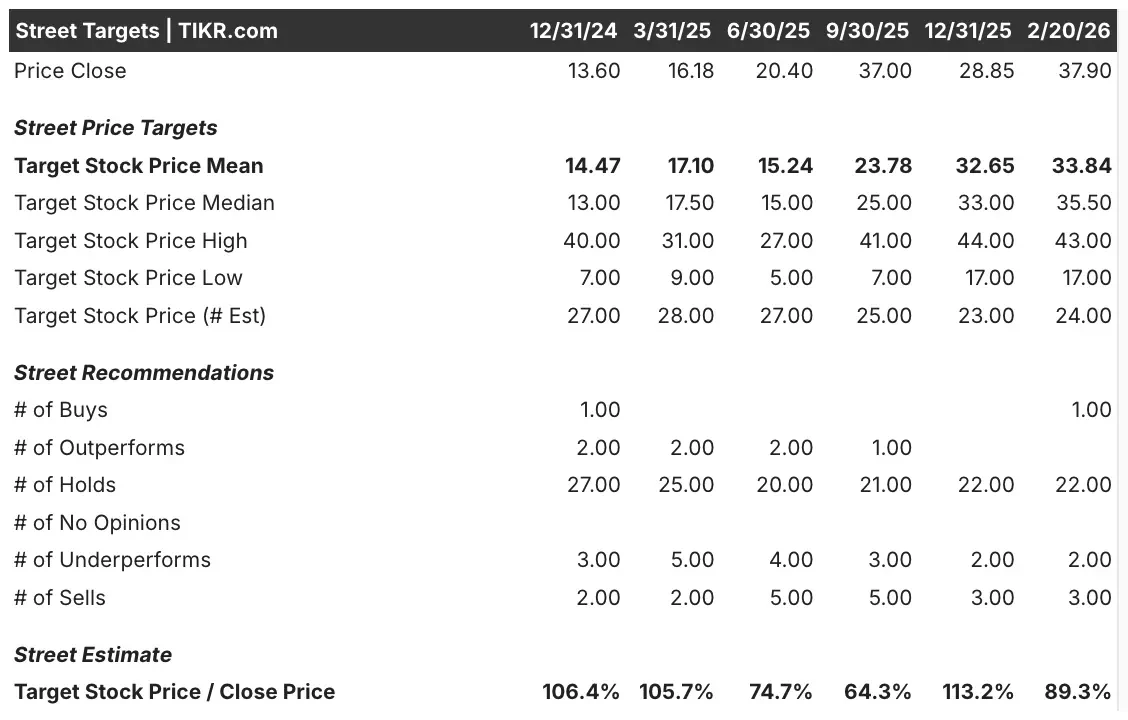
Street data show a mean 12‑month target price of $33.84 based on 24 analyst estimates, implying modest downside from the current level after the recent rally.
Analysts’ targets range from a low of around $17 to a high of $43, and recent actions include Morgan Stanley raising its target to $40 with an Equal Weight rating and TD Cowen boosting its target to $43 with a Buy rating, while others remain cautious.
SolarEdge does, however, generate positive free cash flow, with LTM levered free cash flow of about $226 million and an LTM market‑cap‑to‑FCF multiple around 10x, helped by working‑capital releases and lower capital spending.
Looking forward, analysts expect a forward 2‑year revenue CAGR of roughly 14.5% as demand stabilizes and the Nexis platform, U.S. manufacturing, and AI‑data‑center power initiatives contribute to growth.
Key tailwinds include improving U.S. solar policy sentiment after recent court decisions, production tax credits that support domestic manufacturing, and a broadening product lineup that spans inverters, storage, EV charging, and grid services.
But risks remain significant: SolarEdge is still loss‑making on a GAAP basis, faces intense competition in inverters and batteries, and operates in a policy‑sensitive industry where downturns can quickly pressure pricing and margins again.
Estimate a company’s fair value instantly (Free with TIKR) >>>
How Much Upside Does SEDG Stock Have From Here?
With TIKR’s new Valuation Model tool, you can estimate a stock’s potential share price in under a minute.
All it takes is three simple inputs:
- Revenue Growth
- Operating Margins
- Exit P/E Multiple
If you’re not sure what to enter, TIKR automatically fills in each input using analysts’ consensus estimates, giving you a quick, reliable starting point.
From there, TIKR calculates the potential share price and total returns under Bull, Base, and Bear scenarios so you can quickly see whether a stock looks undervalued or overvalued.
See a stock’s true value in under 60 seconds (Free with TIKR) >>>
Looking for New Opportunities?
- See what stocks billionaire investors are buying so you can follow the smart money.
- Analyze stocks in as little as 5 minutes with TIKR’s all-in-one, easy-to-use platform.
- The more rocks you overturn… the more opportunities you’ll uncover. Search 100K+ global stocks, global top investor holdings, and more with TIKR.
Disclaimer:
Please note that the articles on TIKR are not intended to serve as investment or financial advice from TIKR or our content team, nor are they recommendations to buy or sell any stocks. We create our content based on TIKR Terminal’s investment data and analysts’ estimates. Our analysis might not include recent company news or important updates. TIKR has no position in any stocks mentioned. Thank you for reading, and happy investing!


