
Key Stats for SPG Stock
- Past week performance: -0.4%
- 52-week range: $172 to $239
- Valuation model target price: $281
- Implied upside: 28.3% over 2.3 years
See how Simon Property Group’s rent growth could compound over time with TIKR’s free Guided Valuation Model >>>
Simon Keeps Raising the Bar
Simon Property Group (SPG) posted a strong second quarter, and management didn’t just hit numbers; it raised them. Real estate FFO climbed 7.9% year over year to $3.29 per share, comfortably beating estimates, while revenue jumped roughly 20% to $1.79 billion. Off the back of that quarter, Simon lifted its full-year FFO guidance to a range of $13.20 to $13.30 per share.
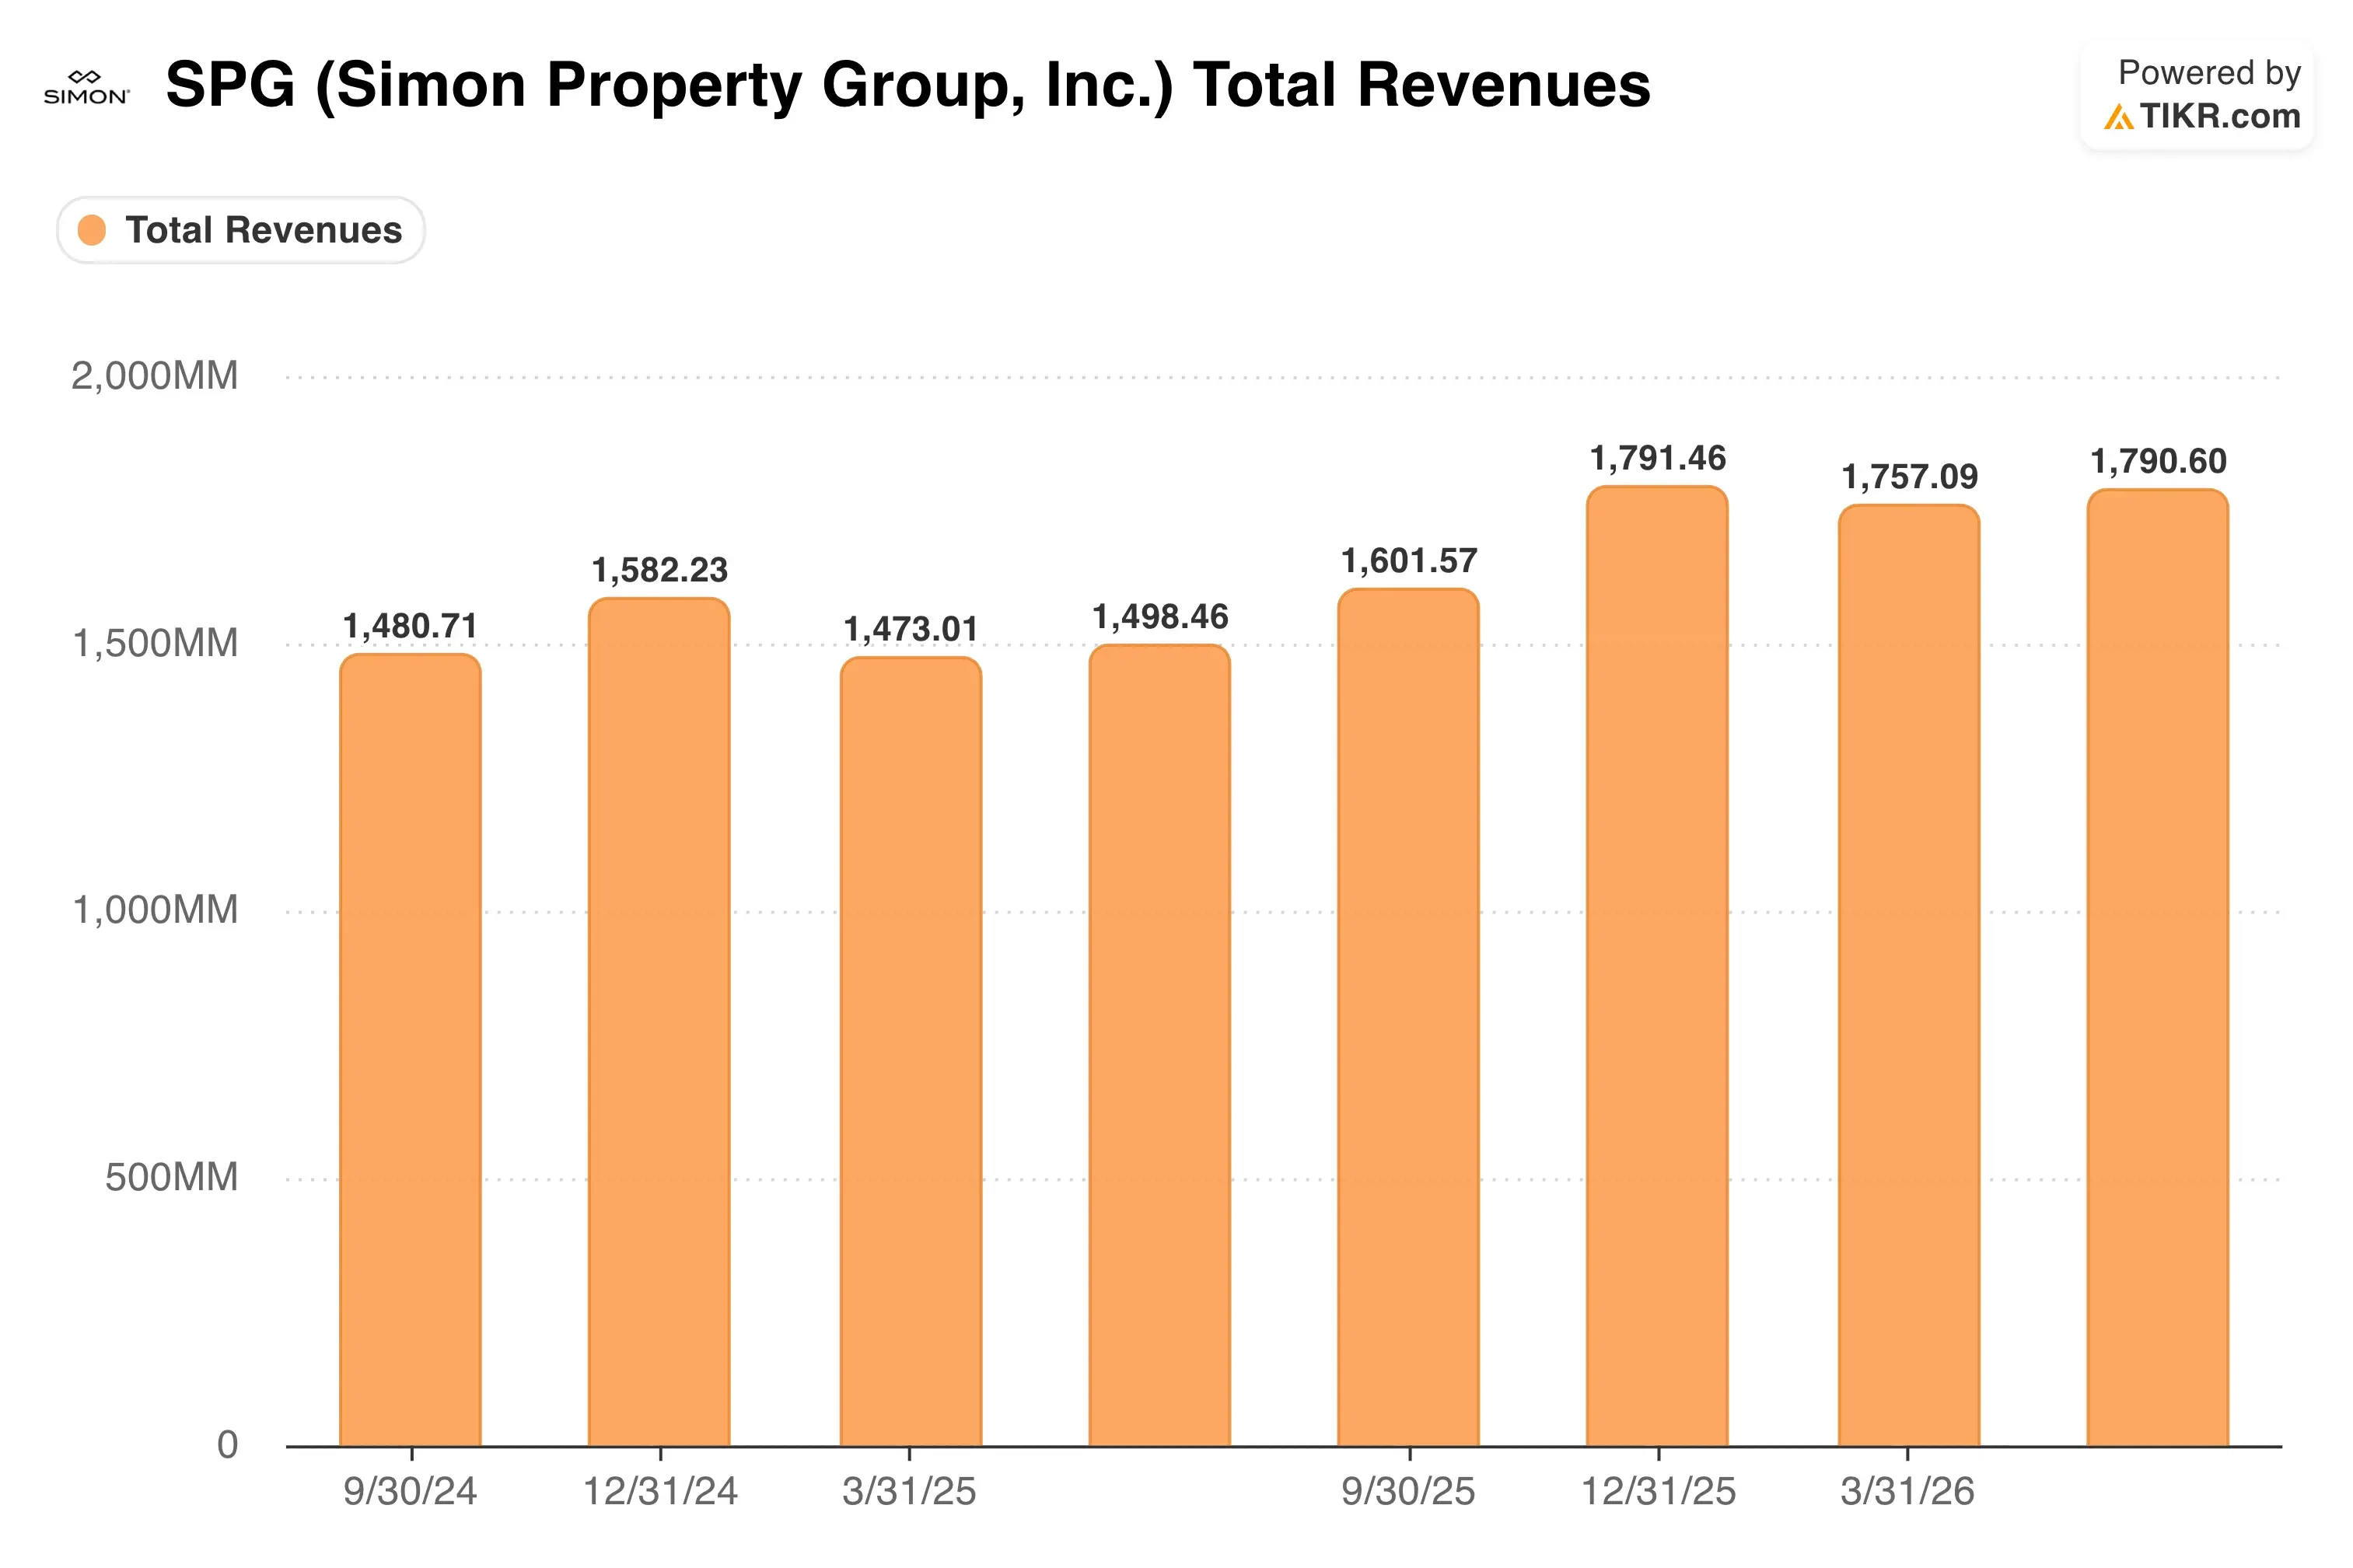
FFO, short for funds from operations, is the REIT industry’s preferred profitability measure because it adds back depreciation on real estate. The stronger number reflects genuine operating momentum, not accounting noise. Simon signed more than 1,200 leases covering 4.8 million square feet in the quarter, with new deal volume up 20% year over year. Base minimum rent on those new leases rose 17% year to date, even as tenant allowances, the upfront cash landlords pay to attract tenants, fell 12%.
That combination matters because it shows Simon has real pricing power right now. Average base minimum rent across malls and outlets climbed 6.3% to $62 per square foot, while occupancy held steady at 96.0%. Trailing 12-month retailer sales per square foot rose 13.9% to $838, giving Simon room to keep pushing rents higher as leases roll over.
CEO Eli Simon, who took over after his father David Simon’s passing in March, told analysts on the Q2 call that “we have not seen any change in sales” heading into the back half of the year. That steadiness is notable given how many retailers have flagged softer consumer spending elsewhere. If SPG stock keeps posting occupancy near 96% alongside double-digit rent spreads, the next catalyst is Q3 earnings in November.
See analysts’ growth forecasts and price targets for SPG (It’s free) >>>
Is SPG Still Undervalued?

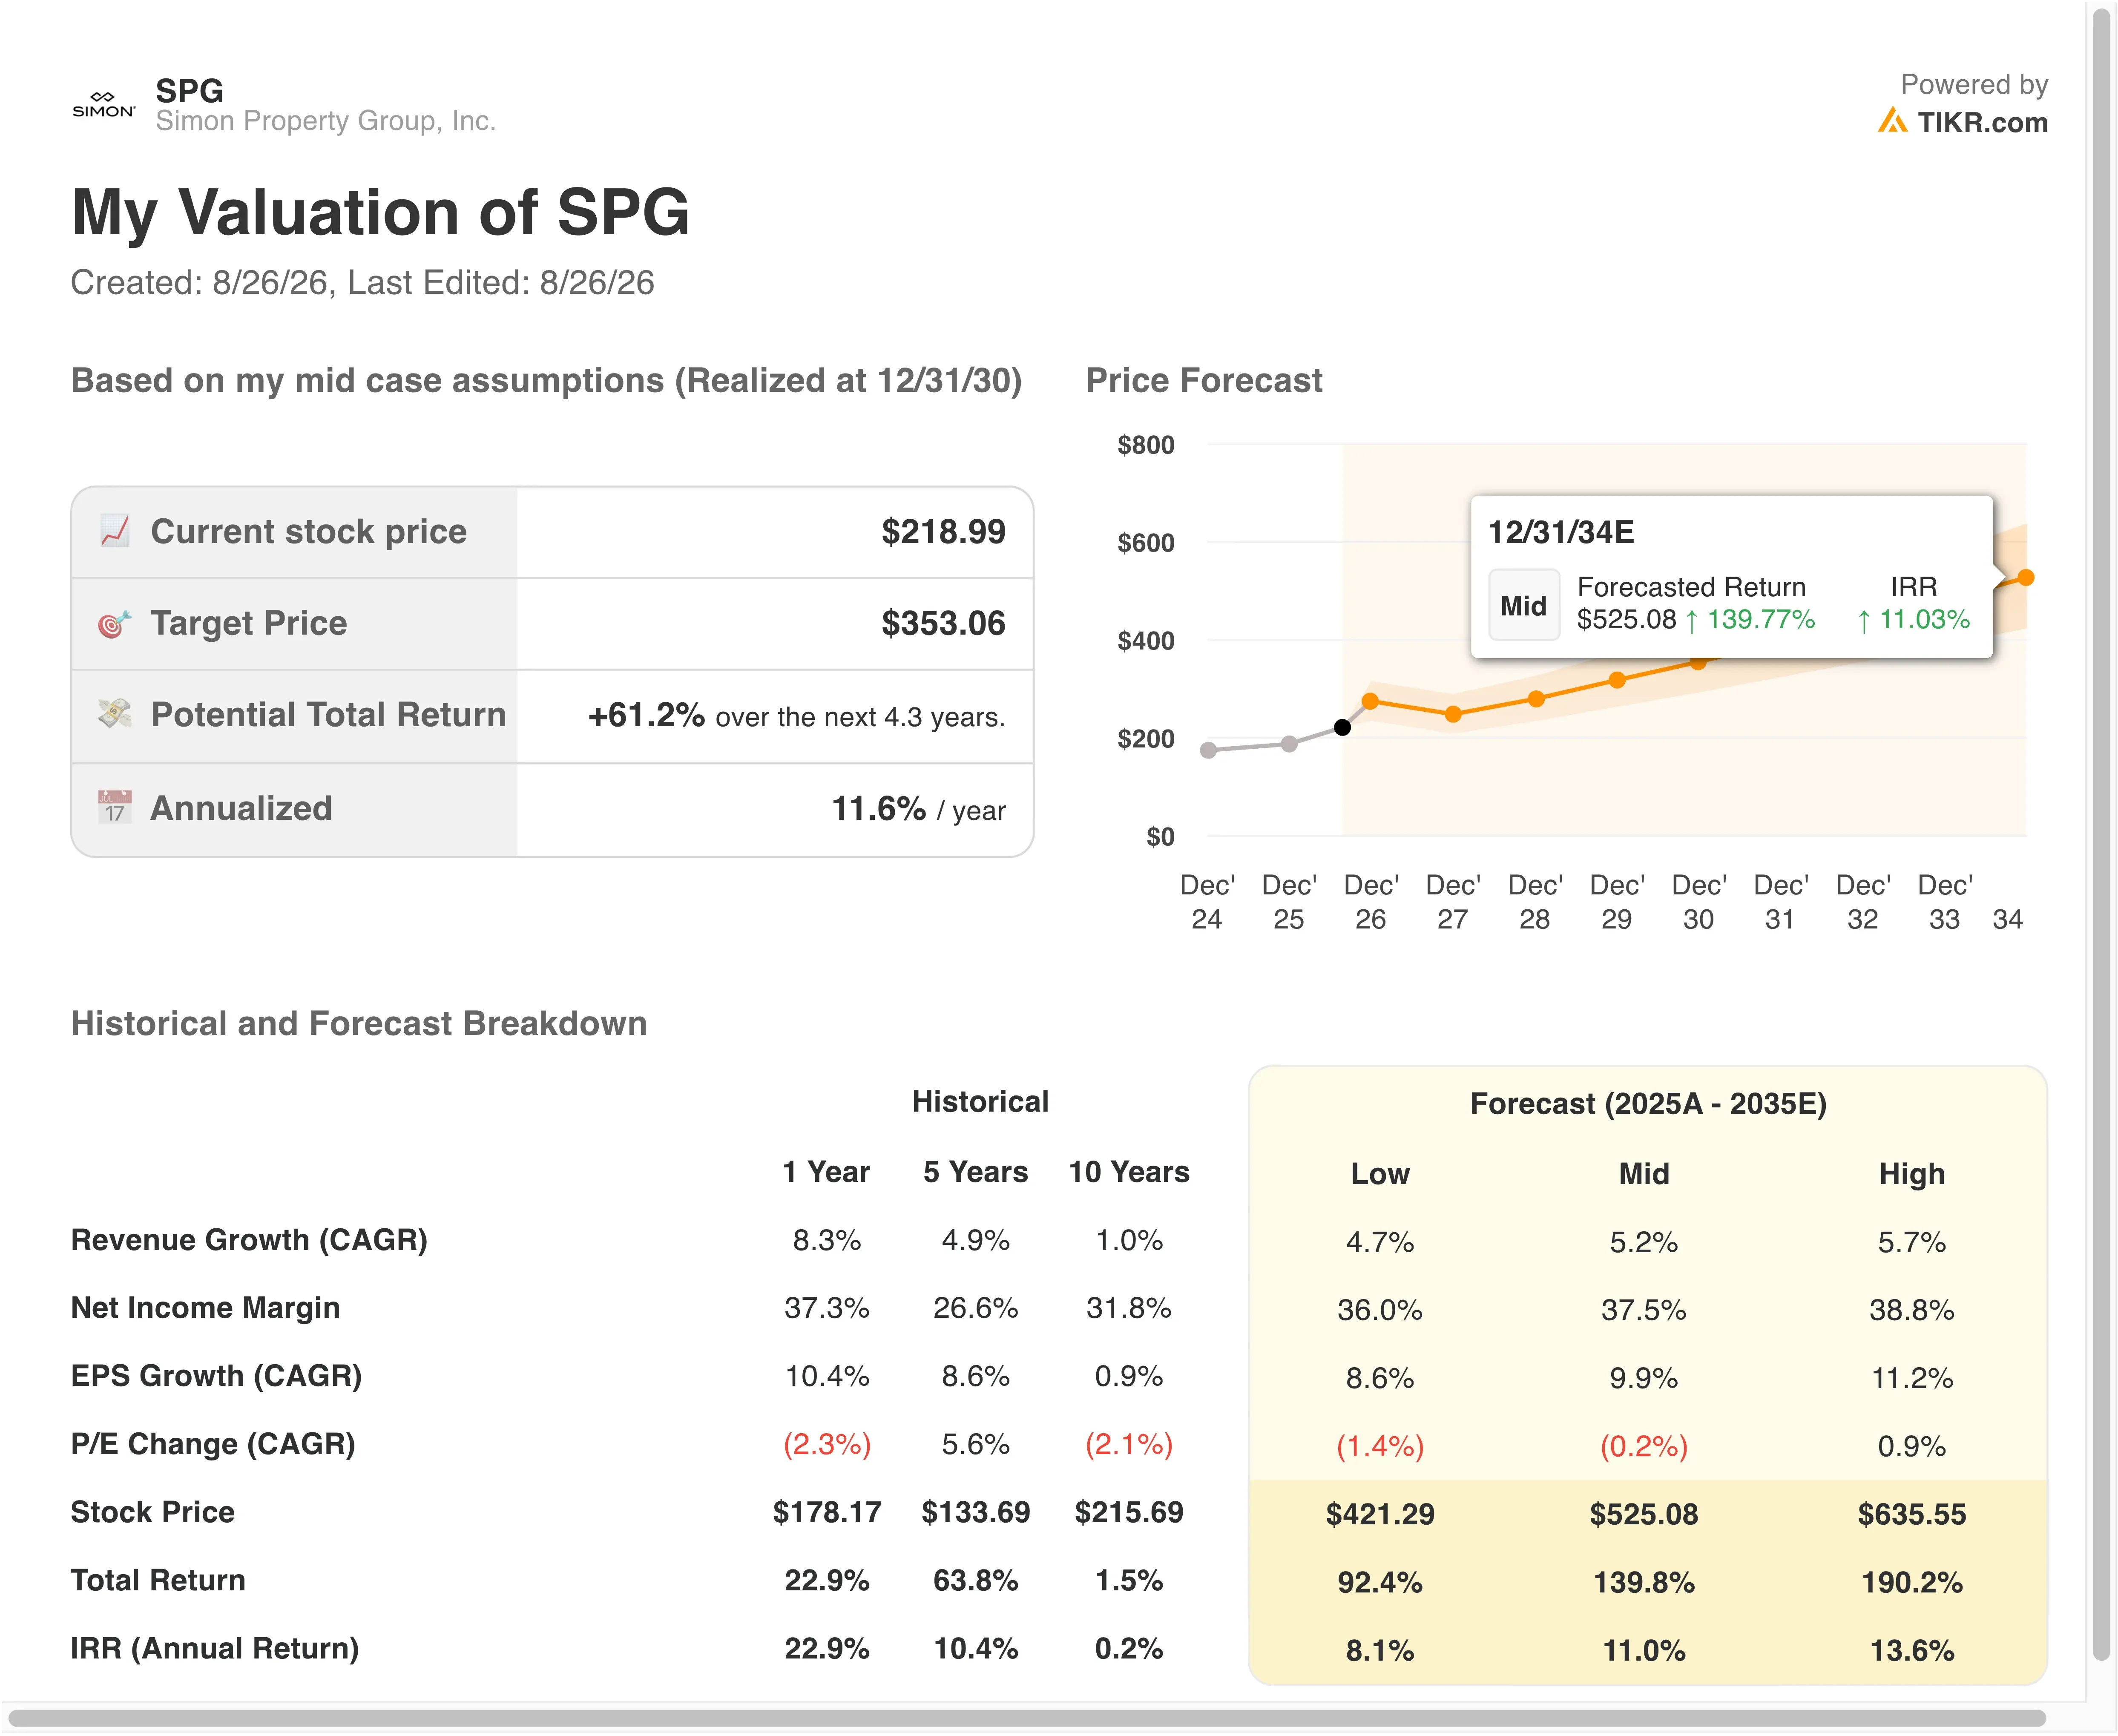
Under valuation model assumptions realized through 12/31/28, the stock is modeled using:
- Revenue Growth (CAGR): 7.1%
- Operating Margins: 48.6%
- Exit P/E Multiple: 25.9x
Based on these inputs, the model estimates a $281 target price, implying 28.3% total upside from the current share price and an 11.2% annualized return over the next 2.3 years.
An 11.2% annualized return sits in moderately attractive territory, and the underlying operating trends support that framing. Simon’s 48.6% operating margin assumption is actually below its trailing 47.4% LTM figure, so the model isn’t demanding heroic margin expansion, just continued execution on leasing.
Simon’s competitive position looks strong relative to peers. Kimco Realty (KIM), a grocery-anchored shopping center REIT, posted 4.5% FFO per share growth in Q2 with occupancy at 96.4%, roughly in line with Simon’s pace but with far lower new-lease rent spreads. Macerich (MAC), a smaller mall operator, reported flat FFO per share and 96.3% occupancy, a sign Simon’s scale and premium mall portfolio are still winning share.
The real question is how long 96% occupancy and mid-teens rent spreads can persist. Management itself expects some moderation in the second half due to tougher comparisons. Even so, with a roughly $4 billion development pipeline still generating 9% yields on new projects, Simon has more than one lever left to pull.
Estimate a company’s fair value instantly (Free with TIKR) >>>
Simon Property Group vs. Kimco and Macerich
Kimco Realty (KIM) delivered 4.5% FFO per share growth in Q2 2026 and matched its all-time high occupancy of 96.4%, with new-lease spreads reaching 40.4%, the 19th straight quarter of double-digit growth. That is a genuinely strong result, but it still trails Simon’s 7.9% FFO growth, and 17% blended new-lease rent spreads over the same period. Macerich (MAC), by comparison, posted FFO per share flat year over year at $0.34, alongside 96.3% occupancy, reflecting a smaller and less premium mall footprint.
Simon’s advantage comes from its mix of high-traffic malls and premium outlets, which continue to command outsized demand from retailers even as smaller centers see more moderate growth. That gap in rent spreads, 17% at Simon versus roughly 11% at Kimco on comparable leases, is the clearest evidence of Simon’s pricing power within the sector.
What’s Driving SPG Stock Going Forward?
The biggest swing factor is Simon’s roughly $4 billion development and redevelopment pipeline, including about $600 million in new project starts planned for the second half of 2026. Those projects are underwritten at a 9% yield, meaning each dollar invested should generate meaningful incremental NOI once complete. That gives Simon a growth lever beyond simply raising rents on existing space.
Management also flagged July traffic accelerating to 3.6% year over year, ahead of the 2% pace seen during the quarter. If that trend holds, it would support Simon’s case that consumer demand for physical retail remains healthy even as some retailers pull back guidance elsewhere. The launch of the “Simon Media Network,” which monetizes first-party shopper data across more than 4,000 digital screens, adds another potential revenue stream investors will watch.
Risks remain, particularly around retailer bankruptcies. Simon absorbed roughly 1 million square feet of space from Saks Off Fifth-related closures this quarter but re-leased it successfully. As long as that pattern continues, occupancy near 96% should hold even through further retail consolidation.
See how Simon’s $4 billion pipeline could impact your own return assumptions (Free with TIKR) >>>
Should You Invest in Simon Property?
The only way to really know is to look at the numbers yourself. TIKR gives you free access to the same institutional-quality financial data that professional analysts use to answer exactly that question.
Pull up SPG, and you’ll see years of historical financials, what Wall Street analysts expect for revenue and earnings in the quarters ahead, how valuation multiples have moved over time, and whether price targets are trending up or down.
You can build a free watchlist to track SPG alongside every other stock on your radar. No credit card required. Just the data you need to decide for yourself.
Analyze SPG stock on TIKR Free→
Disclaimer:
Please note that the articles on TIKR are not intended to serve as investment or financial advice from TIKR or our content team, nor are they recommendations to buy or sell any stocks. We create our content based on TIKR Terminal’s investment data and analysts’ estimates. Our analysis might not include recent company news or important updates. TIKR has no position in any stocks mentioned. Thank you for reading, and happy investing!