


Realty Income (O) stock has fallen 15.2% over the past three months, closing at $54 on October 2 after trading near $66 in July. The stretch includes an August 5 guidance raise and a September 14 joint venture with KKR.
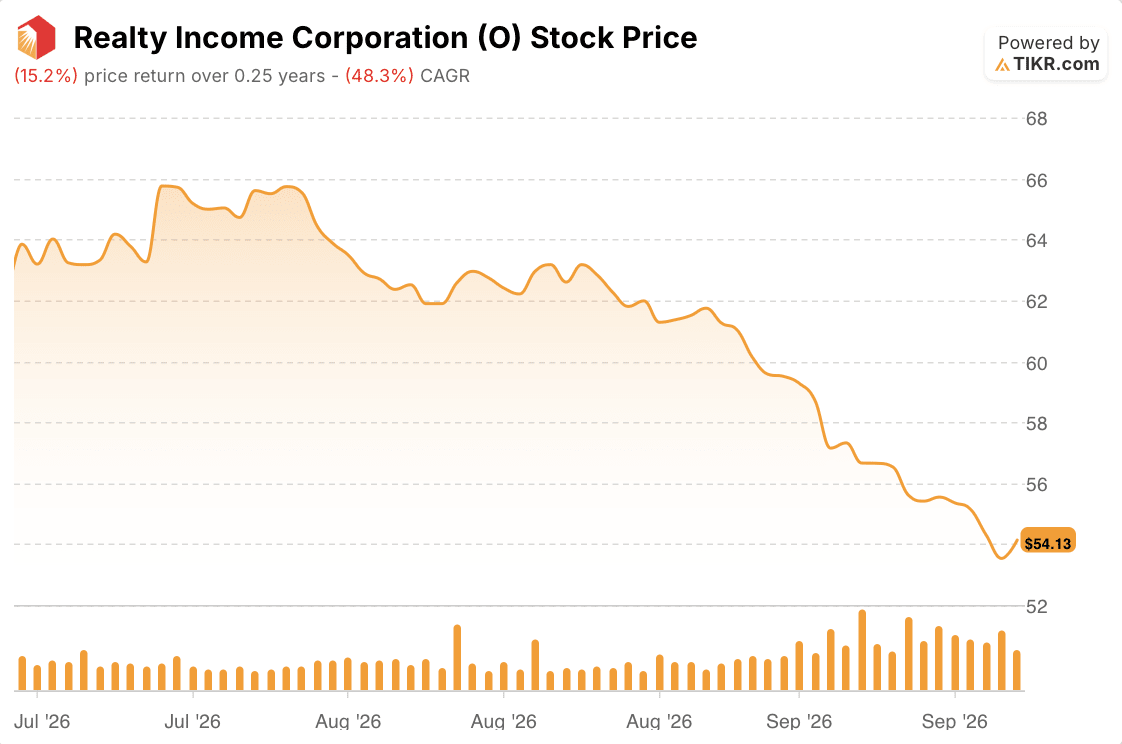
Four dated items sit along the path:
- On August 5, Realty Income reported second-quarter AFFO (adjusted funds from operations, the cash earnings measure REITs report) per share of $1.09, up 3.8%, and raised full-year guidance to $4.44 to $4.45 on its Q2 earnings call.
- It priced an upsized $875 million offering of 3.75% convertible notes on August 11, using that day’s $61.89 closing price as the conversion-price reference, and closed the offering at $1.0 billion on August 14.
- Barclays cut its target to $65 from $67 on September 4.
- On September 14, KKR agreed to invest €528 million for a 49% stake in a stabilized European net lease portfolio.
Chief Financial Officer Jonathan Pong described the backdrop at the Bank of America real estate conference on September 15: “with a 5% 10-year yield, and with the cost of capital that is higher today than it was 3 months ago.”
The closes line up with the chart: $62 on June 30, a high near $66 in July, $62 on August 11 and $54 on October 2, a 13% drop from August 11.
Realty Income Stock Carries 17 Holds and a $66 Mean Target
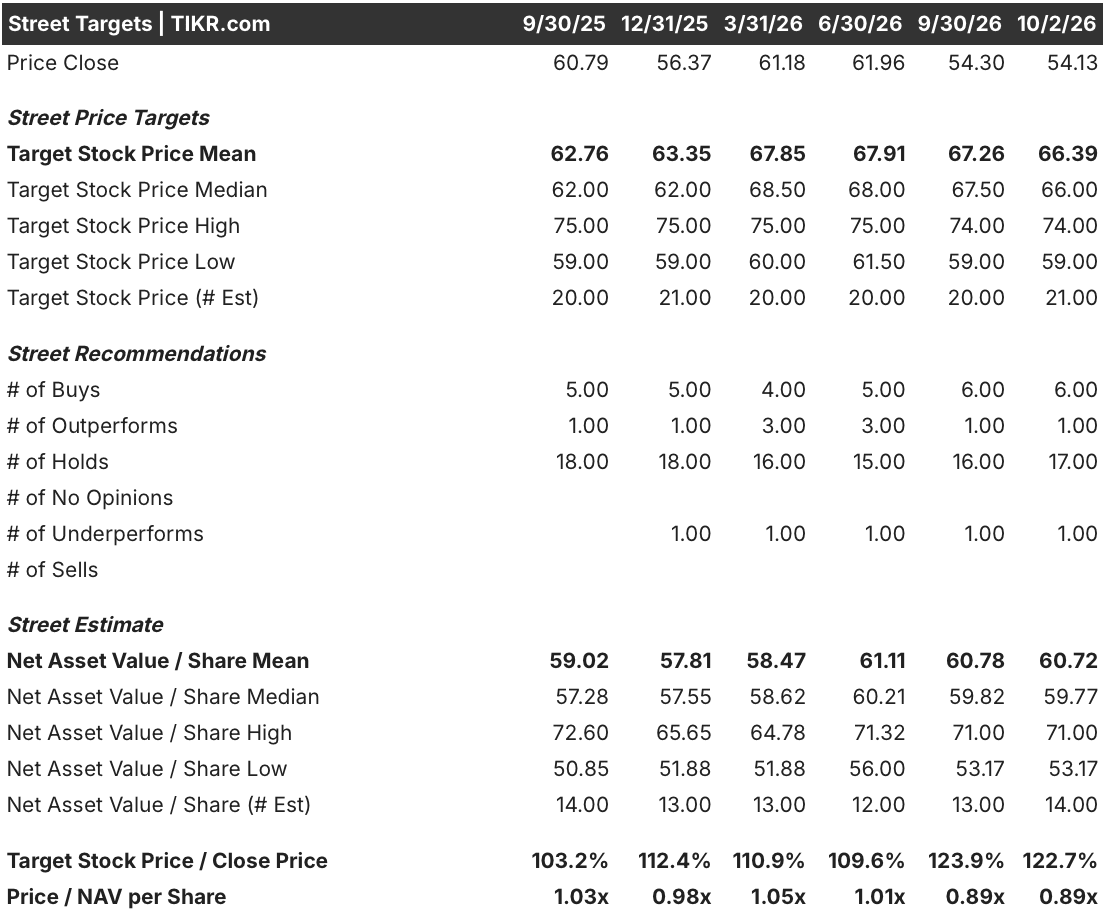
The current split on Realty Income stock is 6 buys, 1 outperform, 17 holds and 1 underperform, against 5 buys, 3 outperforms, 15 holds and 1 underperform on June 30. The mean price target slipped 2% over that stretch, from $68 to $66, while the closing price fell 13% from $62 to $54, which leaves the mean 23% above the October 2 close. The lowest of the 21 price targets, $59, sits 9% above the close.
TIKR Values Realty Income Stock at $80, a 46.9% Return by 2030
I ran TIKR’s mid case on Realty Income stock with revenue growing 5.5% a year, a net income margin of 19.8%, EPS growth of 4.5% a year and the P/E rising 1.3% a year. Revenue growth runs under the last year’s 7.8%, and EPS growth under its 9.6%. The multiple departs from the record: the P/E fell 18.8% over the past year and 3.5% a year over ten.
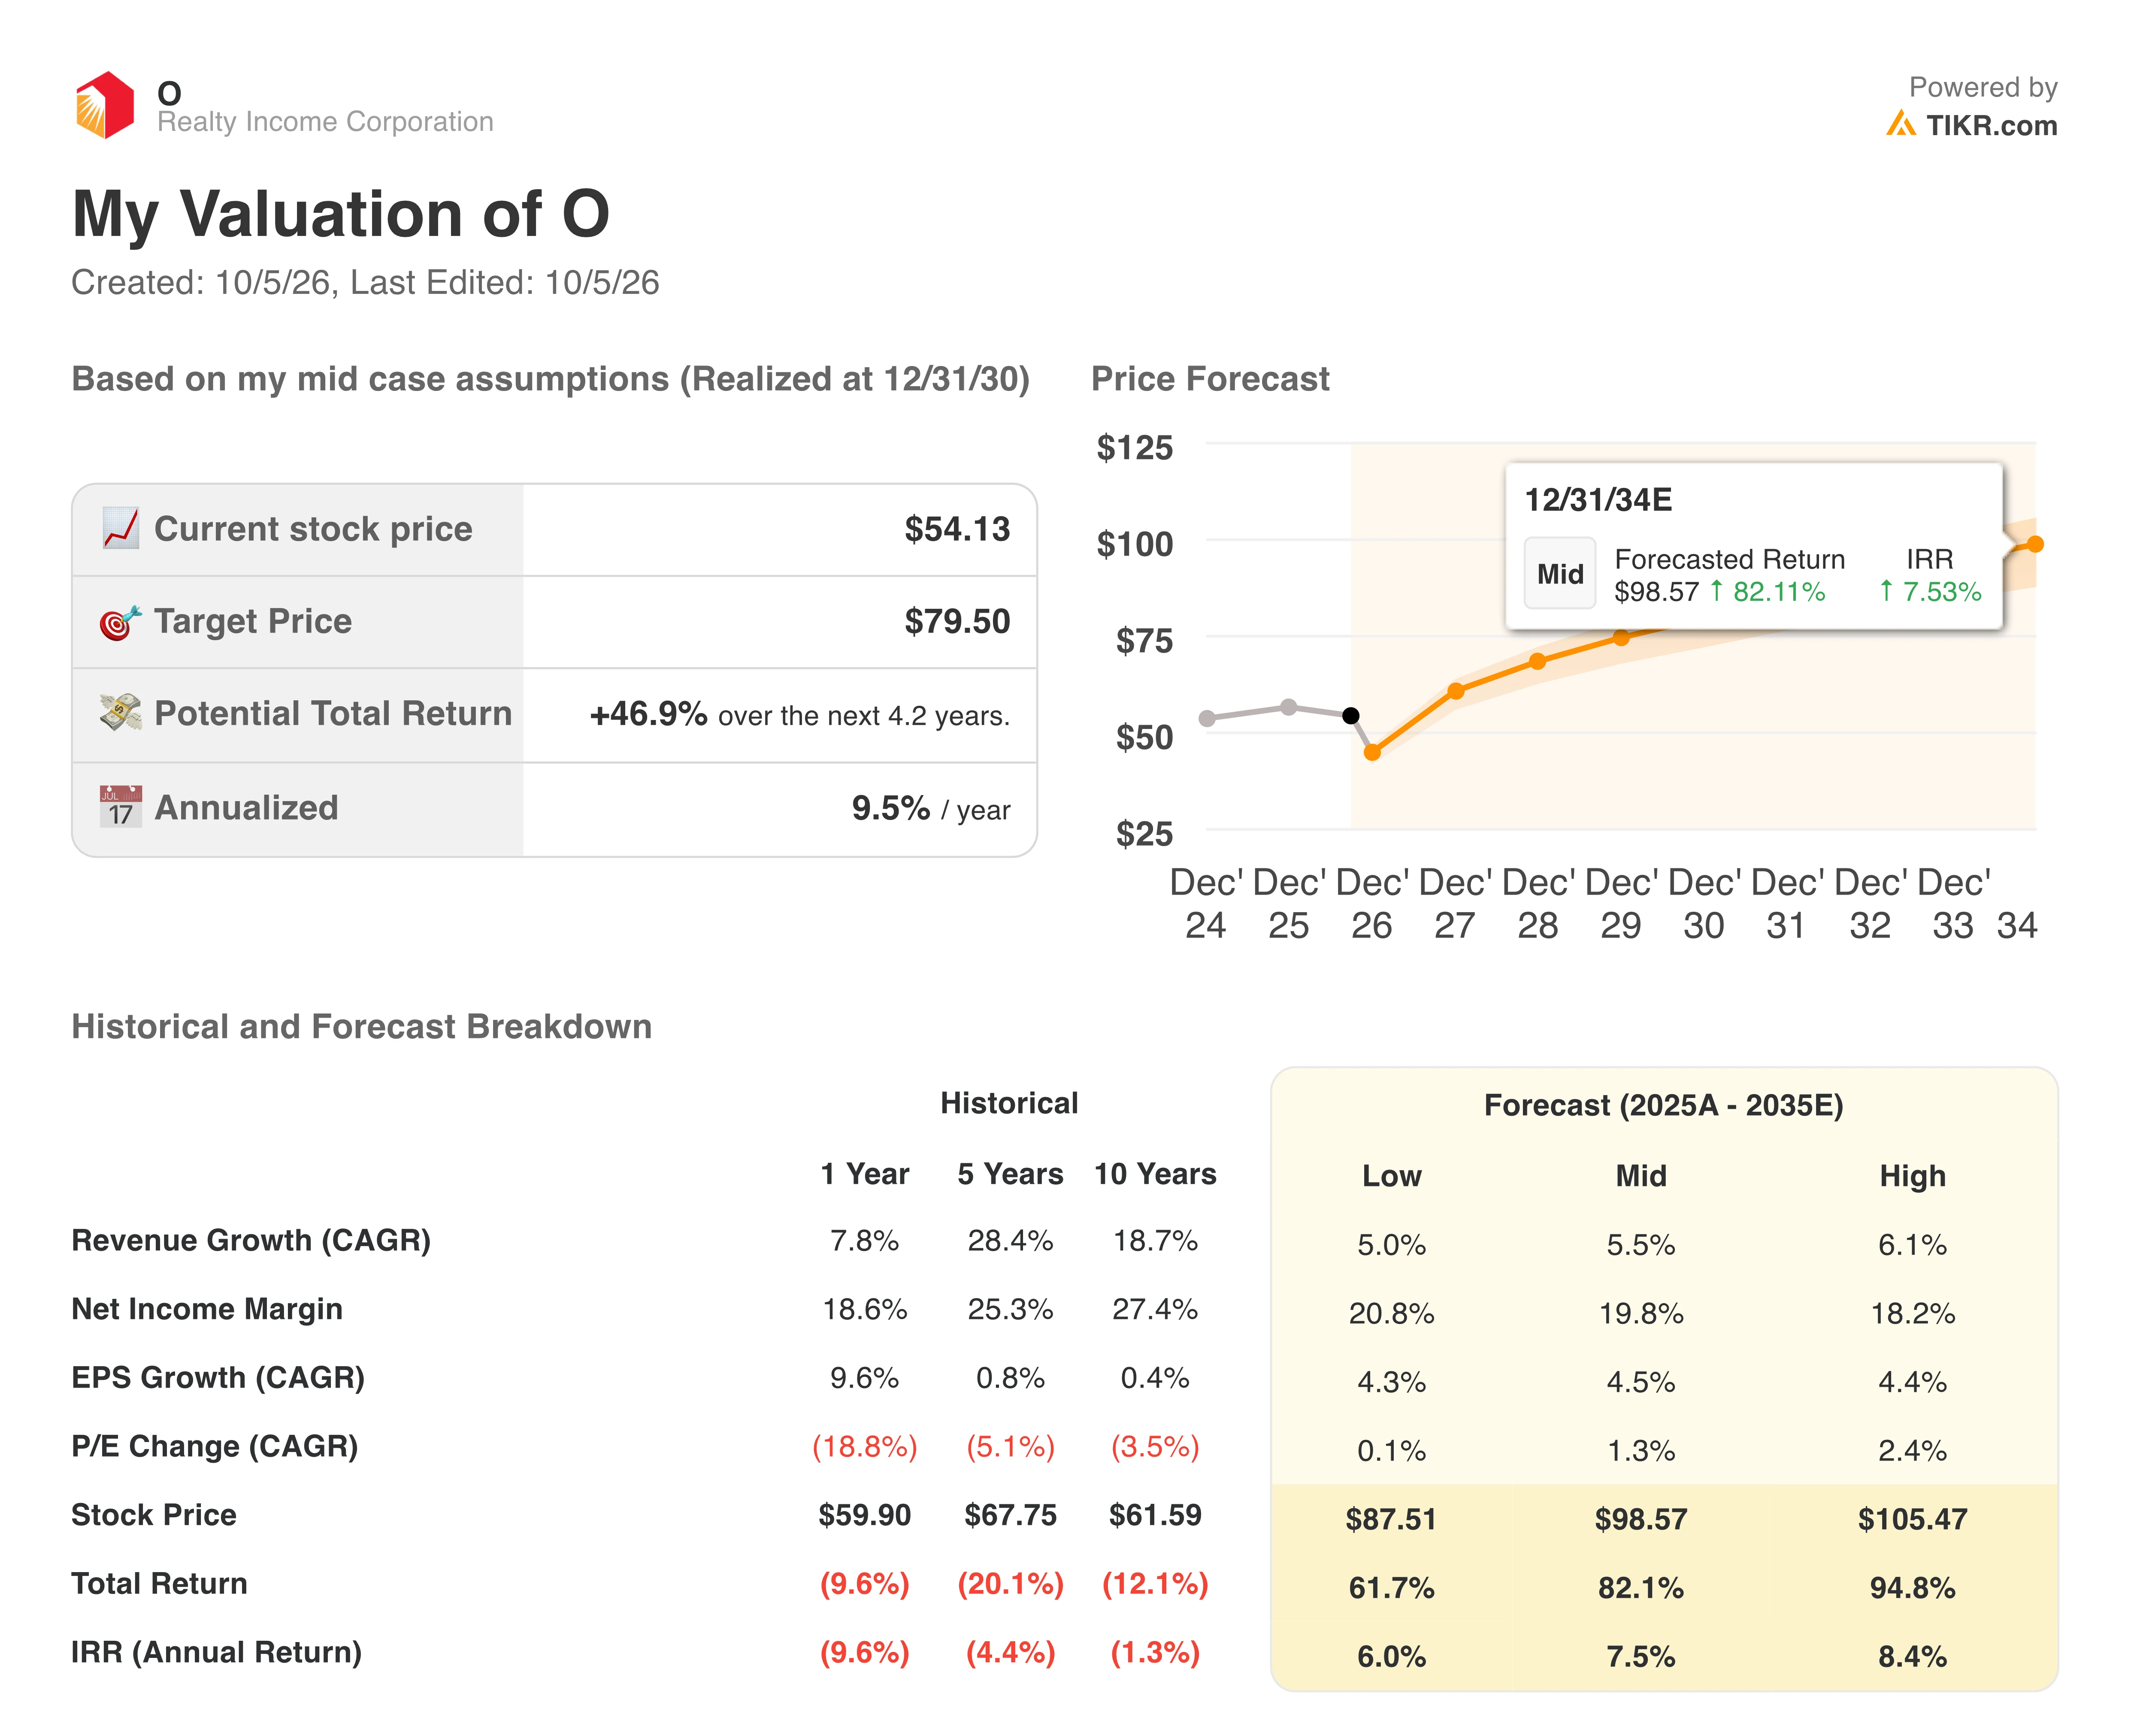
I assumed EPS growth of 4.5%. Separately, Chief Executive Sumit Roy put full-year AFFO per share growth at approximately 4% at the midpoint (AFFO and EPS are different measures, so that guidance does not directly support the model’s EPS assumption).
The model lands at $80 by December 31, 2030, a 46.9% total return from the $54 close over 4.2 years, or 9.5% a year.
By my math, $80 is 1.5 times the October 2 close and sits above the highest published target of $74. The number to track is EPS growth against that 4.5%, with the third-quarter report on November 2, after the NYSE close, as the first checkpoint.
I set EPS growth at 4.5% and the P/E change at 1.3%. Change either input and run your own Realty Income model on TIKR for free →
So what is Realty Income stock actually worth?
TIKR lets you forecast the future price of any stock in less than a minute. Just enter a few assumptions into TIKR’s valuation model and see what O stock could be worth. Start from Wall Street consensus estimates, or adjust the inputs to reflect your own view of the business. It’s free to use.
Value Realty Income Corporation for free→
Disclaimer:
Please note that the articles on TIKR are not intended to serve as investment or financial advice from TIKR or our content team, nor are they recommendations to buy or sell any stocks. We create our content based on TIKR Terminal’s investment data and analysts’ estimates. Our analysis might not include recent company news or important updates. TIKR has no position in any of the stocks mentioned. Thank you for reading, and happy investing!


