Key Takeaways for Procter & Gamble Stock
- Procter & Gamble delivered revenue of $21.24 billion in Q3 fiscal 2026, up 7% year over year.
- Operating income reached $5.26 billion, a 10% increase over the prior-year quarter.
- Operating margins came in at 25%, up from 24% in the year-ago period, as operating leverage began to reassert itself across a broad organic growth recovery.
- TIKR’s model values Procter & Gamble stock at approximately $202 by mid-2030, implying around 35% total return from the current price.
The income statement is doing something the market hasn’t fully priced into Procter & Gamble stock. See P&G’s full financial history and analyst targets on TIKR for free →
P&G Beats Revenue Estimates in Q3 FY2026, Organic Growth Reaches All 10 Categories

Procter & Gamble (PG) delivered its strongest organic sales quarter in several periods after Q3 fiscal 2026 results showed the global consumer goods giant growing revenue across all 10 product categories for the first time in years.
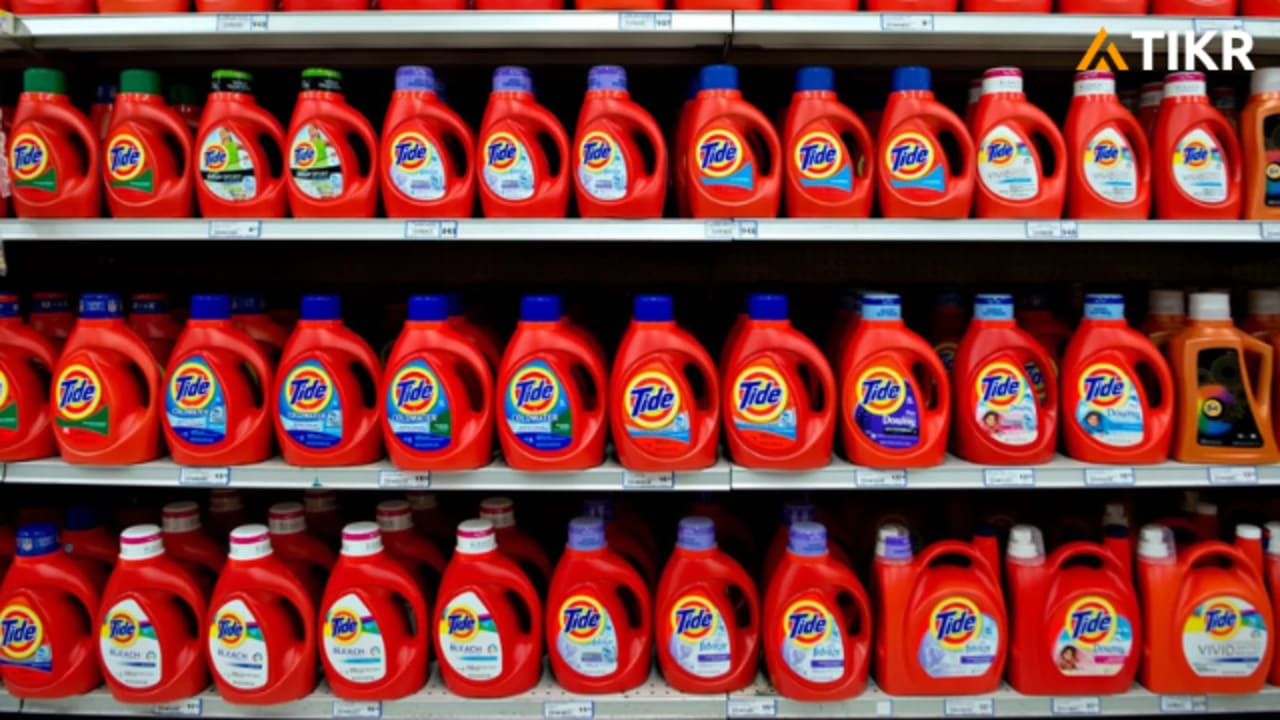
P&G makes and sells daily-use products including Tide detergent, Pampers diapers, Oral-B toothbrushes, and SK-II skincare, sold through retail, online, and specialty channels in roughly 70 countries.
CFO Andre Schulten confirmed organic sales grew more than 3% in the quarter, with volume up 2 points and pricing contributing an additional point.
North America led regional performance with 4% organic growth, while Greater China expanded 3% and SK-II, the company’s luxury skincare brand, grew 18% in the quarter.
Schulten was direct in framing the quarter’s significance: “We saw a solid acceleration in top line results in our fiscal third quarter.”
The Tide liquid detergent relaunch in the U.S. became the quarter’s most visible demand catalyst, with Schulten describing the formula upgrade as “the biggest upgrade we made in 25 years” and the business delivering mid-teens growth as a result.
Baby Care grew 19% in Greater China despite a declining birth rate, illustrating a recurring pattern: when P&G pairs product innovation with sharper consumer communication, category share follows even in contracting markets.
A 15% nonmanufacturing headcount reduction target remains on track and Supply Chain 3.0, P&G’s program to automate and digitize production through unattended factory operations and real-time quality monitoring, is scaling across 9 categories.
The forward complication is commodity cost exposure: Schulten cited a roughly $1 billion after-tax headwind from conflict-driven energy and feedstock cost increases, with nearly all of the impact expected to land in Q4.
The organic growth acceleration behind these results has a specific income statement mechanism worth understanding before the Q4 noise hits. Pull up PG’s income statement on TIKR for free →
PG’s Operating Leverage Is Turning: Revenue Acceleration Meets Controlled Opex

Procter & Gamble’s revenue reached $21.24 billion in the most recent quarter, a 7% increase over the same period last year and the fastest year-over-year growth rate in the eight quarters visible in the data.
Gross profit came in at $10.63 billion, with gross margins at 50%, consistent with the range the business has held across the trailing eight quarters despite the ongoing reinvestment cycle.
Operating income grew to $5.26 billion, a 10% year-over-year improvement, outpacing the revenue growth rate and providing the first clear signal that operating leverage is beginning to reassert itself.
The result: operating margins reached 25% in the quarter, up from 24% in the year-ago period, the first meaningful margin expansion in the trailing eight quarters rather than another step down.
Total operating expenses held at $5.76 billion, rising at a slower rate than revenue, confirming that the headcount restructuring and supply chain automation are beginning to restrain cost growth even as P&G reinvests in brand and innovation.
P&G Leads CL and KMB on Operating Margins, but the Spread Is Compressing

Procter & Gamble has held an operating margin above 24% in every quarter across the trailing eight periods, a level Colgate-Palmolive (CL) and Kimberly-Clark (KMB) have not approached.
Colgate-Palmolive posted a 21% operating margin in the most recent quarter, a gap of roughly 4 points below P&G’s 25% result for the same period.
Kimberly-Clark ran at 19% in the most recent quarter, the widest structural gap in the comparison set and a figure that has trailed P&G’s floor by at least 5 points across the full eight-quarter window.
The more instructive signal is directional: Kimberly-Clark’s operating margin recovered from a trough of 13% to 19% over eight quarters, a faster pace of expansion than P&G’s own recovery from its 24% floor.
That compression matters for the thesis: if P&G’s margin lead narrows as peers recover from their own cost cycles faster, the operating leverage inflection visible in the income statement must accelerate to justify the premium the market has historically assigned to P&G stock.
The data across eight quarters shows P&G’s margin range holding between 24% and 28% while both peers oscillated more widely, which argues the lead is structural rather than cyclical, but the convergence trend in the most recent quarter is worth monitoring as commodity headwinds hit all three companies simultaneously.
Is Procter & Gamble Stock Undervalued in 2026? TIKR’s $202 Model Makes the Case
TIKR’s model values Procter & Gamble at approximately $202 by June 2030, implying around 35% total return from the current price of approximately $150, or roughly 8% per year.
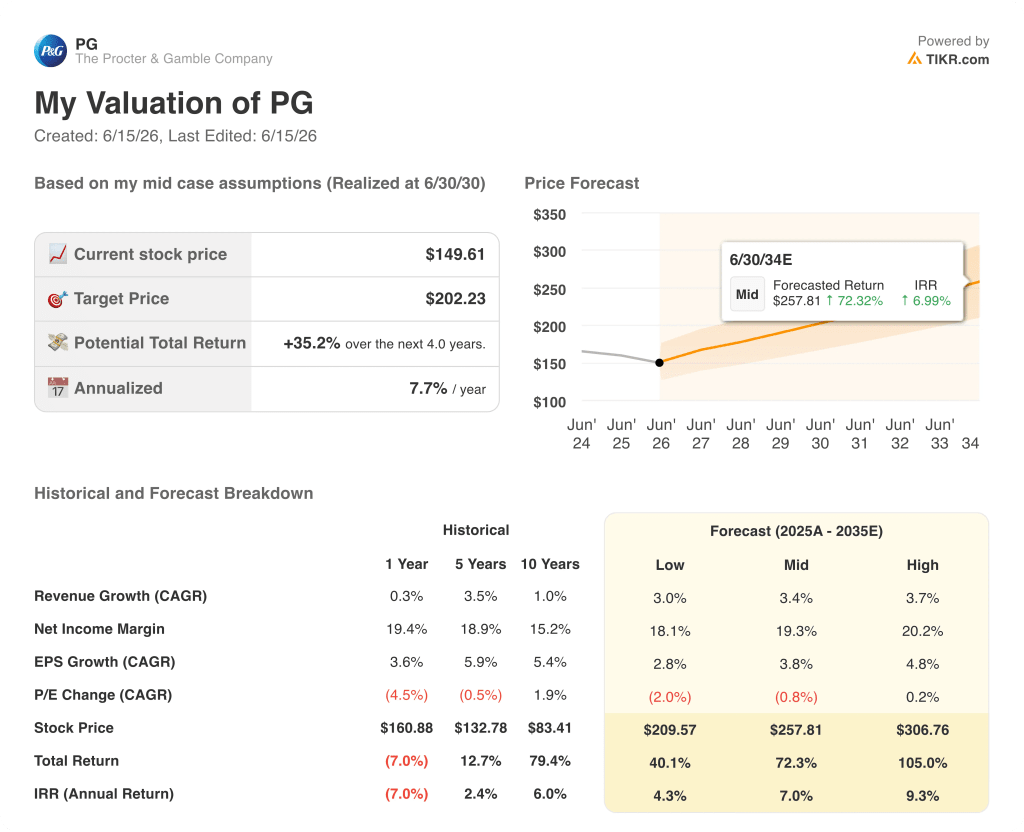
The income statement mechanism that makes this target credible is the operating leverage inflection confirmed in the most recent quarter.
If operating margins continue expanding from the trough established in the prior two years, the earnings power trajectory required to support a $202 target is achievable without requiring heroic revenue growth assumptions.
The condition that has to hold is the one the transcript already addressed: P&G must sustain investment in innovation and demand creation while absorbing the near-term commodity headwind, rather than cutting to protect short-term margins at the expense of the volume momentum now visibly building.
Explore the full TIKR valuation model for PG, including scenario returns and historical multiples. Access the model on TIKR for free →
Should You Invest in The Procter & Gamble Company?
The only way to really know is to look at the numbers yourself. TIKR gives you free access to the same institutional-quality financial data that professional analysts use to answer exactly that question.
Pull up The Procter & Gamble Company stock and you’ll see years of historical financials, what Wall Street analysts expect for revenue and earnings in the quarters ahead, how valuation multiples have moved over time, and whether price targets are trending up or down.
You can build a free watchlist to track The Procter & Gamble Company alongside every other stock on your radar. No credit card required. Just the data you need to decide for yourself.
Access Professional Tools to Analyze PG stock on TIKR for Free →
Has P&G Stock Raised Its Dividend in 2026?
P&G raised its quarterly dividend 3% to $1.0885 per share in April 2026, marking the company’s 70th consecutive annual dividend increase and extending one of the longest unbroken payout-growth streaks in the S&P 500.