

Key Stats for Newmont Stock
- Past-Week Performance: -10%
- 52-Week Range: $41 to $135
- Valuation Model Target Price: $130
- Implied Upside: 11% over 1.9 years
What Happened to NEM Stock?
Newmont Corporation (NEM) stock fell roughly 10% over the past week through February 4, trading with elevated volatility after late-January highs, following sharp intraday swings rather than a sustained directional trend.
Reuters reports framed trading in late January and early February as gold rose above $5,300 per ounce before falling below $5,000 within the same week.
Newmont management disclosed no new operating updates, production revisions, margin guidance, or capital allocation changes during the period, leaving prior earnings commentary and strategy unchanged.
However, market participants appeared to focus on Newmont’s high sensitivity to spot gold prices, with rapid bullion reversals compressing short-term expectations despite previously improving cash flow dynamics at elevated gold levels.
The week’s decline reflected trading adjustments to late-January commodity volatility rather than revised views on Newmont’s outlook, strategy, or operating performance, which remained consistent with previously communicated expectations.
Is NEM Stock Fairly Valued Right Now?
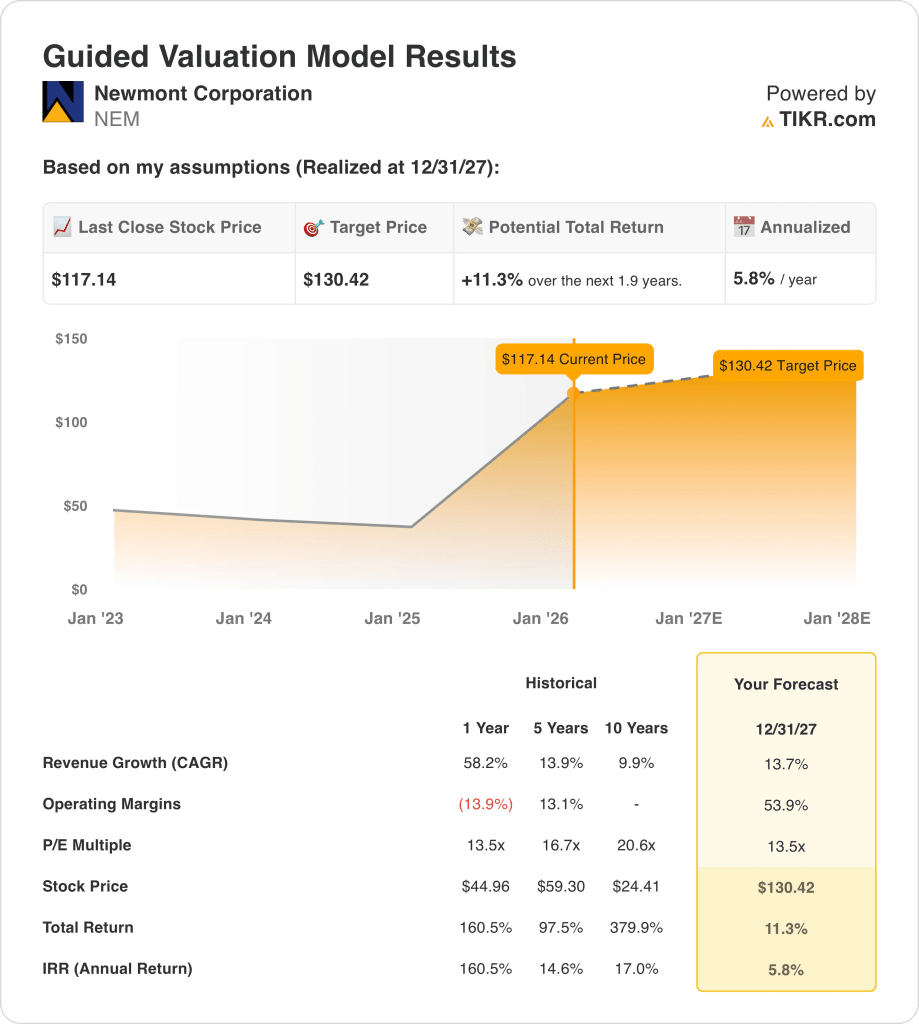
Under the valuation model shown, the stock is modeled using:
- Revenue Growth: 13.7%
- Operating Margins: 53.9%
- Exit P/E Multiple: 13.5x
Is Newmont Stock Undervalued?
The valuation model indicates Newmont stock appears undervalued over a 1.9-year horizon, conditional on assumptions holding through December 31, 2027.
Specifically, the model assumes 13.7% revenue growth, 53.9% operating margins, and a 13.5x exit P/E multiple.
Accordingly, the model estimates a $130.42 target price, implying 11.3% total upside and a 5.8% annualized return.
Moreover, execution depends on sustaining scale-driven revenue growth and maintaining elevated margins supported by a high gold price environment.
Therefore, Newmont stock’s valuation remains execution-dependent, as commodity volatility and operational delivery risk could materially affect modeled outcomes.
Value Any Stock in Under 60 Seconds (It’s Free)
With TIKR’s new Valuation Model tool, you can estimate a stock’s potential share price in under a minute.
All it takes is three simple inputs:
- Revenue Growth
- Operating Margins
- Exit P/E Multiple
From there, TIKR calculates the potential share price and total returns under Bull, Base, and Bear scenarios so you can quickly see whether a stock looks undervalued or overvalued.
If you’re not sure what to enter, TIKR automatically fills in each input using analysts’ consensus estimates, giving you a quick, reliable starting point.


