
Key Stats for Amgen Stock
- Past-Week Performance: -4%
- 52-Week Range: $261 to $353
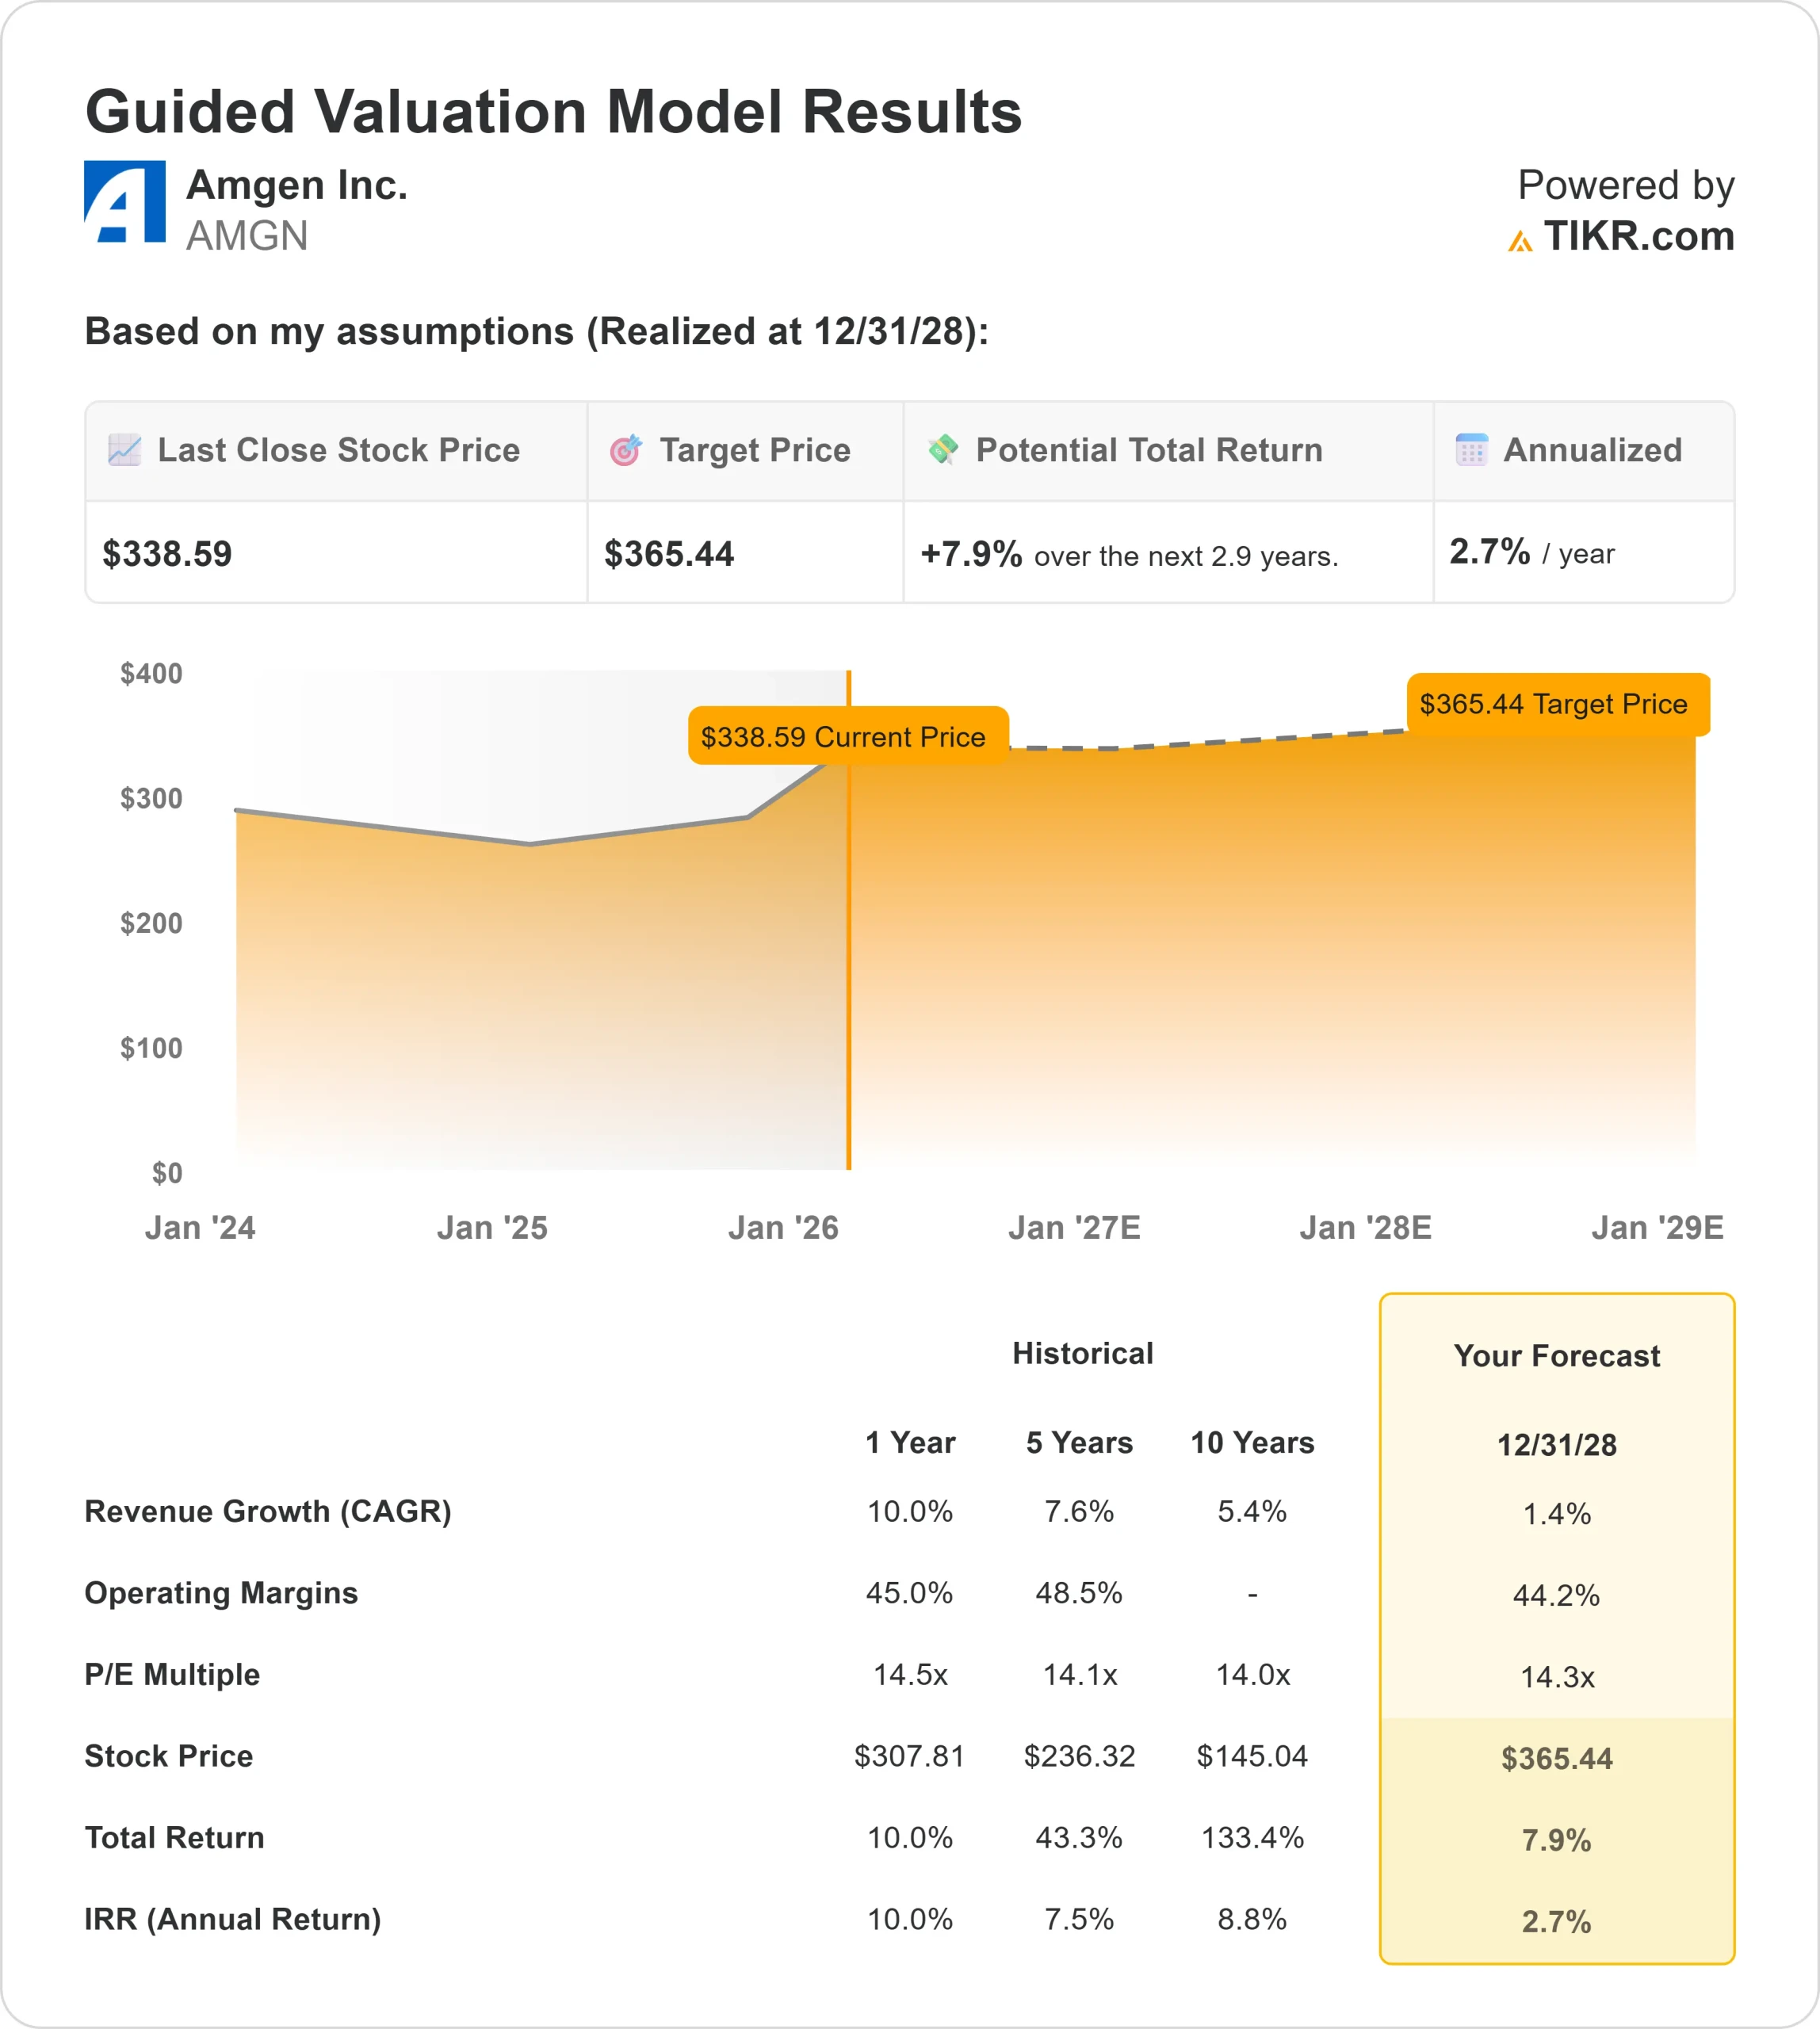
- Valuation Model Target Price: $365
- Implied Upside: 8% over 2.9 years
Value your favorite stocks like Amgen with 5 years of analysts’ forecasts using TIKR’s new Valuation Model (It’s free) >>>
What Happened?
Amgen Inc. stock declined about 4% over the past week, ending near $339, as shares pulled back following the company’s Q4 earnings release.
After a strong run into late January, investors locked in gains despite headline beats, signaling a reset in positioning rather than a deterioration in Amgen’s underlying business.
The stock moved lower because the earnings update confirmed strength but did not meaningfully raise expectations. Amgen reported Q4 revenue of about $9.9 billion, ahead of the $9.5 billion consensus, and adjusted EPS of $5.29, topping estimates of $4.73.
Management also issued 2026 adjusted EPS guidance of $21.60 to $23, above the Street’s $22.09 estimate, but the outlook largely aligned with what bullish investors were already pricing in, limiting incremental upside and triggering profit-taking after the recent rally.
Analyst reactions reflected that mixed takeaway. UBS raised its price target to $390 from $380 and reiterated a Buy rating, citing confidence in long-term earnings power.
BMO Capital Markets lifted its target to $372 from $335, pointing to improving odds for the obesity drug candidate MariTide, while Bernstein downgraded the stock to Market Perform and kept its $335 target unchanged, leaving the average Street target near $342 and keeping shares range-bound.
Institutional activity showed mixed conviction. Mediolanum International Funds increased its stake by 309.2%, while Atlantic Union Bankshares boosted its position by 66.3%, signaling selective accumulation.
At the same time, Principal Financial Group trimmed its stake by 1.3%, Wilkinson Global reduced its position by 13.9%, and United Community Bank cut its holdings by 55.4%, reflecting rebalancing rather than broad selling. Institutional investors still own about 76.5% of Amgen’s shares.
The week also brought a regulatory headline, with a nonprofit healthcare provider filing a lawsuit tied to the 340B Drug Pricing Program, seeking at least $7 million in damages after Amgen halted discounted drug sales.
Looking ahead, attention is shifting toward pipeline catalysts in obesity, oncology, and inflammation, where concrete clinical data and early commercial traction are likely to drive the next move rather than sentiment alone.
See analysts’ growth forecasts and price targets for Amgen (It’s free) >>>
Is Amgen Overvalued?
Under valuation assumptions, the stock is modeled using:
- Revenue Growth (CAGR): 1.4%
- Operating Margins: 44.2%
- Exit P/E Multiple: 14.3x

Revenue growth has been front-loaded, with a recent spike followed by expectations for low single-digit growth over the next several years.
The revenue outlook implies future performance depends more on execution from newer therapies than broad top-line acceleration.
Margins remain a clear strength, supported by Amgen’s scale and biologics manufacturing efficiency, but incremental upside depends on how effectively newer products ramp without increasing pricing pressure or launch costs.
Pipeline assets like MariTide carry meaningful long-term potential, though current valuation already assumes steady progress rather than upside surprises.
At current levels, Amgen appears overvalued relative to its expected growth trajectory, with the stock priced for durable cash flows but offering limited margin of safety.
Over the next year, performance is likely driven by tangible pipeline results and commercial execution rather than valuation re-rating, keeping upside constrained unless results materially exceed expectations.
Estimate a company’s fair value instantly (Free with TIKR) >>>
Value Any Stock in Under 60 Seconds (It’s Free)
With TIKR’s new Valuation Model tool, you can estimate a stock’s potential share price in under a minute.
All it takes is three simple inputs:
- Revenue Growth
- Operating Margins
- Exit P/E Multiple
From there, TIKR calculates the potential share price and total returns under Bull, Base, and Bear scenarios so you can quickly see whether a stock looks undervalued or overvalued.
If you’re not sure what to enter, TIKR automatically fills in each input using analysts’ consensus estimates, giving you a quick, reliable starting point.
See a stock’s true value in under 60 seconds (Free with TIKR) >>>