Key Stats for MPC Stock
- Year-to-Date Performance: 20%
- 52-Week Range: $115 to $210
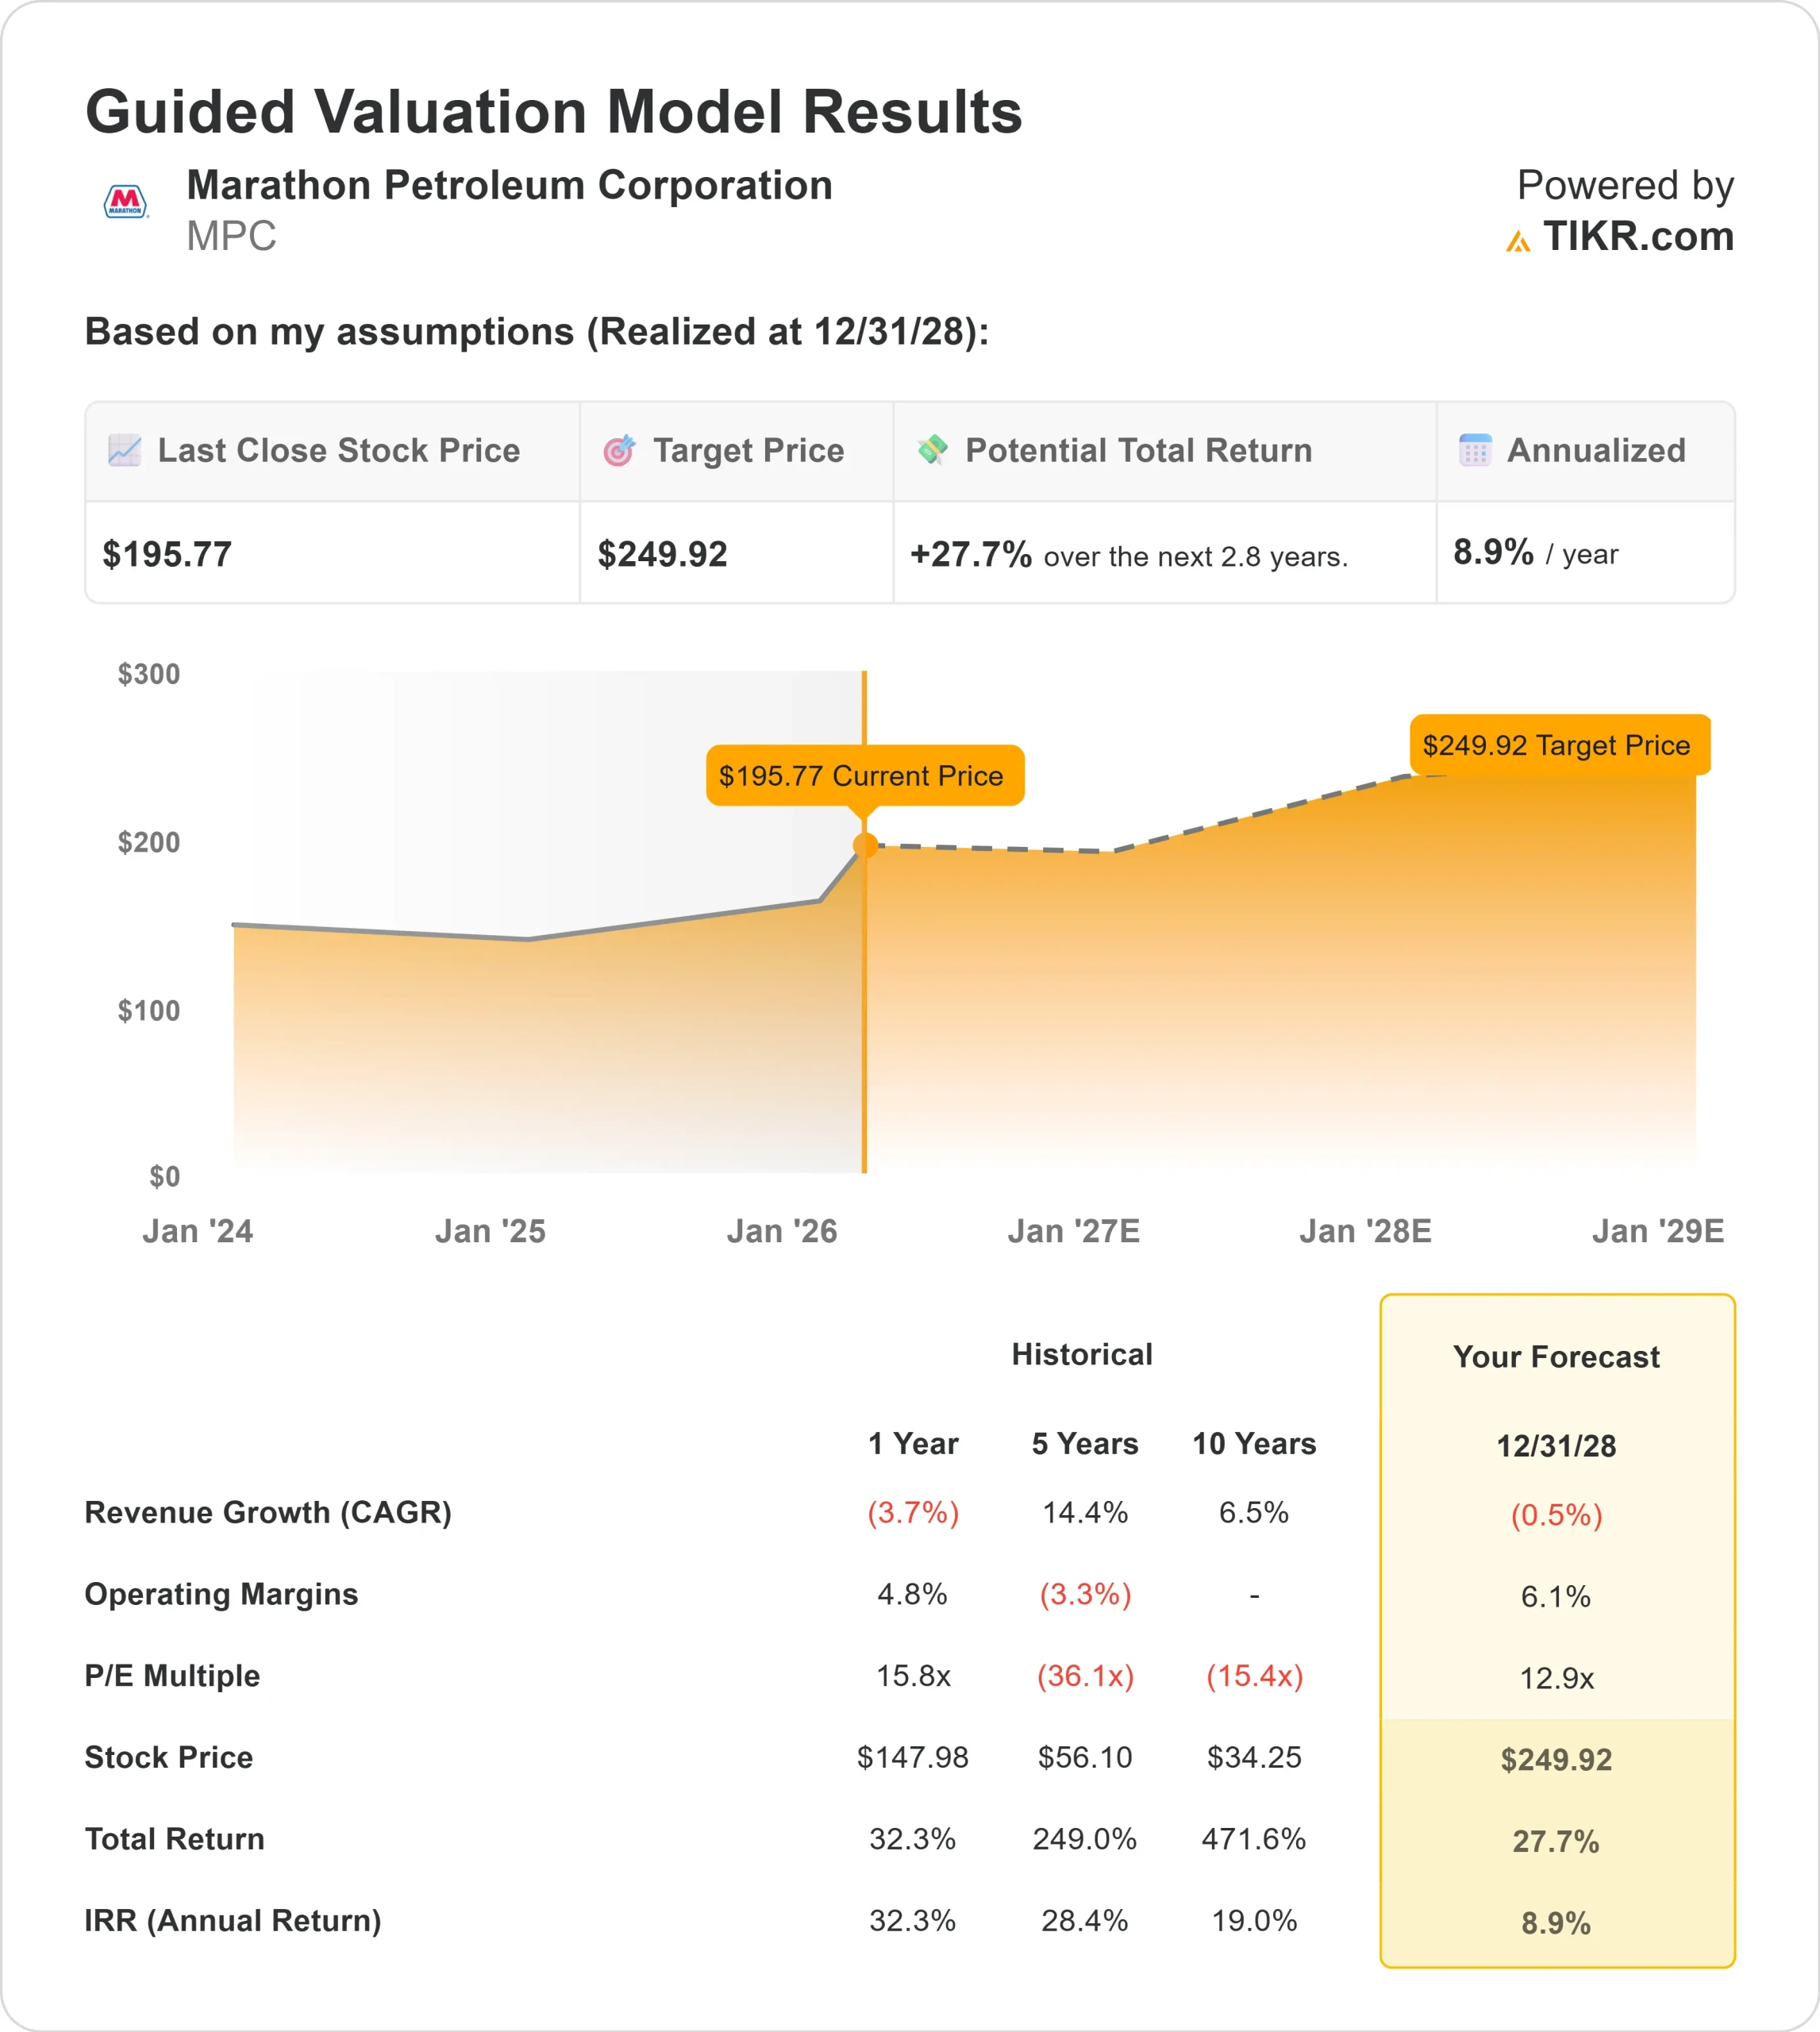
- Valuation Model Target Price: $250
- Implied Upside: 27.7%
Value your favorite stocks like Marathon Petroleum with 5 years of analysts’ forecasts using TIKR’s new Valuation Model (It’s free) >>>
What Happened?
Marathon Petroleum stock is up about 20% year to date, recently trading near $196 per share as investors responded to improving refining margins, strong capital returns, and renewed institutional positioning. Shares continue to trade near the upper end of their $115 to $210 52 week range, reflecting sustained momentum following earnings.
The stock moved higher after the company delivered stronger-than-expected fourth quarter results, including adjusted EPS of $4.07 and a 114% capture rate, signaling improved commercial execution and margin expansion.
Refinery utilization reached 95%, quarterly adjusted EBITDA totaled about $3.5 billion, and full-year EBITDA reached $12 billion.
Cash flow from operations excluding working capital totaled $8.7 billion in 2025, allowing management to return $4.5 billion to shareholders while reducing shares outstanding by 6.5%, reinforcing per-share earnings leverage.
CEO Maryann Mannen said MPC is “positioned to deliver industry-leading cash generation through all parts of the cycle,” highlighting record Midstream adjusted EBITDA of nearly $7 billion.
The company outlined roughly $700 million in refining capital investments for 2026, while MPLX announced $2.4 billion of growth capital with 90% directed toward Natural Gas and NGL projects, supporting more than $3.5 billion of expected cash distributions to MPC over the next two years.
Institutional activity has also reinforced sentiment. Journey Advisory Group increased its stake by 634.9% to 55,073 shares, ING Groep NV raised its position by 52% to 61,242 shares, and GF Fund Management increased its stake by 8.7% to 73,448 shares.
New positions were opened by Alberta Investment Management Corp, Caprock Group, and Calton & Associates, while Vanguard trimmed its stake by 1.3% to 38.3 million shares.
Overall institutional ownership remains near 76.8%, suggesting continued long-term support despite selective profit-taking.
See analysts’ growth forecasts and price targets for Marathon Petroleum (It’s free) >>>
Is MPC Undervalued?
Under valuation assumptions, the stock is modeled using:
- Revenue Growth (CAGR): (0.5%)
- Operating Margins: 6.1%
- Exit P/E Multiple: 12.9x
Revenue expectations reflect normalization after elevated post-pandemic refining margins, but margin durability and capital allocation discipline remain the primary value drivers.
Capture improved to 114% in the fourth quarter, demonstrating how commercial execution and integrated logistics can lift profitability even without meaningful top-line growth.

Refining optimization projects at Garyville and El Paso are designed to increase crude throughput, improve product yields, and enhance export flexibility, targeting returns of 25% or higher.
At the same time, MPLX growth capital concentrated in the Permian and Marcellus supports more than $3.5 billion of expected cash distributions to MPC over the next two years, reinforcing free cash flow stability.
Crack spreads, sour crude differentials, and refinery utilization remain central to 2026 results. Sustained capture above 100% and continued capital intensity reductions into 2027 and 2028 strengthen through-cycle cash generation.
Based on these inputs, the model estimates a target price of $250, implying about 27.7% total upside at current levels near $196.
At current levels, Marathon Petroleum appears modestly undervalued, with future performance driven primarily by refining margin resilience, integrated system optimization, and disciplined capital returns rather than aggressive revenue growth.
Estimate a company’s fair value instantly (Free with TIKR) >>>
Value Any Stock in Under 60 Seconds (It’s Free)
With TIKR’s new Valuation Model tool, you can estimate a stock’s potential share price in under a minute.
All it takes is three simple inputs:
- Revenue Growth
- Operating Margins
- Exit P/E Multiple
From there, TIKR calculates the potential share price and total returns under Bull, Base, and Bear scenarios so you can quickly see whether a stock looks undervalued or overvalued.
If you’re not sure what to enter, TIKR automatically fills in each input using analysts’ consensus estimates, giving you a quick, reliable starting point.
See a stock’s true value in under 60 seconds (Free with TIKR) >>>