
Key Takeaways for lululemon athletica Stock as of August 2026
- YTD Collapse: lululemon athletica (LULU) stock has fallen 43% since the start of 2026, a 60% annualized pace that has pulled shares to $120 by the August 13 close.
- Model Ceiling: TIKR’s mid-case model puts a $148 target on LULU stock, implying a 24% total return (5% annualized) by January 2031, a slow grind back rather than a snapback to prior highs.
- Margin Squeeze: Fiscal first-quarter gross margin fell 410 basis points to 54.2%, with tariffs alone cutting 280 basis points, and full-year EPS guidance now sits at $10.95 to $11.15, down from $13.26 in fiscal 2025.
- Cheap But Not Growing: LULU now trades at 10.81x forward earnings, yet TIKR’s own forecast has the company’s two-year forward EPS shrinking 7.9%, so the multiple compression and the estimate cuts are running in the same direction.
Track lululemon athletica’s next moves and build your own model of the recovery on TIKR for free
Why lululemon Stock’s Three Charts Tell Three Different Stories
lululemon athletica (LULU) stock is down 43% since the start of 2026, a 60% annualized pace that has pulled shares to $120 as of the August 13 close. But the drop doesn’t look the same at every distance, and each window explains a different piece of what broke.

The year-to-date chart shows a stock that held up reasonably well into spring before falling off a cliff. That break lines up with the June 4 fiscal first-quarter call, where Interim Co-CEO and CFO Meghan Frank laid out the mechanics directly: “there are 2 key factors impacting our trend. First, we experienced spikes of negative commentary in the media and on social channels with regard to our brand, which had an impact on traffic and overall top line performance. And second, not all of our product launches have met our expectations.” North American comparable sales fell 6% in the quarter even as China Mainland grew 30%, so the damage was concentrated, not company-wide.
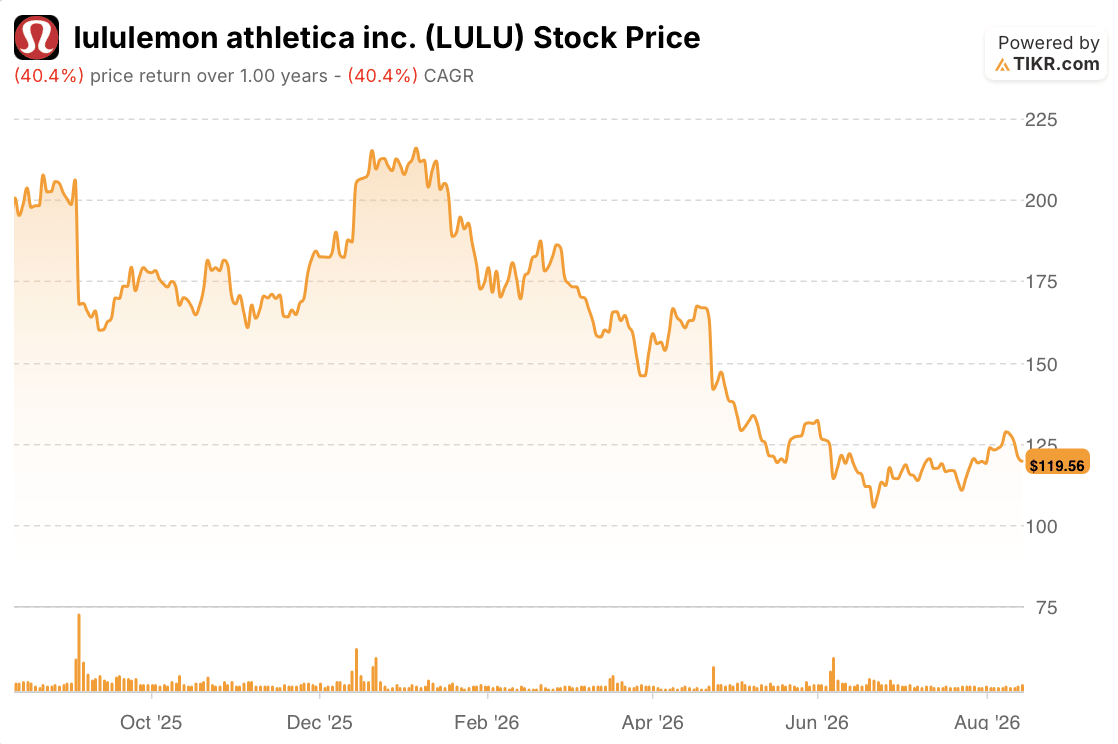
Stretch the window to a year and the decline reads as 40%, and the extra months add the financial mechanics behind the brand story. Gross margin fell 410 basis points to 54.2% in the fiscal first quarter, with tariffs alone responsible for 280 basis points of that hit. Full-year diluted EPS guidance now sits at $10.95 to $11.15, down from $13.26 in fiscal 2025, so the one-year chart captures a business absorbing tariff costs and a guidance reset at the same time, not just a single bad quarter.

Widen out to three years and the drop is 68%, a 31% annualized pace, and this is where the story stops being about any one earnings call. lululemon has been losing its growth premium since 2023, and this year’s brand and product missteps landed on a stock that was already re-rating lower. A new CEO, Heidi O’Neill, arrives in September to run the turnaround, inheriting a business leadership itself describes as facing a trust problem rather than a demand problem.
The Street’s own repositioning backs up that read, and it’s been steep.

A year ago, on August 3, 2025, the mean analyst target on LULU stock stood at $291, backed by 14 buys, 2 outperforms, and just 3 sells, a genuinely bullish book.
A year ago, on August 3, 2025, the mean analyst target on LULU stock stood at $291, backed by 14 buys, 2 outperforms, and just 3 sells, a genuinely bullish book. That target has been cut in four of the last five updates since, sliding to $194 in November, rebounding briefly to $209 in February, then falling to $181 in May, $132 in June, and now $128 as of August 13, just 7% above the current $120 price.
The ratings mix collapsed just as fast: today’s book carries 1 buy, 29 holds, 1 underperform, and 3 sells, with outperform ratings gone entirely. Analysts haven’t been calling a bottom here, they’ve been cutting the target in step with the falling price, and the shrinking gap between target and close (107% today versus 150% a year ago) shows a Street that spent the past twelve months capitulating alongside the stock rather than getting ahead of it.
TIKR Values lululemon Stock at $148, Pricing In a Slow Grind Back
TIKR’s mid-case model values lululemon athletica at $148 by January 2031, implying a 24% total return from the current price of $120, or 5% annualized over the next 4.5 years.

A 5% annualized path is a modest recovery premium, not a bet on lululemon reclaiming its old growth multiple, and it sits well below the returns the stock delivered in its prior high-growth years. The model’s restraint tracks with what management described on the June 4 call: a business absorbing self-inflicted brand and product missteps on top of tariff-driven margin compression, working through a leadership transition, with full price sales not expected to turn consistently positive until later in the year.
It also tracks with where the Street sits right now, a $128 mean target offering little more upside than TIKR sees over the next year alone, which leaves both the quick read and the long model in agreement that this is a repair job, not a re-rating.
Should You Invest in lululemon athletica inc.?
The only way to really know is to look at the numbers yourself. TIKR gives you free access to the same institutional-quality financial data that professional analysts use to answer exactly that question.
Pull up lululemon athletica inc. stock and you’ll see years of historical financials, what Wall Street analysts expect for revenue and earnings in the quarters ahead, how valuation multiples have moved over time, and whether price targets are trending up or down.
You can build a free watchlist to track lululemon athletica inc. alongside every other stock on your radar. No credit card required. Just the data you need to decide for yourself.
Access Professional Tools to Analyze LULU stock on TIKR for Free →
Looking for New Opportunities?
- See what stocks billionaire investors are buying so you can follow the smart money.
- Analyze stocks in as little as 5 minutes with TIKR’s all-in-one, easy-to-use platform.
- The more rocks you overturn… the more opportunities you’ll uncover. Search 100K+ global stocks, global top investor holdings, and more with TIKR.
Disclaimer:
Please note that the articles on TIKR are not intended to serve as investment or financial advice from TIKR or our content team, nor are they recommendations to buy or sell any stocks. We create our content based on TIKR Terminal’s investment data and analysts’ estimates. Our analysis might not include recent company news or important updates. TIKR has no position in any stocks mentioned. Thank you for reading, and happy investing!