Key Stats for LIFE360 Stock
- Past-Week Performance: -16%
- 52-Week Range: $9 to $37
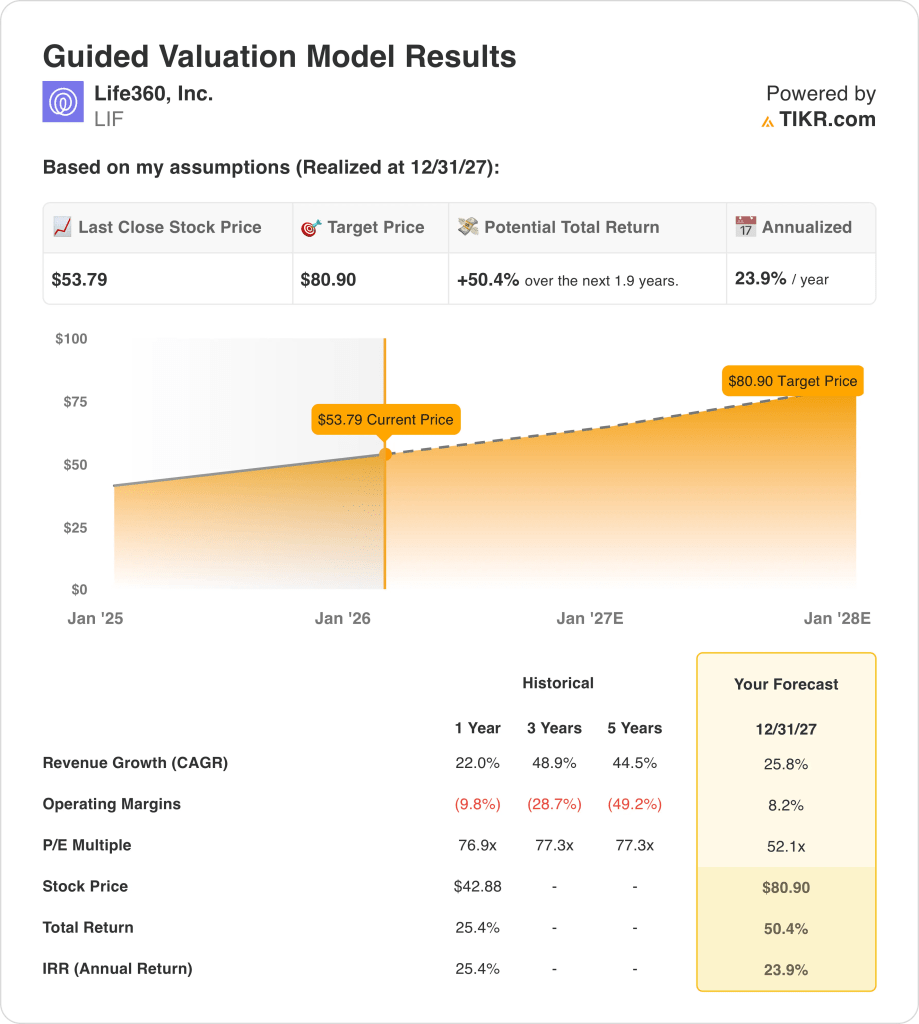
- Valuation Model Target Price: $81
- Implied Upside: 50% over 1.9 years
What Happened to LIF Stock?
Life360 (LIF) stock fell 16% over the past week, trading with elevated volatility as the stock consolidated after failing to sustain sharp gains recorded during the late-January rally.
January 23 disclosures framed trading during the period, as Life360 released preliminary Q4 and full-year 2025 results that exceeded prior guidance and consensus expectations.
LIife360 reported 95.8 million monthly active users in Q4, full-year net additions of 16.2 million, and projected $486–489 million in 2025 revenue, representing 31–32% year-over-year growth.
The company also highlighted record subscriber momentum, with 576,000 net Paying Circle additions in 2025 and improving conversion rates from newly acquired users into paid plans.
Despite these disclosures, market participants appeared to emphasize the stock’s late-January intraday peak of roughly 30% gains, rather than incremental updates during subsequent trading sessions.
As a result, shares did not extend higher, as expectations had already incorporated upgraded revenue guidance, record user growth, and improved monetization metrics following the preliminary results release.
No additional analyst revisions, regulatory filings, or governance developments occurred during the week beyond the previously disclosed operating update and the scheduled March earnings call.
Overall, the week’s trading reflected post-earnings repositioning after the rally, while Life360’s growth outlook, margin trajectory, and strategy remained unchanged.
Before reading further, model Life360’s user growth and cash flow path on TIKR for free →
Is LIF Stock Fairly Valued Right Now?
Under the valuation model shown, the stock is modeled using:
- Revenue Growth: 25.8%
- Operating Margins: 8.2%
- Exit P/E Multiple: 52.1x
Life360’s valuation model is supported by a clear operating inflection, with revenue expanding from $113 million in 2021 to an estimated $964 million by 2029, implying roughly 31% compound growth.
Revenue growth remains front-loaded, with 31–36% expansion through 2026 before moderating to around 20% by 2027 and high-teens growth as the user base matures.
Profitability has already crossed a key threshold, as EBITDA turned positive in 2023 and scales toward more than $230 million by 2029.
EBITDA margins expand structurally from negative levels in 2022 to the mid-20% range by 2028 as subscription mix improves and fixed costs are absorbed.
Operating leverage becomes evident below EBITDA, with EBIT turning positive in 2025 and rising toward approximately $110 million by 2028.
Free cash flow reinforces the model’s durability, increasing from $5 million in 2023 to more than $125 million by 2026 and peaking near $270 million by 2028.
Although margins and net income compress modestly beyond 2028 as growth normalizes, the trajectory reflects scale effects rather than execution slippage.
Accordingly, Life360 stock appears undervalued, as the current share price discounts a slower profitability and cash flow ramp than the operating trajectory embedded in the model.
Revenue is growing fast and margins are improving. Test how that plays out in Life360’s valuation on TIKR for free →
Value Any Stock in Under 60 Seconds (It’s Free)
With TIKR’s new Valuation Model tool, you can estimate a stock’s potential share price in under a minute.
All it takes is three simple inputs:
- Revenue Growth
- Operating Margins
- Exit P/E Multiple
From there, TIKR calculates the potential share price and total returns under Bull, Base, and Bear scenarios so you can quickly see whether a stock looks undervalued or overvalued.
If you’re not sure what to enter, TIKR automatically fills in each input using analysts’ consensus estimates, giving you a quick, reliable starting point.