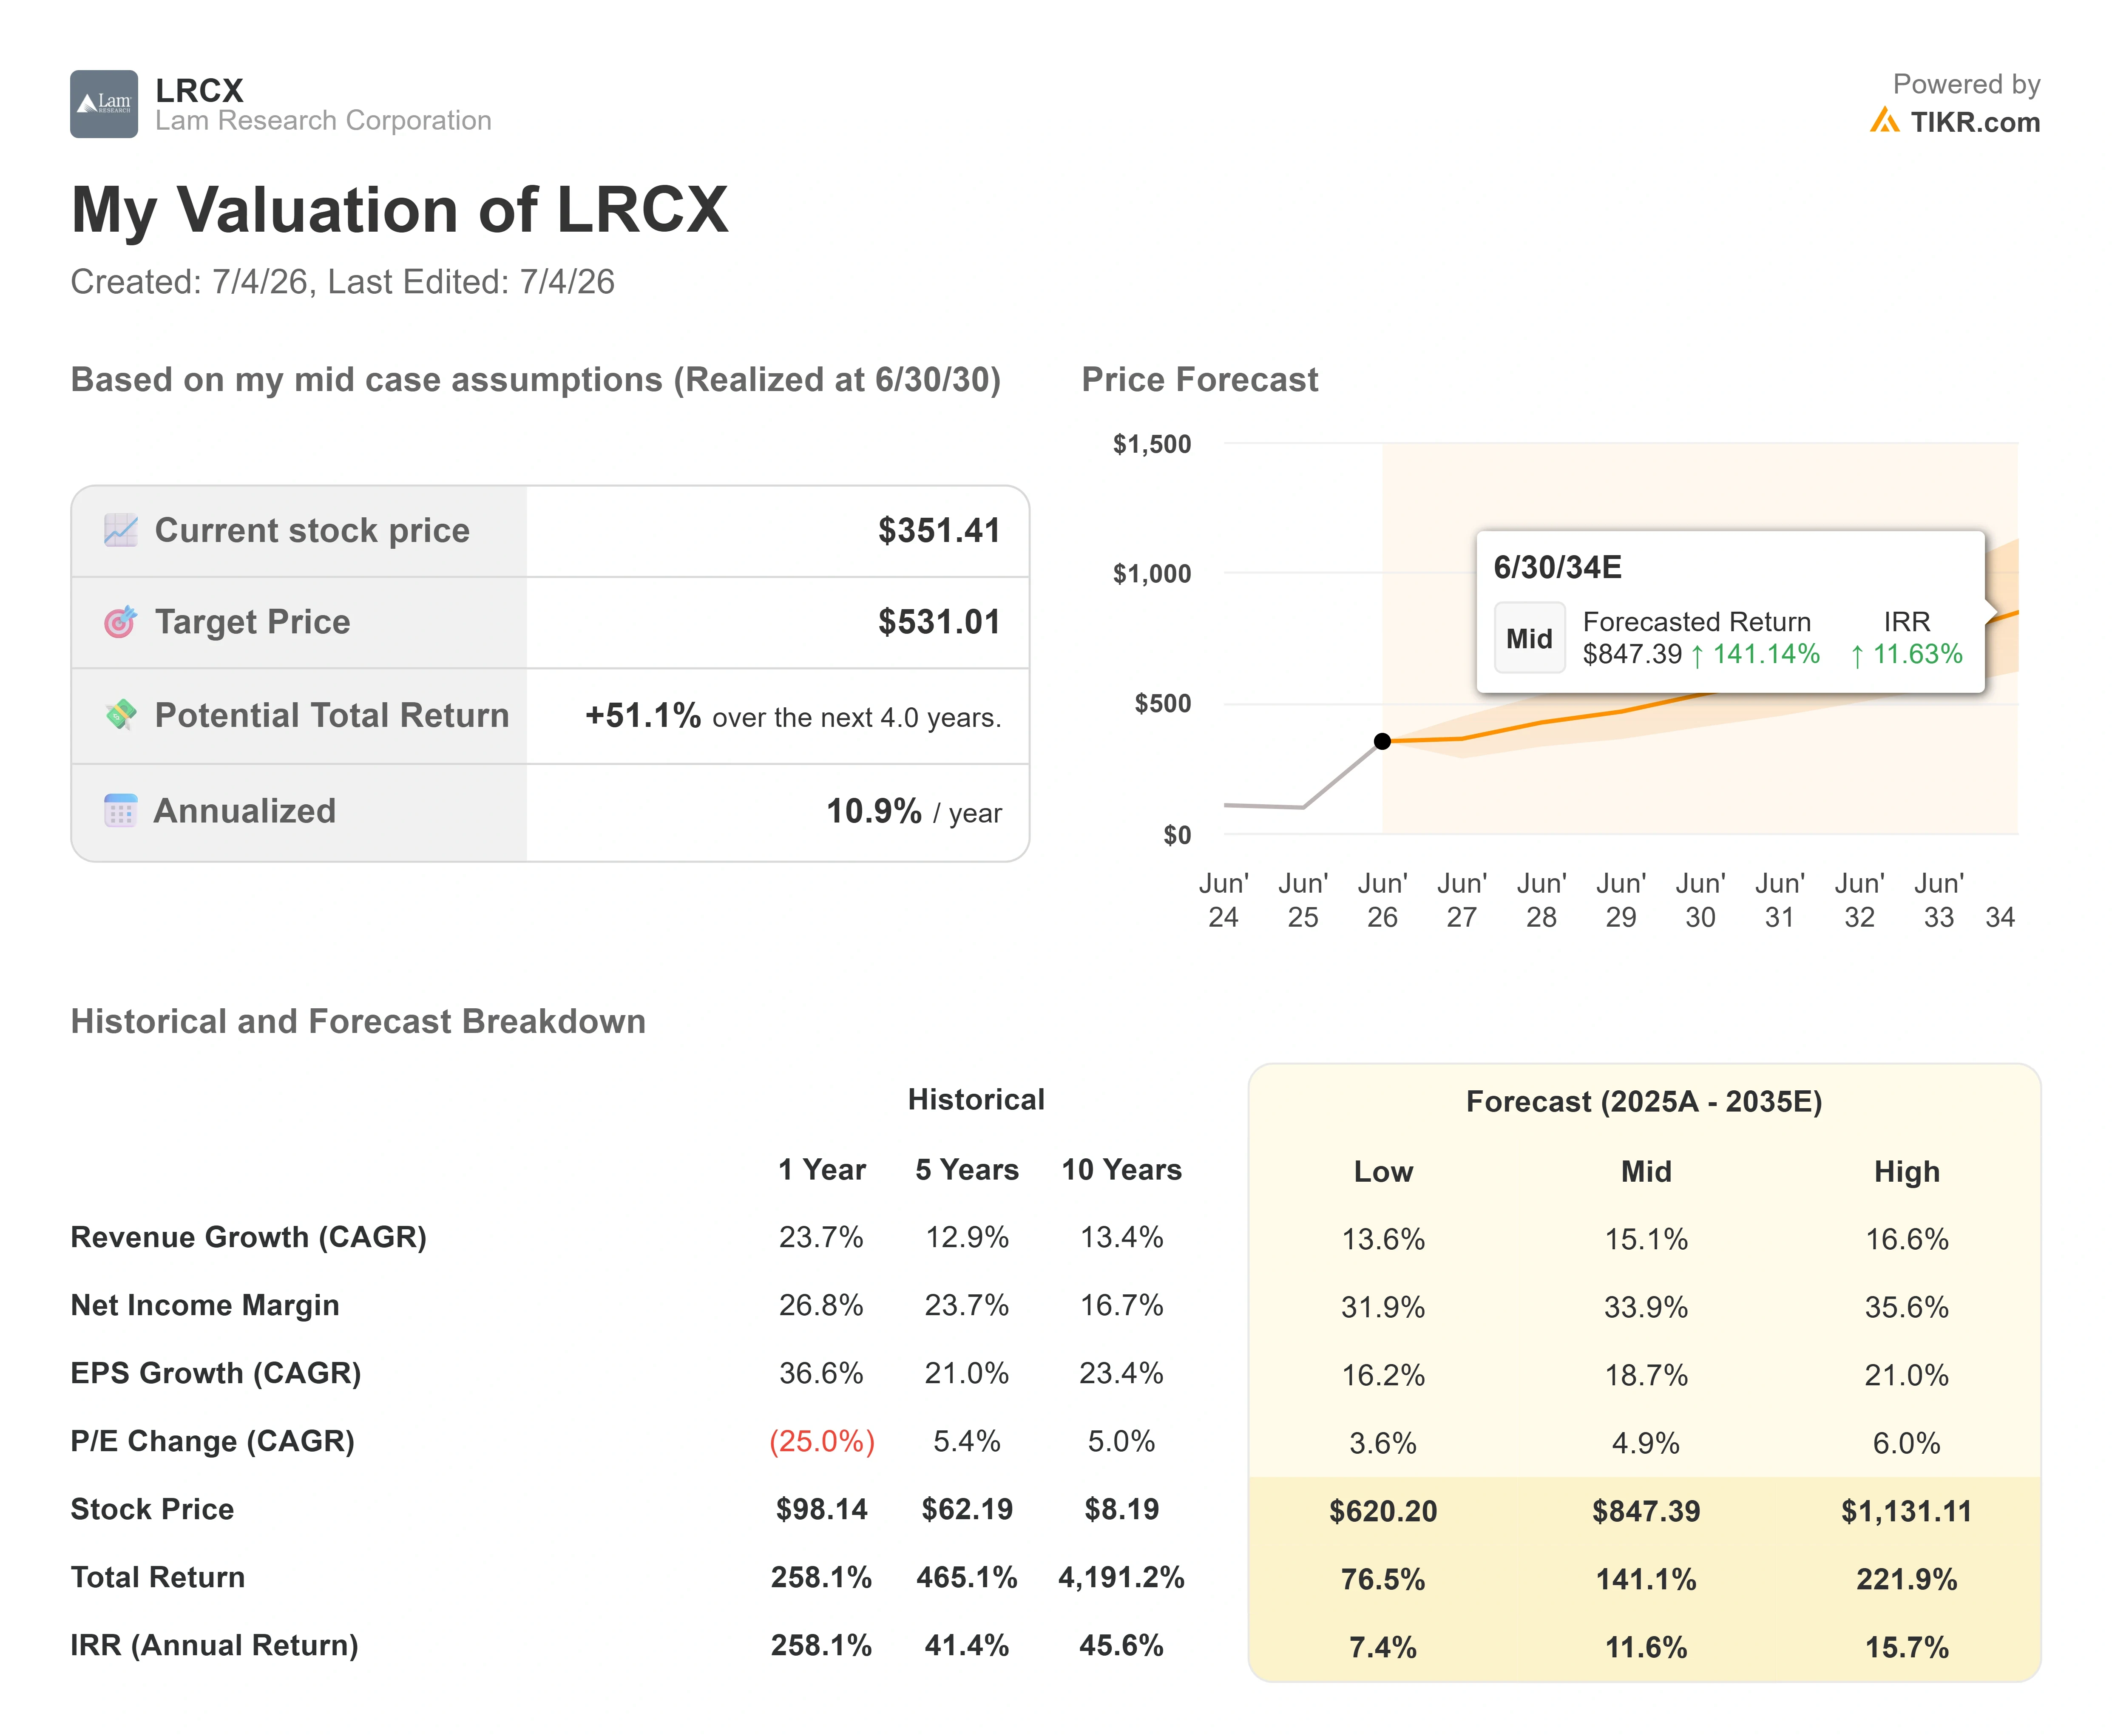
Key Stats for Lam Research Stock
- Current Price: $351.41
- Target Price (Mid): ~$531
- Street Target: ~$346
- Potential Total Return: ~51%
- Annualized IRR: ~11% / year
- Max Drawdown: -20.10% (March 6, 2026)
Now Live: Discover how much upside your favorite stocks could have using TIKR’s new Valuation Model (It’s free) >>>
What Happened?
Lam Research Corporation (LRCX) lost $39.85 in a single session on July 2, closing at $351.41, a 10.19% drop. Nothing changed at the company that day. What changed was the market’s story about the entire semiconductor equipment group.
The selloff hit every wafer fabrication equipment name, the machinery chipmakers use to build semiconductors. Teradyne fell about 14%, KLA about 12%, Applied Materials about 7%, and Axcelis nearly 19% the same day. The trigger was a fear that AI infrastructure spending is closer to a peak than a floor, and after a first half where LRCX had roughly doubled, a crowded trade unwound fast.
Here is the tension worth sitting with. One month before this drop, Lam’s own CFO described demand as the strongest he had seen in his career.
What Actually Triggered the Drop
The chip weakness started the day before. On July 1, Bloomberg News reported that Meta was building a cloud business to sell excess AI computing capacity, which investors read as a sign that even the biggest AI spenders may have overbuilt. That worry carried into July 2 and hit the equipment group hardest, as analysts flagged the risk that WFE orders themselves may be slowing. A soft June jobs report added to the rotation, pushing money out of high-multiple names into defensives.
Sitting underneath all of it was a memory scare from the prior week. In late June, reports that SK Hynix would slow its next-generation high-bandwidth memory (HBM4) ramp, the stacked DRAM that feeds AI accelerators, to chase richer conventional DRAM margins, had already rattled the memory supply chain. By July 2, that context amplified every capex-slowdown headline.
LRCX, up about 154% in the first half of 2026, had the most air to give back. The problem is that this slowdown narrative sits awkwardly against what management has actually said.

See historical and forward estimates for Lam Research stock (It’s free!) >>>
The BofA Says the Opposite
At the Bank of America 2026 Global Technology Conference on June 2, Douglas Bettinger, Chief Financial Officer, did not describe a demand problem. He described a supply problem. As he put it, the industry is “constrained by clean room space availability,” not by a shortage of orders. That is the inverse of a capex-slowdown thesis, because it means the ceiling on 2026 revenue is physical space, not customer appetite.
Bettinger went further on visibility. He said the depth of multi-year customer conversations is “as strong as I’ve ever seen it, frankly, in all the time I’ve been in the industry.” For an executive he himself describes as conservative, that is an unusually direct statement. He also argued the constraint pushes demand forward rather than destroying it, saying “this is going to roll into next year” as projects free up, and setting up what he expects to be a strong 2027.
None of that guarantees the bulls are right. It does mean the July 2 selloff priced in a slowdown that the company’s most recent commentary does not support. That gap between price and message is the setup.
Why Lam Is Less Memory-Exposed Than the Selloff Assumes
The market treated LRCX as a memory proxy on July 2. The business no longer fits that label cleanly. Bettinger noted that foundry made up 54% of systems revenue last quarter and 59% the quarter before, so the leading-edge logic build (gate-all-around transistors, backside power, advanced packaging) now drives more of the systems mix than memory does.
His structural argument is that everything at the leading edge is moving into three dimensions, and that plays to Lam’s core. In his words, “when things inflect in the third dimension, etch and deposition intensity grows. That’s all we do.” Lam owns the through-silicon via (TSV) step that stitches HBM stacks together, so even within memory, its content rises as die counts climb “from 8 to 12 to 16 die.” A pause in one memory maker’s HBM4 ramp does not erase that content growth.
There is also a recurring-revenue cushion the selloff ignored. The Customer Support Business Group, which sells spares, service, and upgrades, generated $2.1 billion in revenue last quarter, up 25% year over year. Bettinger called it “my favorite part of the business model” because fabs running near 100% utilization consume spares and service regardless of new tool orders.
Valuation: Rich, But No Longer Priced for Perfection
Even after the drop, LRCX is not cheap, and pretending otherwise would be dishonest. On EV/EBITDA, the stock trades near 40x on a next-twelve-months basis, against roughly 35x for Applied Materials and 36x for ASML, though slightly below KLA at about 41x. The premium to Applied Materials and ASML is real. The question is whether Lam’s higher exposure to etch and deposition intensity, the parts of the process growing fastest as chips go 3D, justifies paying up.
That case is defensible but not free. Lam earns a 50.0% gross margin and a 66.8% return on equity, and it has beaten consensus every quarter for over a year, most recently posting April-quarter revenue of $5.841 billion, up 24% year over year. A business compounding at that rate with that profitability can carry a premium multiple. What it cannot carry is a multiple that assumes nothing ever goes wrong, which is roughly where LRCX sat before July 2.
The drop matters here. Before the selloff, the stock traded well above where a conservative model could justify it. At $351.41, it now sits just above the mean Street target of around $346, so the market has repriced from euphoria back toward consensus. The risk is genuine: WFE is cyclical, China exposure and export controls remain a swing factor, and a real slowdown in memory capex would hit orders. The counterweight is that the selloff already discounted a version of that fear.

See how Lam Research performs against its peers in TIKR (It’s free!) >>>
TIKR Advanced Model Analysis
- Current Price: $351.41
- Target Price (Mid): ~$531
- Potential Total Return: ~51%
- Annualized IRR: ~11% / year
See analysts’ growth forecasts and price targets for Lam Research stock (It’s free!) >>>
This uses the mid-case because it lines up with management’s own framing: strong but supply-gated growth, not a boom that assumes no constraints. The model runs on a revenue CAGR of around 15% through 2030, driven by two engines Bettinger described directly: expanding etch and deposition intensity as chips move to 3D structures, and Lam’s rising share of WFE spending, which management says has already climbed from the low 30% range to the mid-30s with a path toward the high 30s. The margin driver is Lam’s net income margin, holding near 34%, supported by factory efficiency and pricing discipline, as reported margins sit around the low 50s.
The primary risk is WFE cyclicality. If memory capex genuinely slows rather than shifts into 2027, orders soften and the multiple compresses at the same time, a double hit. The upside case: constraints ease, 2027 spending accelerates as Bettinger expects, and Lam holds share, driving the stock toward the mid-case target. The downside case: a real capex slowdown validates the July 2 fear, earnings estimates come down, and a premium multiple resets lower from here.
Conclusion
The July 2 drop was a sector story, not a company story, so the resolution comes from company data. Mark July 29, 2026, Lam’s Q4 fiscal 2026 earnings date. Skip the EPS line, since Lam beats it routinely. Watch June-quarter revenue against management’s roughly $6.6 billion guide.
At or above that figure, and Bettinger’s “clean room constrained, not demand constrained” story gets confirmed with hard numbers, which would make the July selloff look like the overreaction the BofA transcript implies. Meaningfully below $6.2 billion, and the capex-slowdown bears earn their thesis, because it would suggest orders are slipping rather than merely shifting into 2027. One date settles which signal was real: the tape on July 2, or the CFO on June 2.
See what stocks billionaire investors are buying so you can follow the smart money with TIKR.
Should You Invest in Lam Research?
The only way to really know is to look at the numbers yourself. TIKR gives you free access to the same institutional-quality financial data that professional analysts use to answer exactly that question.
Pull up Lam Research, and you’ll see years of historical financials, what Wall Street analysts expect for revenue and earnings in the quarters ahead, how valuation multiples have moved over time, and whether price targets are trending up or down.
You can build a free watchlist to track Lam Research alongside every other stock on your radar. No credit card required. Just the data you need to decide for yourself.
Analyze Lam Research on TIKR Free →
Looking for New Opportunities?
- See what stocks billionaire investors are buying so you can follow the smart money.
- Analyze stocks in as little as 5 minutes with TIKR’s all-in-one, easy-to-use platform.
- The more rocks you overturn… the more opportunities you’ll uncover. Search 100K+ global stocks, global top investor holdings, and more with TIKR.
Disclaimer:
Please note that the articles on TIKR are not intended to serve as investment or financial advice from TIKR or our content team, nor are they recommendations to buy or sell any stocks. We create our content based on TIKR Terminal’s investment data and analysts’ estimates. Our analysis might not include recent company news or important updates. TIKR has no position in any stocks mentioned. Thank you for reading, and happy investing!