
Key Stats for JPM Stock
- Past week performance: -2.6%
- 52-week range: $279 to $367
- Valuation model target price: $406
- Implied upside: 18.4% over 2.3 years
Stress-test JPMorgan’s earnings power with 5 years of analyst forecasts TIKR’s new Valuation Model (It’s free) >>>
Record Profits Meet a Nervous Rate Market
JPMorgan Chase (JPM) shares slipped about 2.6% over the past week, closing Friday at $343. The pullback had little to do with the bank itself. Instead, financial stocks fell as the benchmark Treasury yield touched a 19-year high and the yield curve flattened. A flatter curve means short-term and long-term rates move closer together, and that can squeeze what banks earn on lending.
Company news was mostly constructive. Chase began rolling out its Data Security Center, which lets app users see and cut off fintech apps linked to their accounts. JPMorgan is also reportedly in talks to lead about $3.8 billion of construction financing for a Manhattan condo tower. So the bank keeps landing the biggest deals, even as its stock cools.
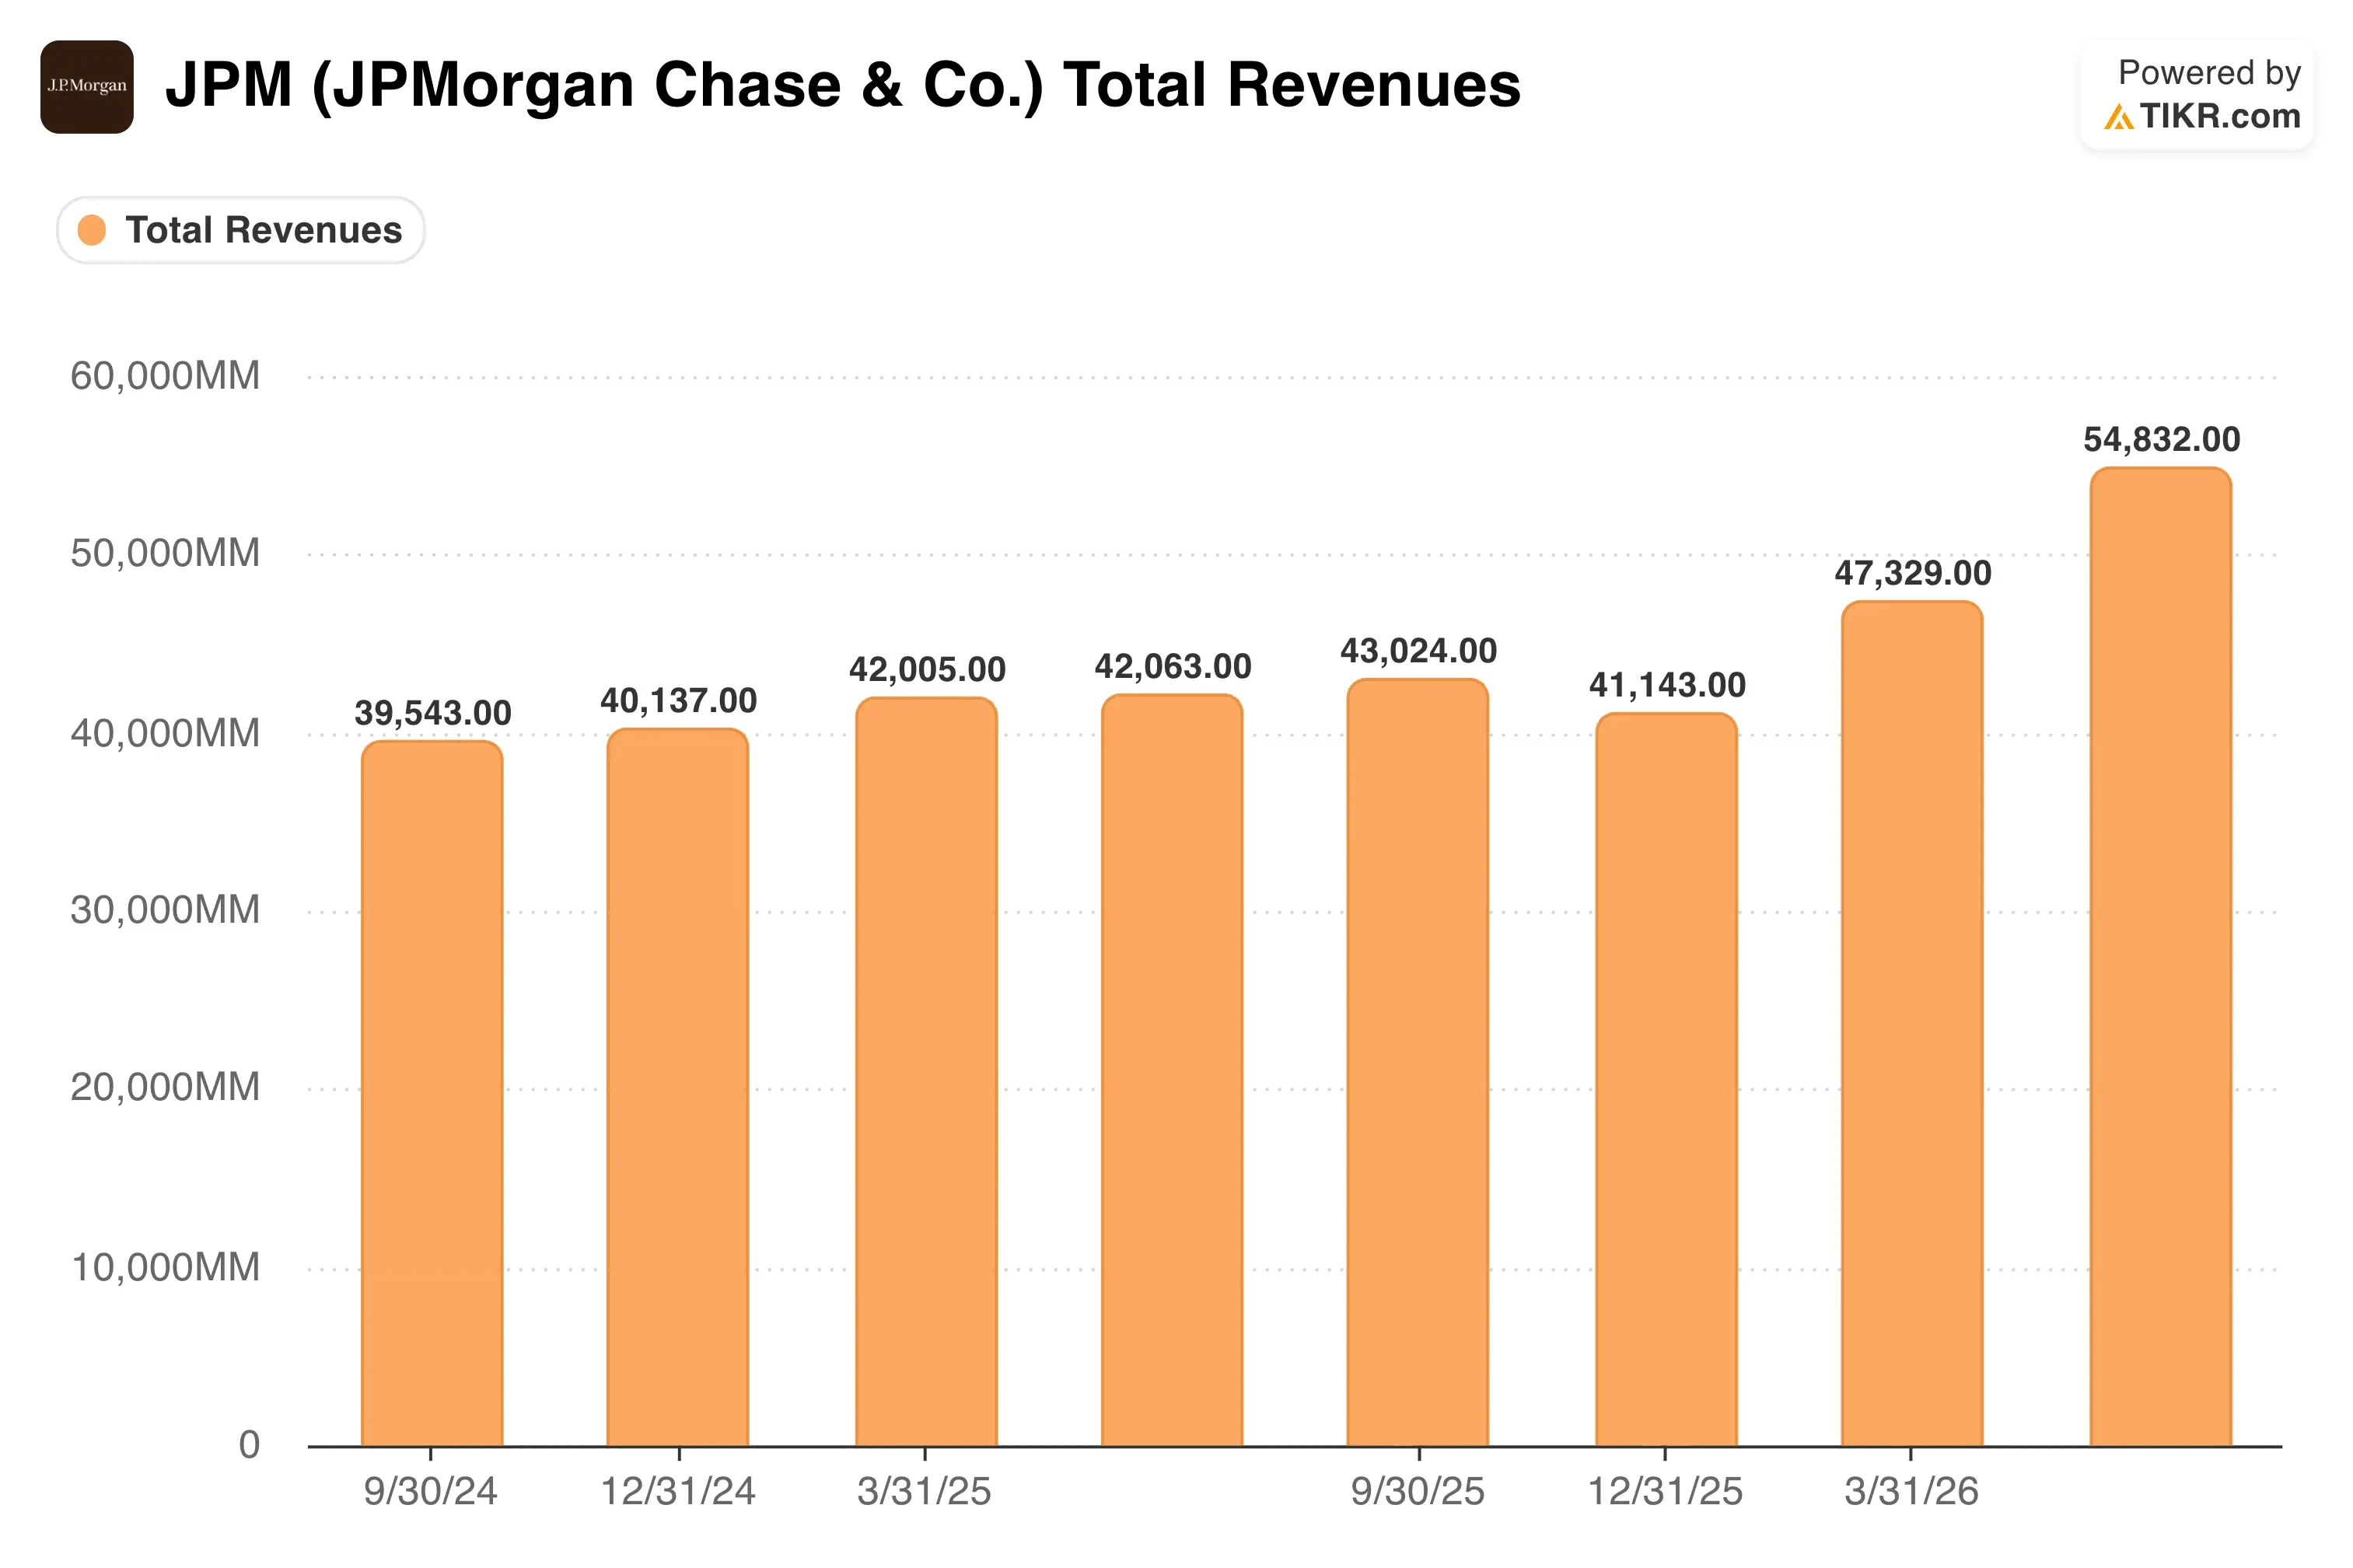
The backdrop is a very strong 2026. In Q2, JPMorgan earned $16.9 billion excluding one-time items, and markets revenue jumped 35%. Still, CEO Jamie Dimon sounded cautious on the July earnings call. “It’s getting close to as good as it gets,” he told analysts. “We just don’t know how long it’s going to last.”
That tension defines the investor mood. Buyers respect the earnings machine, but many wonder how much upside remains after a record run. If JPM stock is going to break back above $367, Q3 results in October must show that trading and dealmaking strength can last.
Track Wall Street’s price targets for JPMorgan before Q3 earnings land (It’s free) >>>
A Premium Bank at a Fair Price

Under valuation model assumptions realized through 12/31/28, the stock is modeled using:
- Revenue Growth (CAGR): 6.9%
- Operating Margins: 47.2%
- Exit P/E Multiple: 13.4x
Based on these inputs, the model estimates a target price of $406, implying an 18.4% total return from the current share price of $343 and an annualized return of 7.7% over the next 2.3 years.
This is a quality story, not a bargain story. JPMorgan trades at about 14.4x earnings, above its 5-year average of 12.5x. So the model assumes the multiple drifts back toward 13.4x by 2028, and that trims the upside.

Revenue assumptions look reasonable. A 6.9% growth rate matches the bank’s 10-year average and sits between last year’s 2.8% and the 5-year pace of 8.8%. Management expects about $103 billion of net interest income in 2026, which is the profit a bank earns between what it charges borrowers and pays depositors. In July, it also raised its outlook for that income excluding trading to $96.5 billion.
Margins are the stronger pillar. The 47.2% operating margin sits just below last year’s 48.3% but above the 5-year average of 44.2%. That cushion matters because the bank expects roughly $107.5 billion of adjusted expenses this year while it invests in technology and AI.
A 7.7% annual return falls below the 10% bar that makes a stock compelling. Citigroup (C), by comparison, earned a 13.0% return on tangible equity in Q2, far below JPMorgan’s 23%. That gap justifies a premium, yet the premium already looks fully priced.
Build your own JPMorgan bull, base, and bear case in under a minute (Free with TIKR) >>>
Why JPMorgan Still Sets the Pace Among Big Banks
Return on tangible common equity, or ROTCE, shows how much profit a bank earns on shareholders’ core capital. Analysts treat it as the single best scorecard for bank quality. JPMorgan posted 23% in Q2 excluding one-time items, and that remains the industry benchmark.
Wells Fargo (WFC) is the most improved rival. Its ROTCE climbed to 17.7% from 15.2% a year earlier, and it bought back $3.0 billion of stock in the quarter. However, its 10.3% CET1 ratio, a key measure of capital strength, trails JPMorgan’s 14.1%. That extra capital gives JPMorgan more room to lend, repurchase shares, or absorb losses.
Bank of America (BAC) delivered 17.0% ROTCE on $31.6 billion of Q2 revenue. Citigroup posted 13.0%, although its net income rose 45% as its turnaround gained traction. Both banks are improving, yet both remain well behind JPMorgan on profitability.
Scale is JPMorgan’s moat. Its deposit base, trading desks, and investment bank let it spread technology costs across a larger revenue pool. The risk is that rivals keep closing the gap, which would make the valuation premium harder to defend.
What’s Driving JPM Stock Going Forward?
Q3 earnings in October are the next major test. Investors will watch whether trading and investment banking can stay near Q2 levels, when banking fees jumped 30%. Meanwhile, the quarterly dividend rises to $1.65 a share from $1.50.
Interest rates are the second driver. Higher long-term yields can lift lending profits over time, but a sharp bond selloff reduces the value of bank bond portfolios. So the path of Treasury yields will shape sentiment through year-end.
New fee businesses add support. J.P. Morgan Asset Management signed a $20 billion partnership with the Qatar Investment Authority, including $5 billion to finance U.S. midsize companies. Deals like this build income that does not depend on interest rates.
Leadership and AI round out the picture. Dimon said in January that he wants to stay at least five more years, which reassures investors about continuity. Going forward, AI spending could lower costs, although Meta’s new AI agent has revived disruption fears across financial services.
Compare JPMorgan’s valuation with every major U.S. bank (Free with TIKR) >>>
Should You Invest in JPMorgan Chase?
The only way to really know is to look at the numbers yourself. TIKR gives you free access to the same institutional-quality financial data that professional analysts use to answer exactly that question.
Pull up JPM, and you’ll see years of historical financials, what Wall Street analysts expect for revenue and earnings in the quarters ahead, how valuation multiples have moved over time, and whether price targets are trending up or down.
You can build a free watchlist to track JPM alongside every other stock on your radar. No credit card required. Just the data you need to decide for yourself.
Analyze JPM stock on TIKR Free→
Disclaimer:
Please note that the articles on TIKR are not intended to serve as investment or financial advice from TIKR or our content team, nor are they recommendations to buy or sell any stocks. We create our content based on TIKR Terminal’s investment data and analysts’ estimates. Our analysis might not include recent company news or important updates. TIKR has no position in any stocks mentioned. Thank you for reading, and happy investing!