
Key Stats for IT Stock
- Past-30-Day Performance: 7%
- 52-Week Range: $139 to $447
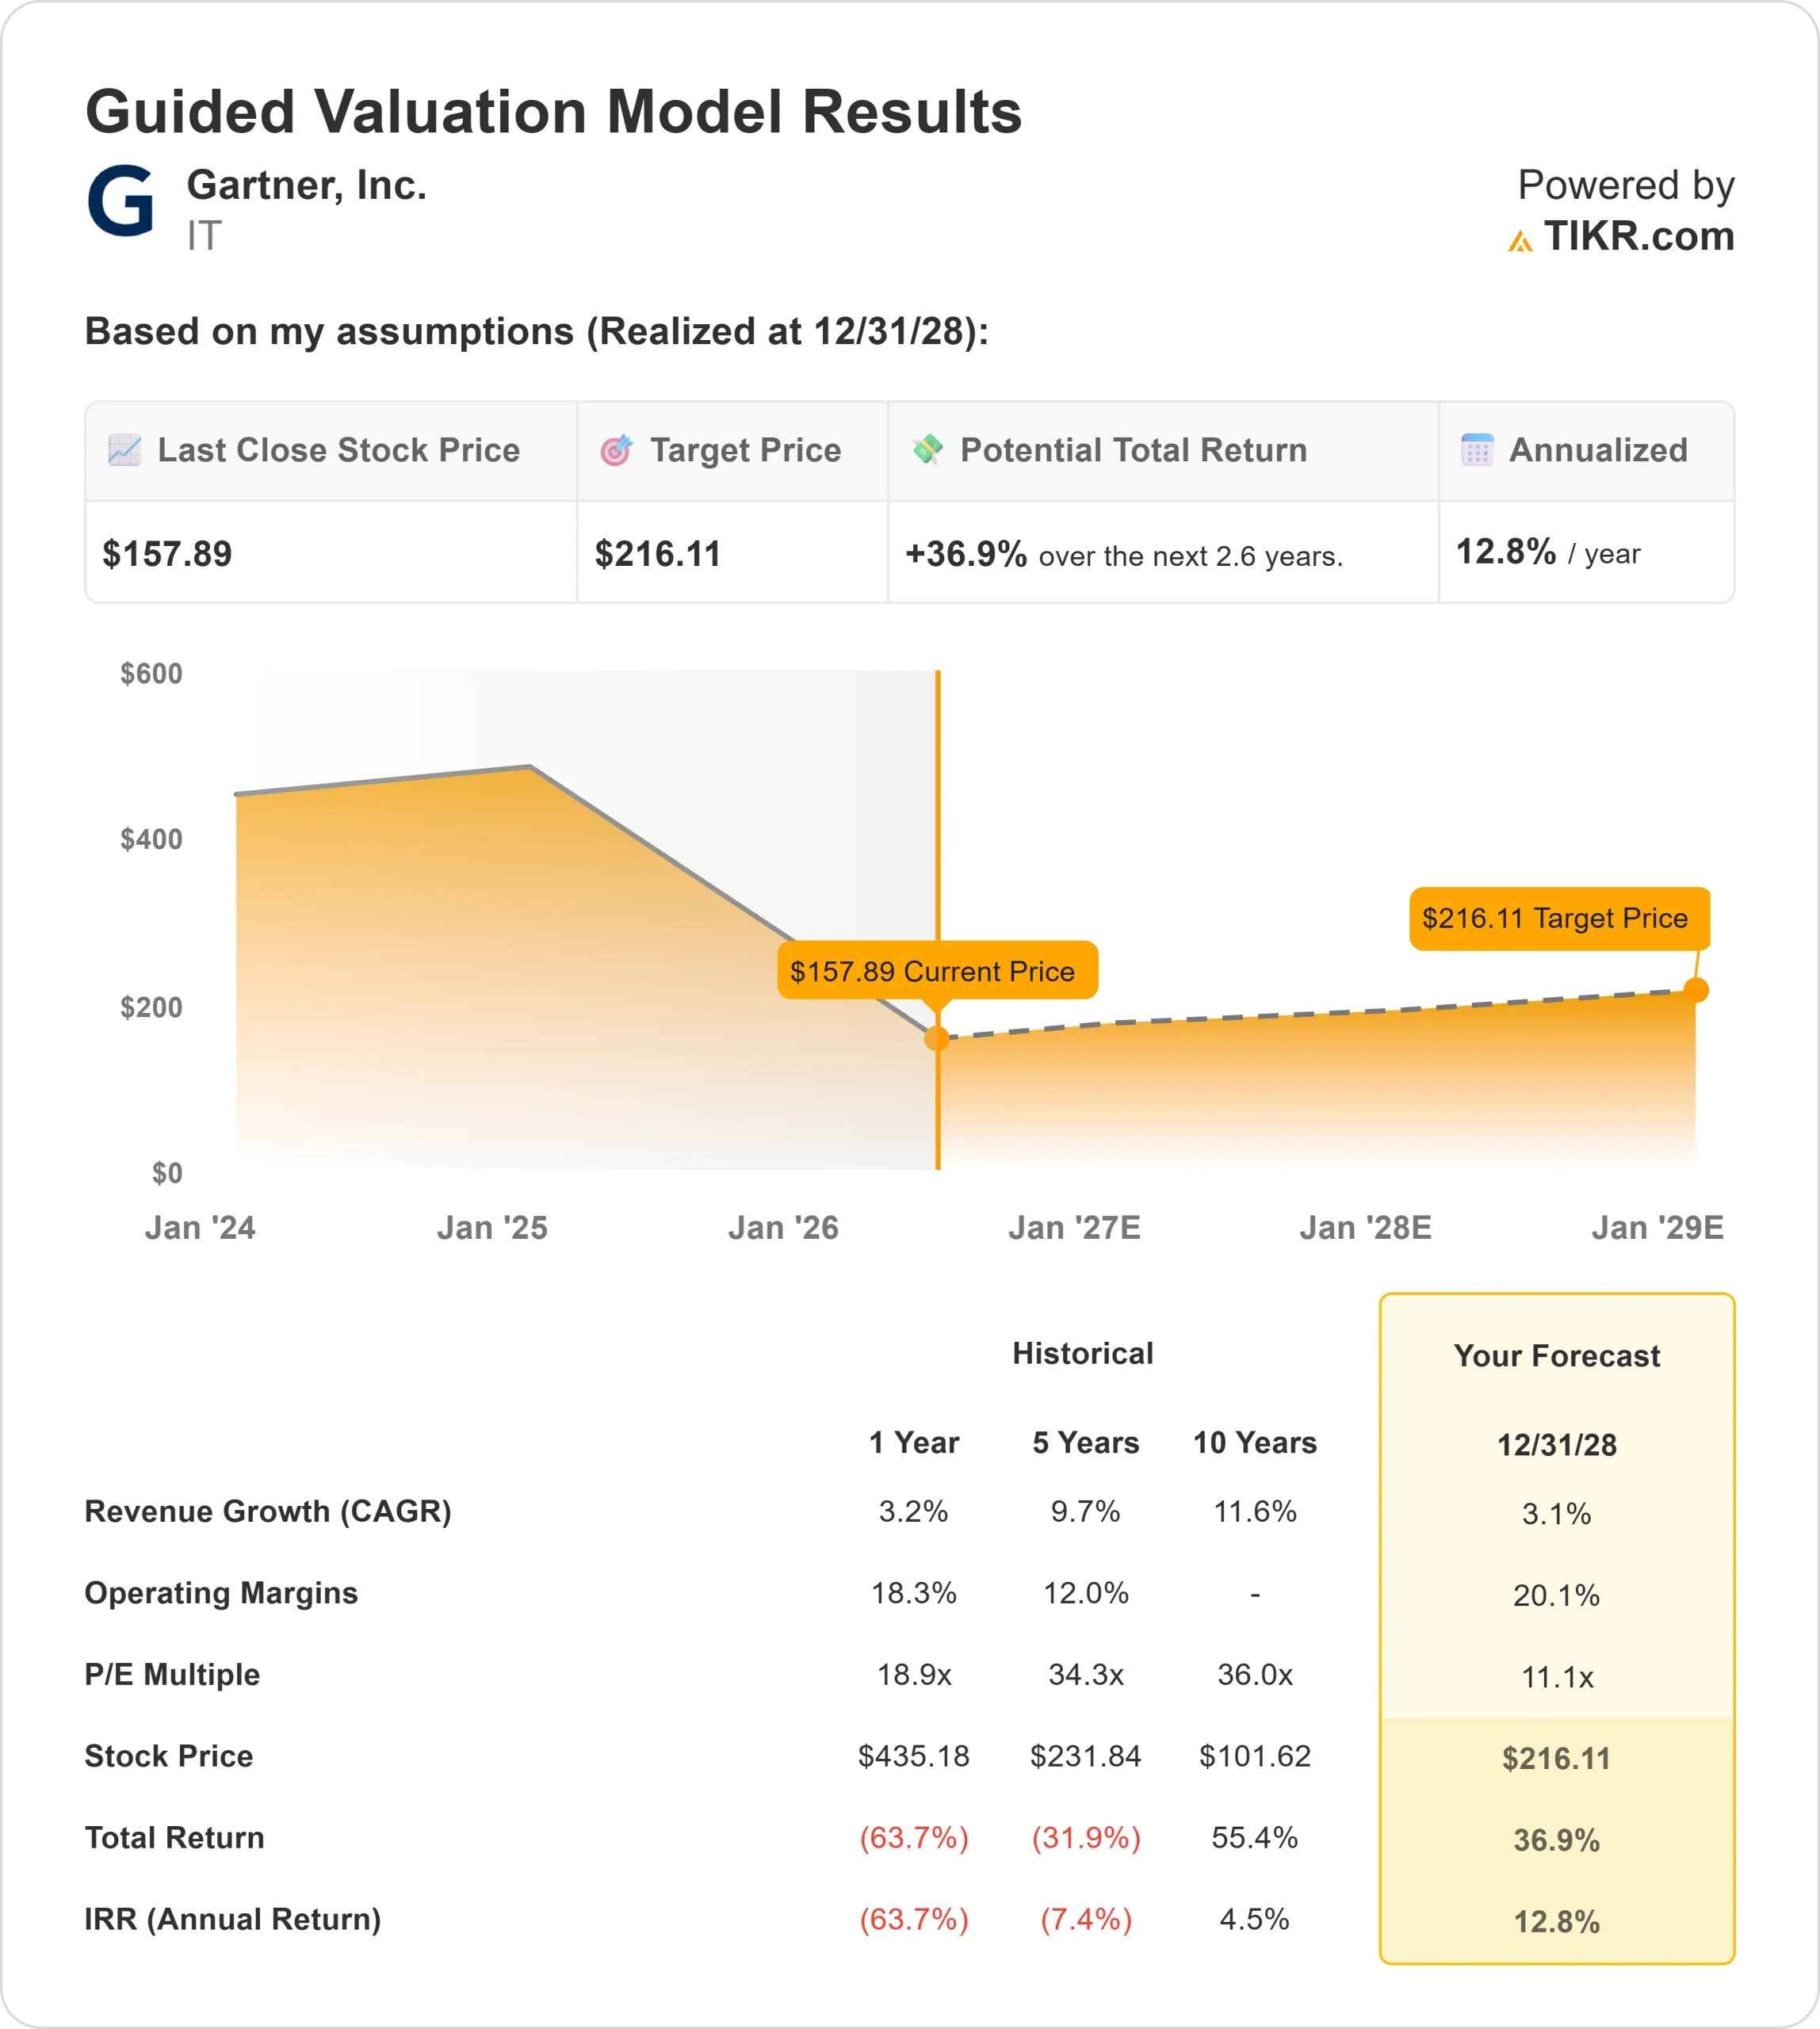
- Valuation Model Target Price: around $216
- Implied Upside: about 37%
Analyze your favorite stocks like Gartner with TIKR (It’s free) >>>
What Happened?
Gartner Inc. stock rose about 7% over the last 30 days, recently trading near $159 per share as investors warmed back up to a beaten-down research and advisory stock that had already reset sharply from its highs. Gartner sells subscription research, advisory tools, consulting, and conferences to senior enterprise executives, so the key debate is whether companies will keep paying for outside decision support while budgets stay tight and AI changes how executives gather information. The company competes most directly with Forrester Research, IDC, and ISG in technology research and advisory, while also overlapping with Accenture, Deloitte, and McKinsey in broader consulting and executive decision-support work.
The stock moved higher because Gartner’s Q1 update showed stronger earnings, higher free cash flow, raised 2026 profit guidance, and aggressive buybacks despite uneven client demand. Adjusted revenue was about $1.5 billion, adjusted EPS rose 11% to $3.32, free cash flow increased 29% to $371 million, and Gartner repurchased $535 million of stock during the quarter.
Analyst updates also helped frame the rebound, with UBS raising its target to $170 from $166 and BMO lifting its target to $177 from $175, while Deutsche Bank trimmed its target to $180 from $183 and Morgan Stanley lowered its target to $183 from $200.
This month’s earnings call added more detail behind the move, with CEO Gene Hall saying, “we expect contract value will accelerate.” Contract value reached $5.3 billion, up 1% year over year, and management raised its 2026 outlook for EBITDA, adjusted EPS, and free cash flow. That matters because contract value is Gartner’s clearest signal for future subscription revenue, retention, and earnings growth.
Recent institutional filing updates added another layer to the story. Mitsubishi UFJ Trust & Banking raised its Gartner stake by 27% in Q4 to about 116,000 shares worth roughly $29 million, while Vanguard trimmed its position by 10% to about 9 million shares but still remained a major shareholder. That mixed positioning helps explain the stock’s choppy rebound: some institutions are buying the reset, while others are waiting for clearer proof that contract value growth is accelerating again.
Value Gartner instantly (Free with TIKR) >>>
Is Gartner Undervalued?
Under valuation assumptions, the stock is modeled using:
- Revenue Growth (CAGR): around 3%
- Operating Margins: around 20%
- Exit P/E Multiple: around 11x
Gartner’s valuation model points to a target price of around $216 by 2028, implying about 37% upside from the model’s recent price near $158 over about 3 years.
That upside depends less on fast revenue growth and more on whether Gartner can turn modest subscription growth into stronger earnings through pricing, retention, buybacks, and tighter cost control.
The 11x exit P/E multiple looks conservative compared with Gartner’s longer-term historical valuation, which gives the stock room to work if contract value growth improves and investors regain confidence in the company’s earnings durability.

See analysts’ growth forecasts and price targets for Gartner (It’s free) >>>
The key business driver over the next 12 months is contract value growth, because better renewals and stronger new business would show that Gartner’s core research platform is stabilizing after a slower demand period.
At current levels, Gartner appears undervalued, with future performance likely driven by contract value recovery, high-margin Insights revenue, free cash flow growth, and continued share repurchases rather than aggressive top-line acceleration.
How Much Upside Does Gartner Stock Have From Here?
Investors can estimate Gartner’s potential share price, or what any stock could be worth, in under a minute using TIKR’s New Valuation Model tool.
All it takes is three simple inputs:
- Revenue Growth
- Operating Margins
- Exit P/E Multiple
From there, TIKR calculates the potential share price and total returns under Bull, Base, and Bear scenarios so you can quickly see whether a stock looks undervalued or overvalued.
If you’re not sure what to enter, TIKR automatically fills in each input using analysts’ consensus estimates, giving you a quick, reliable starting point.