


Key Stats for ExxonMobil Stock
- Current Price: $141.69
- Target Price (Mid): ~$158
- Street Target: ~$170
- Potential Total Return: ~11%
- Annualized IRR: ~2% / year
- Earnings Reaction: +3.85% (July 7, 2026)
Now Live: Discover how much upside your favorite stocks could have using TIKR’s new Valuation Model (It’s free) >>>
A $5 Billion Preview, Priced Off Oil That Has Already Moved
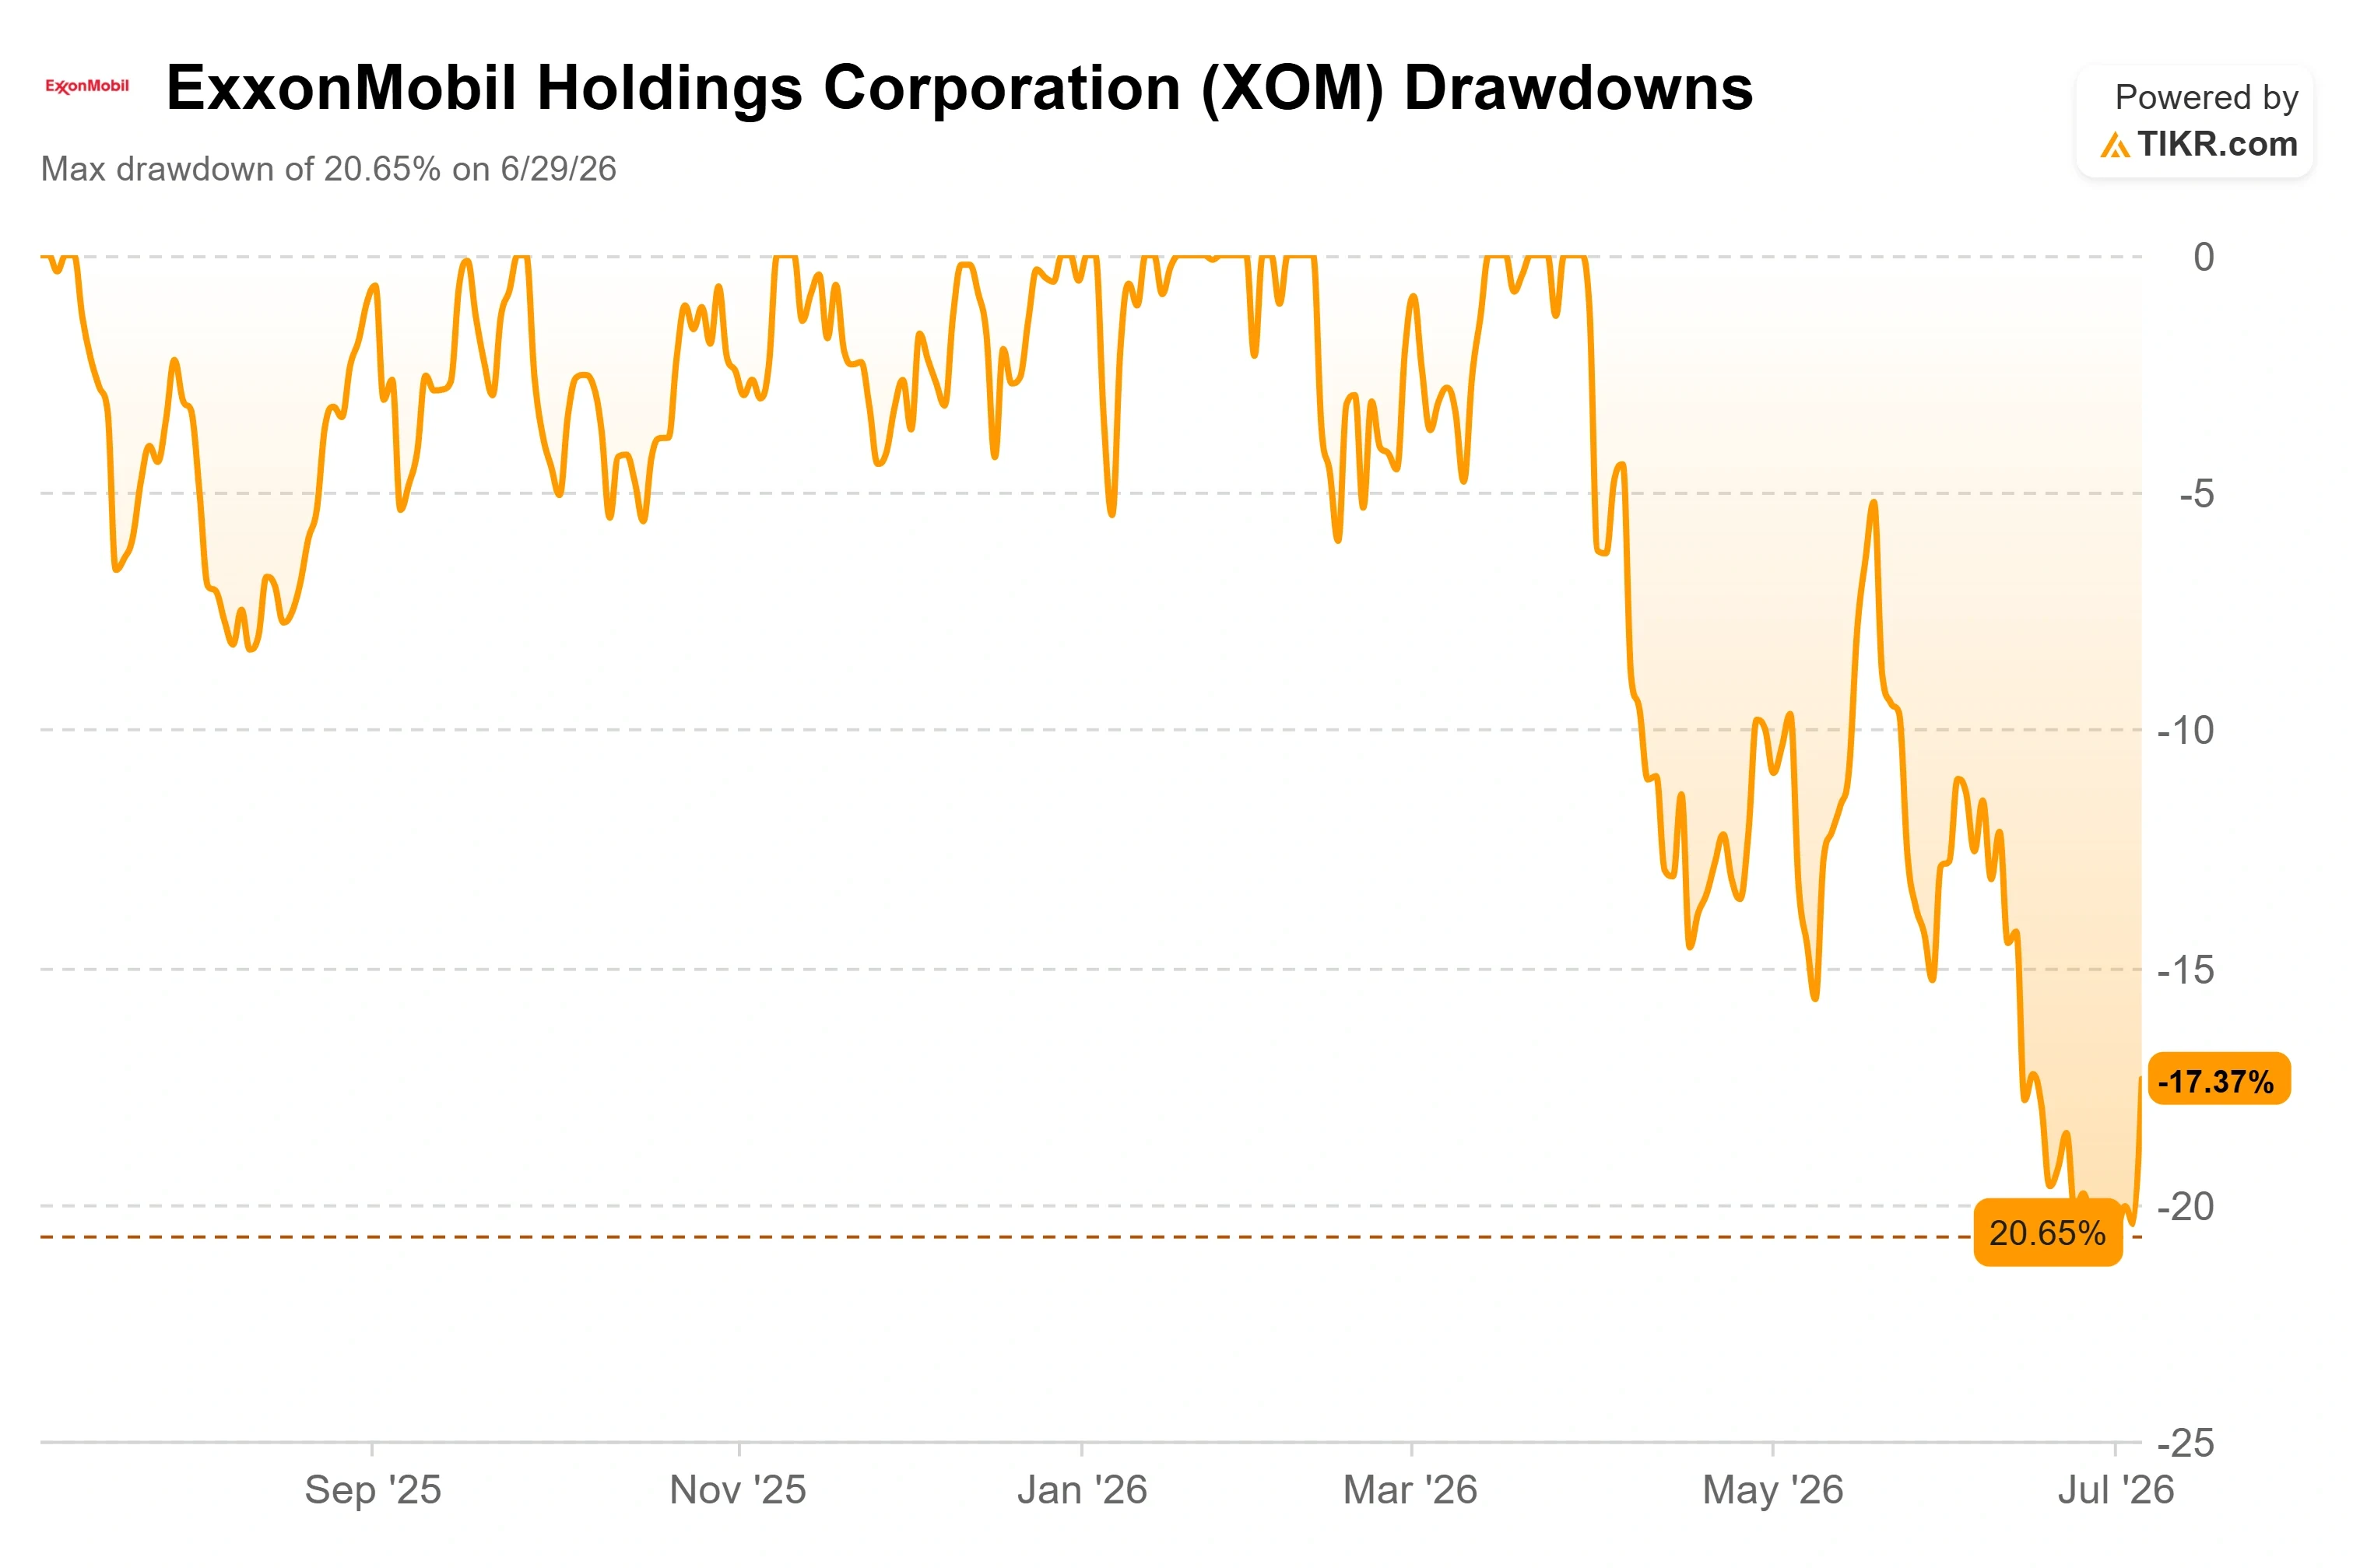
ExxonMobil (XOM) just handed investors a rare piece of good news, and the timing could not be stranger. On July 7, the company filed a regulatory snapshot signaling that second-quarter earnings could rise about $5 billion versus the first quarter, driven by higher liquids prices and stronger refining margins. The stock closed up 3.85% at $141.69 that same day, though the move rode a mix of drivers, including oil rebounding on fresh Middle East tension and the company’s recent move to Texas. For a supermajor that spent the first quarter buried under derivative losses, a five-billion-dollar swing is still the kind of headline bulls have waited months for.
Here is the problem. That windfall is a rear-view mirror. It reflects a quarter when Brent crude averaged around $97 a barrel because the Strait of Hormuz, the chokepoint that carries roughly a fifth of the world’s seaborne oil, was effectively shut. By early July, the strait was reopening, Iranian barrels were flowing again, and Brent had slid back toward $70. Then, on July 8, oil lurched the other way: Brent jumped roughly 6% toward $78 after U.S. forces struck Iran in response to three tankers attacked near the strait, and President Trump declared the ceasefire “over.”
So investors are being asked to weigh a profit number built on prices the market has already left behind, while the commodity that sets ExxonMobil’s value swings 6% in a single session on geopolitics no one can forecast. The real question is not whether Q2 was good. It was. The question is what ExxonMobil is worth once the war premium finishes unwinding, and whether today’s $141.69 already answers it.
What Management Actually Signaled
The July 7 filing was not an earnings report. It was ExxonMobil’s standard mid-quarter snapshot, a set of market and planned factors management expects to move results. According to the filing, the change in liquids prices alone should lift Q2 results by roughly $3.5 billion to $3.9 billion versus Q1, with refining timing effects adding around $2.6 billion. Upstream, the exploration and production arm, could see profits rise about $1.6 billion at the midpoint. Analysts now model Q2 adjusted net income near $15.9 billion, a sharp recovery from a first quarter that TIKR data shows dragged actual net income to roughly $4.9 billion.
That recovery is the whole bull thesis in one number. Q1 was distorted by a paper derivatives loss, not an operating collapse, because ExxonMobil’s trading desk locks in forward prices on physical cargoes while the financial hedge marks to market at quarter-end. As those physical deliveries complete, the mismatch reverses. Q2 is where it reverses. The free cash flow swing tells the same story: LTM levered free cash flow sat near $14.8 billion as of March 31, but TIKR’s forward estimate points to roughly $51 billion, a gap that reflects Permian and Guyana volume growth layering on top of a depressed base.
See historical and forward estimates for ExxonMobil stock (It’s free!) >>>
The Bull Case Management Already Made
The most important thing management has said about this stock this year did not come in the July snapshot. It came in late May, at the Bernstein Strategic Decisions Conference, where Senior Vice President Neil Chapman laid out why ExxonMobil claims it does not need high oil prices to work. His point was blunt: the company has not sanctioned an upstream investment above a $35 cost-of-supply threshold since 2018. As Chapman put it, “if the price was $35 Brent for the entire life of that project, we would still make a 10% return.” In the Permian, he said, the cost of supply is now “$30 or less.”
That is the direct rebuttal to the “oil crashed, thesis broken” reflex. If ExxonMobil’s growth barrels stay profitable at $35 Brent, then the difference between $70 oil and $97 oil is a difference in how much the company earns, not whether it earns. Chapman was equally direct on the structural cost program, noting the company has taken $15 billion of costs out over the last six years and plans “another $5 billion out by the end of the decade.” He framed the runway as unmatched: “The runway for this corporation is unmatched of anything that we’ve had in the last 40 years.” That matters because it reframes the recent oil slide from an existential threat into a swing factor around a business that keeps lowering its own breakeven.
Where the Street Is Moving
Consensus is caught in exactly this tension. The Street mean target sits around $170, roughly 20% above today’s price, yet analysts have been trimming into the print. TD Cowen cut its target to $155 from $172 while keeping a Buy, Morgan Stanley trimmed to $168 from $171 at Overweight, and Bernstein moved to $182 from $195. Wolfe Research went further and downgraded the stock to Peer Perform. The current breakdown across covering analysts is 8 Buys, 3 Outperforms, 12 Holds, 1 Underperform, and 1 Sell, a heavy hold weighting that says the Street sees a fairly valued capital-return machine, not a screaming buy.
On valuation, ExxonMobil carries a premium its European peers do not. It trades at roughly 6.8x NTM EV/EBITDA, against Shell at around 4.0x and TotalEnergies at around 4.1x, per TIKR’s competitor data. Chevron sits closer at around 4.8x. That premium reflects ExxonMobil’s cleaner balance sheet, its lower direct exposure to any single chokepoint, and a cost-and-technology program peers cannot copy quickly. Whether the premium holds once the Hormuz risk premium fully fades is the question worth asking on every rally.
See how ExxonMobil performs against its peers in TIKR (It’s free!) >>>
TIKR Advanced Model Analysis
- Current Price: $141.69
- Target Price (Mid): ~$158
- Potential Total Return: ~11%
- Annualized IRR: ~2% / year

See analysts’ growth forecasts and price targets for ExxonMobil stock (It’s free!) >>>
The two revenue drivers are Permian production growth, where output is targeted to reach 2.5 million barrels per day by 2030, and Product Solutions margin recovery as the Chemical Products segment normalizes from below-mid-cycle levels. The margin driver is the structural cost program, which is forecast to push net income margins from around 9% toward around 11%. The primary risk runs the other way: a durable resolution in the Middle East that sends Brent toward $70 to $75 and compresses upstream realizations.
Stretched over the model’s longer 2025 to 2035 forecast window, the scenario spread widens. The low case sits near $156, and the high case reaches around $233, a range that maps almost entirely to where oil settles rather than to execution. The upside skews to whoever is right on crude, while the mid-case says the market already pays a fair price for the transformation.
Conclusion
Watch two things when ExxonMobil reports Q2 2026 results, expected in late July. First, Permian production volume: management has guided in prior updates to roughly 200,000 barrels per day of annual growth, and a print tracking toward a 1.8 million barrels per day exit rate keeps the operational story intact. A clear miss makes the premium harder to defend. Second, watch how much of the flagged ~$5 billion earnings jump actually lands as cash rather than paper, because the entire “Q1 was just timing” argument depends on that reversal showing up. Good looks like Permian volume on plan and free cash flow snapping back toward the forward estimate. Bad looks like soft volumes plus another quarter where trading and hedging effects eat the headline. The dividend, grown for 43 straight years and yielding around 3%, is the floor under the wait. Everything above it depends on where oil settles, and right now, oil cannot decide.
See what stocks billionaire investors are buying so you can follow the smart money with TIKR.
Should You Invest in ExxonMobil?
The only way to really know is to look at the numbers yourself. TIKR gives you free access to the same institutional-quality financial data that professional analysts use to answer exactly that question.
Pull up ExxonMobil, and you’ll see years of historical financials, what Wall Street analysts expect for revenue and earnings in the quarters ahead, how valuation multiples have moved over time, and whether price targets are trending up or down.
You can build a free watchlist to track ExxonMobil alongside every other stock on your radar. No credit card required. Just the data you need to decide for yourself.
Analyze ExxonMobil on TIKR Free →
Looking for New Opportunities?
- See what stocks billionaire investors are buying so you can follow the smart money.
- Analyze stocks in as little as 5 minutes with TIKR’s all-in-one, easy-to-use platform.
- The more rocks you overturn… the more opportunities you’ll uncover. Search 100K+ global stocks, global top investor holdings, and more with TIKR.
Disclaimer:
Please note that the articles on TIKR are not intended to serve as investment or financial advice from TIKR or our content team, nor are they recommendations to buy or sell any stocks. We create our content based on TIKR Terminal’s investment data and analysts’ estimates. Our analysis might not include recent company news or important updates. TIKR has no position in any stocks mentioned. Thank you for reading, and happy investing!


