Key Stats for ET Stock
- Past week’s performance: +1.4%
- 52-week range: $16 to $21
- Valuation model target price: $27
- Implied upside: 43% over the next 2.5 years
Analyze Energy Transfer’s distribution coverage and valuation on TIKR >>>
A Leadership Change at the Top of a $155 Billion Pipeline
Energy Transfer LP (ET) is one of the largest midstream energy companies in the United States. The partnership operates roughly 130,000 miles of pipeline infrastructure that moves natural gas, crude oil, refined products, and natural gas liquids across the country. Midstream companies earn fees for transporting and storing energy, so their cash flows are far more stable than those of producers.
In early June, Energy Transfer disclosed that co-CEO Marshall McCrea III will retire on or before December 31, 2026. McCrea has been a central figure in building the company’s commercial and operational capabilities. His departure is a genuine governance event, and the announcement did not come with a named successor, which is typically where markets apply a modest risk premium until the transition becomes clearer.
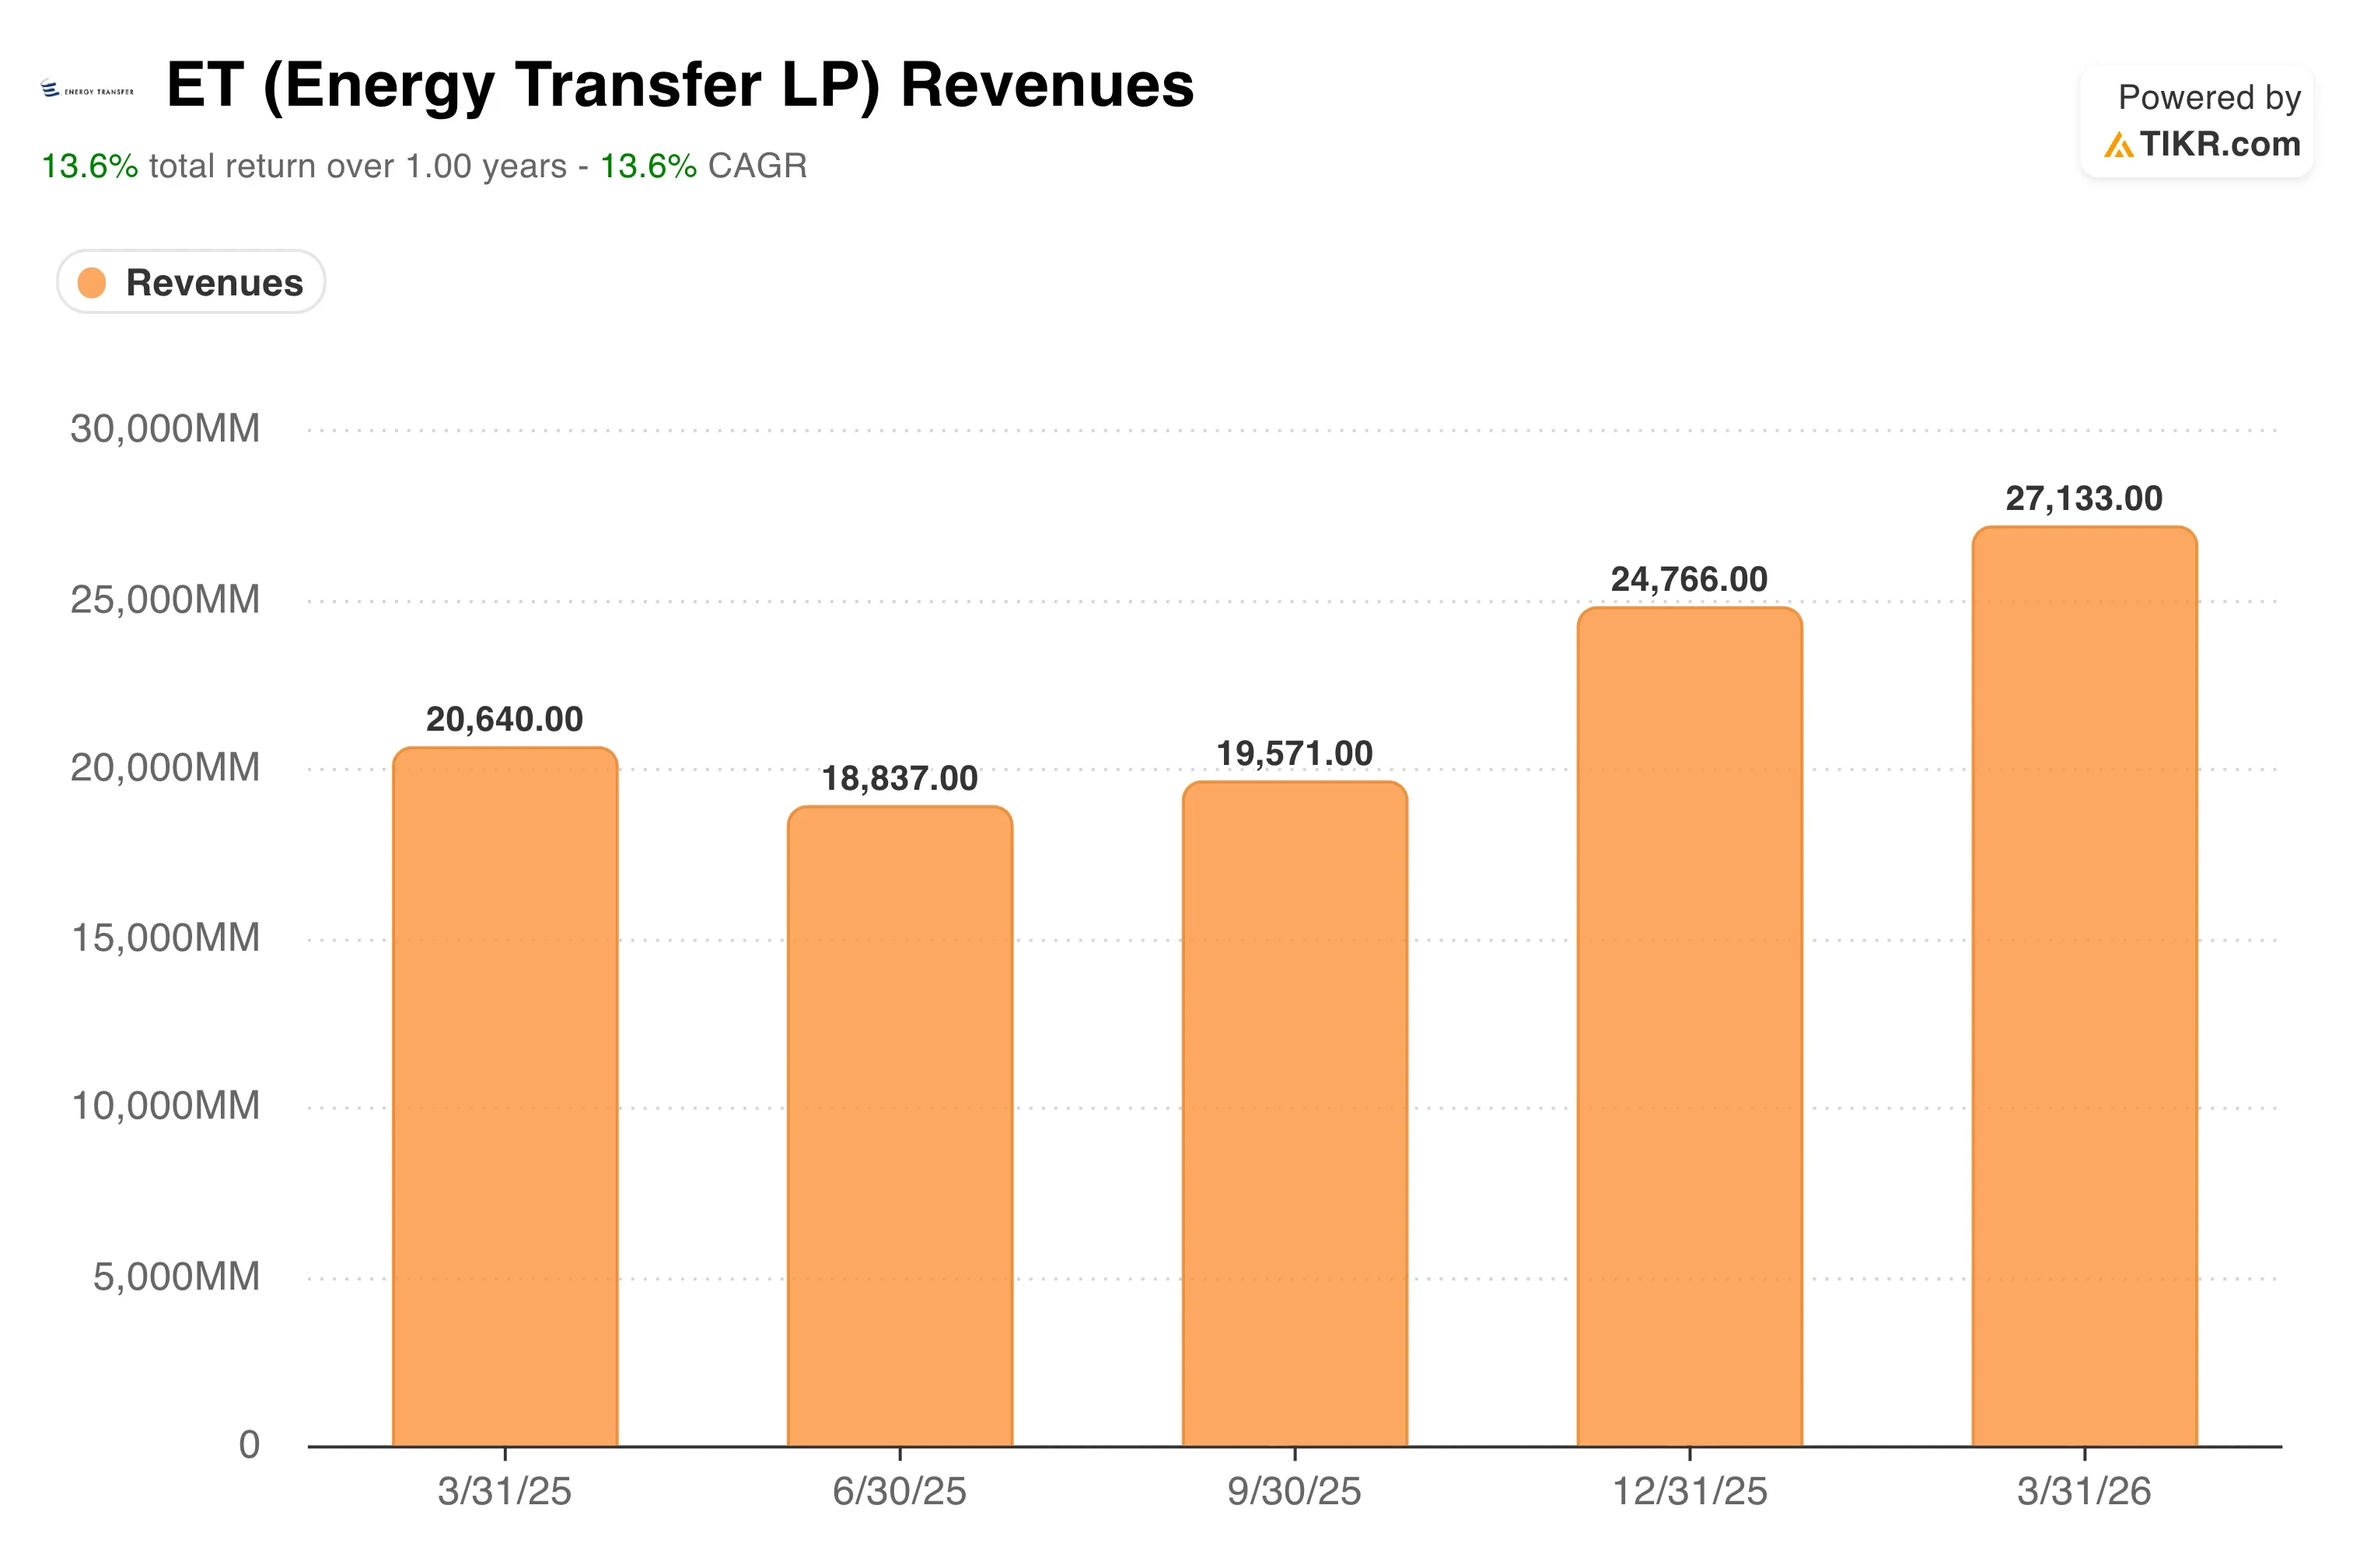
The Q1 2026 results, reported on May 5, provided a strong operating backdrop. Energy Transfer posted Q1 revenue of $27.77 billion, up 32% year over year. Adjusted EBITDA reached $4.94 billion, up 20% from the prior year. The results were strong enough that management raised full-year 2026 adjusted EBITDA guidance to a range of $18.2 billion to $18.6 billion, an increase of $750 million at the midpoint.
Co-CEO Tom Long said on the earnings call: “The results for the first quarter show how incredibly well-positioned our assets are across the country. Combining our extensive pipeline network, our storage facilities, and our terminals with our exceptionally experienced optimization and operating teams, we can capitalize on quickly changing dynamics and market volatility.”
If ET stock holds current levels, the combination of distribution income and potential price appreciation toward the model’s $27 target price represents a total-return setup that is more compelling than the unit price alone suggests.
See analysts’ growth forecasts and price targets for ET (It’s free) >>>
Does a 7.2% Yield With 15% Annualized Returns Add Up?

Under valuation model assumptions realized through 12/31/28, the stock is modeled using:
- Revenue Growth (CAGR): 11.3%
- Operating Margins: 10.1%
- Exit P/E Multiple: 12.5x
Based on these inputs, the model estimates a target price of $27, implying 43% total upside from the current unit price of $19 and a 15.2% annualized return over the next 2.5 years.
A 15.2% annualized return from a midstream pipeline partnership is a genuinely attractive number. But it requires unpacking what drives it. Much of that return comes from the 7.2% annual distribution yield. So the price appreciation component embedded in the model is more modest than the headline figure suggests. That is actually a conservative and credible setup for a business like Energy Transfer.

The 11.3% revenue CAGR assumption is more aggressive than ET’s recent history. The trailing one-year revenue growth was 3.5%. However, Q1 2026 showed a sharp acceleration, with revenue up 32% year over year to $27.77 billion. The forward assumption implies continued large-scale capital deployment in natural gas pipelines tied to LNG export terminals and growing data-center power demand, rather than pure organic volume growth alone.
The 10.1% operating margin forecast is consistent with where ET has operated historically. The midstream business model generates predictable fee-based cash flows. Margin compression typically only arrives when fixed-fee contracts roll off or when commodity prices fall so sharply that counterparties reduce throughput volumes.
At a 12.5x exit P/E, the model values ET roughly in line with midstream sector norms. The current LTM P/E of 16.0x reflects a modest premium as the market prices in AI-adjacent natural gas demand. That premium could persist if data-center power demand accelerates further.
Find out why ET’s natural gas and AI data center demand story still matters >>>
How Energy Transfer Compares to Enterprise Products and Kinder Morgan
Energy Transfer’s closest peers are Enterprise Products Partners (EPD) and Kinder Morgan (KMI), and the comparison reveals both advantages and questions. EPD trades at roughly 13x forward earnings with a distribution yield near 6.5%, while maintaining one of the strongest balance sheets in the midstream sector. EPD’s distribution coverage ratio, which measures how many times distributable cash flow covers the declared distribution, consistently runs above 1.7x, giving it more financial cushion than most peers.
Energy Transfer’s distribution coverage is solid but not at EPD’s level, and its balance sheet carries more leverage. The company’s enterprise value of $155 billion compares to a market cap of $66 billion, reflecting substantial debt used to build its pipeline network. EPD has pursued a more conservative capital structure over time. On revenue growth, ET’s 11.3% forward assumption exceeds what most analysts expect from EPD, which suggests ET is more aggressively chasing new capacity than its peer.

Kinder Morgan trades closer to 20x forward earnings, a meaningful premium to ET’s 13.2x NTM P/E. KMI’s heavier concentration in natural gas infrastructure and its leverage to LNG export demand justify part of that premium. Energy Transfer also has significant natural gas pipeline exposure, but its broader asset mix, which includes crude oil and NGL pipelines, creates a more diversified story.
The leadership transition at ET is a factor neither EPD nor KMI faces right now, and it matters for governance-focused investors. McCrea’s retirement removes a founder-adjacent executive with deep commercial relationships. Until a succession plan is articulated, EPD’s management continuity is a modest comparative advantage.
Estimate a company’s fair value instantly (Free with TIKR) >>>
What’s Driving ET Stock Going Forward?
The co-CEO succession is the most consequential near-term catalyst. Marshall McCrea III will retire on or before December 31, 2026. The identity of his replacement will tell investors whether Energy Transfer is doubling down on commercial growth or shifting toward capital return and balance sheet repair. A named successor with deep midstream relationships would likely be received constructively by the market.
Natural gas demand from data centers and AI infrastructure buildouts is the secular tailwind that has lifted every large-scale pipeline operator’s valuation in 2025 and 2026. KKR’s launch of Helix Digital Infrastructure, in partnership with Nvidia and Vistra, is a signal of how much institutional capital is flowing into AI-adjacent power infrastructure. Energy Transfer’s natural gas pipeline network sits directly upstream of the gas-fired power plants that hyperscalers increasingly rely on, making the partnership an indirect beneficiary of the AI buildout.
Energy Transfer raised its full-year 2026 adjusted EBITDA guidance to $18.2 billion to $18.6 billion, a $750 million increase at the midpoint. That raise was supported by record midstream gathering volumes, record NGL fractionation volumes, and record NGL export volumes in Q1. Those operational records are not cosmetic. They reflect real demand acceleration across the pipeline network, and they provide a credible foundation for the guidance range.
The Q2 2026 results, expected around August 5, will be the next major data point for unitholders. Revenue trajectory, distribution coverage, and any update on the CEO succession plan will be the three metrics driving the next meaningful move in ET units. If coverage remains strong and a succession plan emerges, the current 7.2% yield at $19 could prove to be one of the more attractively priced income setups in the midstream sector.
Estimate a company’s fair value instantly (Free with TIKR) >>>
Should You Invest in Energy Transfer?
The only way to really know is to look at the numbers yourself. TIKR gives you free access to the same institutional-quality financial data that professional analysts use to answer exactly that question.
Pull up ET, and you’ll see years of historical financials, what Wall Street analysts expect for revenue and earnings in the quarters ahead, how valuation multiples have moved over time, and whether price targets are trending up or down.
You can build a free watchlist to track ET alongside every other stock on your radar. No credit card required. Just the data you need to decide for yourself.
Analyze ET stock on TIKR Free→
Looking for New Opportunities?
- See what stocks billionaire investors are buying so you can follow the smart money.
- Analyze stocks in as little as 5 minutes with TIKR’s all-in-one, easy-to-use platform.
- The more rocks you overturn… the more opportunities you’ll uncover. Search 100K+ global stocks, global top investor holdings, and more with TIKR.
Disclaimer:
Please note that the articles on TIKR are not intended to serve as investment or financial advice from TIKR or our content team, nor are they recommendations to buy or sell any stocks. We create our content based on TIKR Terminal’s investment data and analysts’ estimates. Our analysis might not include recent company news or important updates. TIKR has no position in any stocks mentioned. Thank you for reading, and happy investing!